Th
e Perforrmance
Does t
Gunther
of Socia
the Scre
r Capelle-B
ally Resp
eening P
Blancard &
ponsible
Process M
_______
Stéphanie
May
Funds:
Matter?
_______
e Monjon
DOCUMENT DE
TRAVAIL
Table of contents
Non-technical summary ... 3
1.
Introduction ... 7
2.
The impact of screening on SRI fund performance ... 9
2.1
Previous papers ... 9
2.2
A set of testable hypothesis ... 11
3.
The SRI Market in France ... 12
3.1
General market overview ... 12
3.2
The performance of the French SRI mutual funds ... 13
3.3
Data on the screening process ... 14
3.4
Comparison with previous studies ... 17
4.
The determinants of SRI mutual funds’ financial performance ... 18
4.1
Methodology ... 18
4.2
The impact of SRI screens on mutual funds’ performance ... 19
4.3
Discussion and summary ... 21
5.
Conclusion ... 24
References ... 25
Appendix ... 29
List of working papers released by CEPII ... 40
T
HEP
ERFORMANCE OFS
OCIALLYR
ESPONSIBLEF
UNDS:
D
OES THES
CREENINGP
ROCESSM
ATTER?
N
ON-
TECHNICAL SUMMARYSocially Responsible Investment (SRI) is now quite popular in financial markets. This has prompted a surge of interest in the financial performance of mutual funds that practice SRI: Does the inclusion of environmental, social and governance criteria in the investment decision-making process hurt risk-adjusted returns, or does it lead to a “win-win” strategy, a sort of double dividend? As of 2010, more than fifty academic papers have examined this issue, all of which are very uniform in their methodology. They almost unanimously show that financial performance of SRI funds is not significantly different relative to their conventional peers or relative to a benchmark index. Actually, the absence of an overall effect is not surprising. SRI funds are very heterogeneous and socially- or environmentally-friendly investments may be a source of competitive advantage in some situations, but not in all. The debate on the economic and financial impact of corporate social responsibility should move away from the question “does it pay to be good?” to “when does it pay to be good?”. In this paper, we assess the financial performances within SRI mutual funds. In particular, we examine whether the financial performance of these funds is related to the characteristics of the extra-financial screening process. Our sample is composed with French SRI mutual funds.
Modern SRI takes its roots in the US in the 1970s and spread slowly to other Anglo-Saxon countries and to the rest of the world. In Continental Europe, the growth of SRI dates back only to the 1990s. But now, the European market is larger and is expanding faster than the US one. This argument alone could be enough to justify interest in European markets. More importantly, the practices significantly differ on both sides of the Atlantic. In particular, almost all SRI funds in the US use negative screening criteria, which is far from being the case in Europe, particularly in France: thus, in our sample, only one third of the SRI funds use negative screens. Instead, in Europe, the best-in-class approach – where the leading companies with regard to ESG criteria from all industries are included in the portfolio – is the norm. Moreover, the best-in-class approach is often considered at the cutting-edge of SRI. As expected and confirming previous studies, we show that SRI mutual funds do not outperform the market, whatever the performance measure considered.
In the main part of the paper, we examine the significance of the extra-financial screening process on financial performance. To do so, we build three sets of explanatory variables. First, we focus on the number of exclusion criteria to proxy the extent of the screening intensity. We hypothesize a U-shaped relationship between screening intensity, measured by the number of screening criteria, and financial performance. The second variable of interest concerns the type of extra-financial screens used, and whether fund managers focus on specific ESG – environment, social, or governance – issues. In particular, we hypothesize that the only damaging exclusion criteria for SRI investors are those which target specific sectors. Third, we examine the potential impact of the quality of the extra-financial screening process, proxied with the SRI ratings provided by Novethic.
Our study provides some salient results. Overall, we confirm empirically that the SRI screening process may have a cost: the financial performance of SRI funds is hurt by the exclusion of non-socially responsible stocks. Like Barnett and Salomon (2006), we find also that this initial negative effect is partly offset as the number of screens increases. Further, we show that only sectoral screens (such as avoiding sin stocks) pull down financial performance, while transversal screens (commitment to UN Global Compact Principles, ILO/Rights at Work, etc.) do not have any impact. To a lesser extent, we show that the impact of shareholder activism is not significant, and nor is the overall quality
of the SRI selection process (proxied by the rating provided by Novethic). Lastly, it is not clear whether one of the ESG factors influences the financial performance of SRI funds more than the others, but these issues need further analysis.
In a way, these results favor the best-in-class approach. Still, this approach suffers from other drawbacks. For instance, in some cases, SRI funds which follow the best-in-class approach are barely distinguishable from traditional funds. Moreover, the multiplication of criteria can be detrimental to the consistency of the strategy. All in all, even if they lead to poorer financial performance, exclusion funds have the merit of simplicity and reflect well investors’ values.
A
BSTRACTThis paper is about the financial performance of mutual funds that practice Socially Responsible Investing (SRI). First, we measure the financial performance of a sample of 116 French SRI mutual funds over the period 2004-2007. As expected, and according to previous studies, our results show that SRI funds do not outperform the market, whatever the performance measure considered. Then, we assess the financial performances within our sample of SRI funds, as suggested by Barnett and Salomon (2006). Precisely, we examine whether the financial performances of these funds are related to the features of the SRI selection process. We find evidence that a greater screening intensity reduces SRI financial performance, but the relationship runs in the opposite direction when screening gets tougher. Further, we show that only sectoral screens – such as avoiding “sin” stocks – decrease financial performance, while transversal screens – commitment to UN Global Compact Principles, ILO/Rights at Work, etc. – have no impact. Other characteristics of the screening process like shareholder activism, or the overall quality of the SRI process do not have any significant impact either.
JEL Classification: G11, Q56, C32.
Key Words: Socially Responsible Investing (SRI), Sustainable and Responsible
Investment, Ethical Investment, Corporate Social Responsibility (CSR), Portfolio Choice, Ratings.
L’
IMPACT DES CRITERES EXTRA-
FINANCIERS SUR LES PERFORMANCES DES FONDS ETHIQUESR
ESUME NON TECHNIQUEDepuis le début des années 2000, l’encours en France des fonds éthiques – autrement appelés fonds d’investissement socialement responsables (ISR) –a été multiplié par dix. Certes, la pratique reste encore marginale (à peine quelques pourcents des encours totaux), mais cette croissance a suscité un fort intérêt pour les performances financières de ces fonds. Est-il possible de concilier la performance financière avec la protection de l’environnement et la promotion des valeurs sociales ? Pour certains, une gestion soucieuse des parties prenantes est potentiellement source de compétitivité et de gains de productivité pour l’entreprise ; c’est l’idée du « double dividende », des stratégies « gagnantes-gagnantes ». L’idée est séduisante, mais est-elle vérifiée ?
Depuis les années 1990, une cinquantaine d’articles académiques ont abordé cette question. Ces études utilisent la même méthodologie et montrent quasi-unanimement que les fonds ISR ont, en moyenne, des performances financières très similaires aux fonds traditionnels. Ce résultat n’est guère surprenant, d’autant que ces études font l’hypothèse que ces fonds sont homogènes. Or, c’est loin d’être le cas et il semble bien que la question pertinente ne soit pas tant, pour reprendre un adage anglo-saxon, « does it
pay to be good? » que « when does it pay to be good? ».
Dans cet article, nous examinons les différences de performance entre fonds ISR, pour un échantillon de 116 fonds français sur la période 2004-2007. A cet égard, notre article prolonge les travaux de Barnett et Salomon (2006) et de Renneboog, Horst et Zhang (2008). Nous estimons tout d’abord la rentabilité corrigée du risque des fonds ISR : comme attendu, les fonds ISR de notre échantillon ne sur-performent ni ne sous-performent le marché. Nous examinons ensuite – c’est le cœur même de l’article – dans quelle mesure les caractéristiques du processus de sélection conditionnent la performance des fonds ISR. Les informations sur le processus de sélection de chacun des fonds nous ont été fournies par Novethic, le principal centre français de recherche sur l’ISR. Sur la base de ces informations, nous construisons trois groupes de variables. Le premier groupe décrit l’intensité du processus de sélection : le gérant de fonds utilise-t-il des critères d’exclusion ? si oui, combien ? Le second groupe de variables porte sur la nature des filtres extra-financiers utilisés : l’accent est-il mis sur l’environnement, le social, ou la gouvernance d’entreprise ? les critères sont-ils plutôt de type sectoriel ou transversal ? Le troisième groupe concerne la qualité du processus de sélection extra-financière : celle-ci est mesurée en se basant sur les ratings ISR de Novethic qui synthétisent un grand nombre d’informations relatives aux pratiques ISR du fonds (l’équipe est-elle composée de spécialistes ISR ? le fond externalise-t-il la gestion ISR ? la procédure de sélection est-elle transparente ? etc.).
Nos résultats confirment l’existence d’une relation négative entre le nombre de critères d’exclusion et la performance financière des fonds. Mais tous les critères ne se valent pas. En fait, seul les filtres sectoriels (ceux qui conduisent à l’exclusion de toutes les entreprises d’un même secteur) conduisent à une sous-performance des fonds ; les filtres transversaux (tels que l’engagement à respecter les principes du Pacte mondial des Nations Unies, les droits fondamentaux au travail de l’OIT, ...) n’ont quant à eux pas d’impact. Enfin, il semble que les autres caractéristiques du processus de sélection (l’engagement actionnarial du fonds, la qualité du processus, …) n’aient pas non plus d’impact significatif.
En un sens, nos résultats plaideraient plutôt en faveur des fonds best-in-class, par opposition à ceux qui pratiquent l’exclusion et qui sont a priori moins bien diversifiés. Il n’en reste pas moins que l’exclusion a un grand mérite : celui de la simplicité. Et il tout à fait possible que certains investisseurs soient prêts à sacrifier un peu de leur performance financière à condition d’avoir un portefeuille qui reflète mieux leurs valeurs.
R
ESUME COURTCet article traite de la performance financière des fonds socialement responsables (ISR). La plupart des études antérieures ont cherché à savoir si, globalement, les fonds ISR parvenaient à « battre le marché ». Notre intérêt se porte ici sur les différences de performances financières entre fonds ISR. Plus précisément, nous examinons si les performances financières des fonds peuvent être expliquées par les caractéristiques de la sélection extra-financière de leurs placements. Notre échantillon est composé de 116 fonds ISR français sur la période 2004-2007. Les informations sur le processus de sélection de chacun de ces fonds nous ont été fournies par Novethic, le principal centre français de recherche sur l’ISR. Sur la base de ces informations, nous construisons trois groupes de variables : le premier groupe décrit l’intensité du processus de sélection (le gestionnaire de fonds utilise-t-il des critères d’exclusion ? si oui, combien ?). Le second groupe de variables porte sur la nature des filtres extra-financiers utilisés (l’accent est-il mis sur l’environnement, le social, ou la gouvernance d’entreprise ? les critères sont-ils plutôt de type sectoriel ou transversal ?). Le troisième groupe concerne la qualité du processus de sélection extra-financière (mesurée en se basant sur les ratings ISR de Novethic). Nos résultats confirment l’existence d’une relation négative entre le nombre de critères d’exclusion et la performance financière des fonds. Cependant, seuls les filtres sectoriels (ceux qui conduisent à l’exclusion de toutes les entreprises d’un même secteur) conduisent à une sous-performance des fonds ; les filtres transversaux (tels que l’engagement à respecter les principes du Pacte mondial des Nations Unies, les droits fondamentaux au travail de l’OIT, ...) n’ont quant à eux pas d’impact. Enfin, il semble que les autres caractéristiques du processus de sélection (l’activisme du fonds, la qualité du processus, …) n’aient pas non plus d’impact significatif.
Classification JEL: G11, Q56, C32.
Mots-clefs : Investissement socialement responsable (ISR), investissement responsable et
durable, investissement éthique, responsabilité sociale des entreprises (RSE), choix de portefeuille, ratings.
T
HEP
ERFORMANCE OFS
OCIALLYR
ESPONSIBLEF
UNDS:
D
OES THES
CREENINGP
ROCESSM
ATTER?
◊
Gunther Capelle-Blancard
∗ & Stéphanie Monjonϒ1. I
NTRODUCTIONSocially Responsible Investment (SRI) is now quite popular in financial markets. This has prompted a surge of interest in the financial performance of mutual funds that practice SRI: Does the inclusion of environmental, social and governance criteria in the investment decision-making process hurt risk-adjusted returns, or does it lead to a “win-win” strategy, a sort of double dividend? As of 2010, more than fifty academic papers have examined this issue, all of which are very uniform in their methodology. They almost unanimously show that financial performance of SRI funds is not significantly different relative to their conventional peers or relative to a benchmark index.1 Actually, the absence of an overall effect is not surprising. SRI funds are very heterogeneous (Sandberg et al., 2009) and socially- or environmentally-friendly investments may be a source of competitive advantage in some situations, but not in all. As emphasized by King and Lenox (2001) or Ambec and Lanoie (2007), amongst others, the debate on the economic and financial impact of corporate social responsibility should move away from the question “does it pay to be good?” to “when does it pay to be good?”. Among the many studies on the financial performance of SRI funds, very few examine the issue from this angle. In this regard, the contributions of Barnett and Salomon (2006) and Renneboog, Ter Horst and Zhang (2008b), following by Lee, Humphrey, Benson and Ahn (2010), Renneboog, Ter Horst and Zhang (2011) and Benson and Humphrey (2011) should be highlighted.
Barnett and Salomon (2006) measure how the type and the intensity of social screening used by SRI funds affect their performance. Their results are obtained from a panel of 61 SRI funds in the US over the period 1972-2000. Unlike previous studies, they do not compare the performance of SRI funds to non-SRI funds. Instead, they focus on the SRI funds’ heterogeneity. Interestingly, they find a curvilinear relationship between screening intensity, measured by the number of screening criteria, and financial performance. Their main result is the following: “as the number of social screens used by an
SRI fund increases, financial returns decline at first, but then rebound as the number of screens reaches a maximum (…), however, performance does not recover to reach the levels achieved by those
◊
The authors thank Agnès Bénassy-Quéré, Dominique Blanc, Patricia Crifo, Olena Havrylchyk, Samer Hobeika, Jacquelyn Humphrey, Isabelle Laudier, Jean-Pierre Sicard, and Stéphane Voisin, as well as participants of the CSR seminar at the Ecole Polytechnique (Business Economics Chair, Paris 2010) and the Finance and Corporate Governance Conference (Melbourne, 2011) for helpful comments. We thank also Barbara Balvet, Kamel Laaradh and Nicholas Sowels for outstanding research assistance. Financial support from the Institut CDC pour la Recherche is gratefully acknowledged.
∗
Cepii & Université Paris 1 Panthéon-Sorbonne. Corresponding author: 106-112 bd. de l’hôpital, 75647 Paris Cedex 13 France. Phone: +33 (0)1 53 68 55 47. E-mail: [email protected].
ϒ
Centre International de Recherche sur l’Environnement et le Développement (CIRED) & Cepii. E-mail: [email protected].
1
Similarly, hundreds of studies examine the relationship between Corporate Social Performance (CSP) and Corporate Financial Performance (CFP) and, overall, report mixed results (see Orlitzky, Schmidt and Rynes, 2003; Margolis, Elfenbein and Walsh, 2007).
funds with one screen”. Moreover, their results suggest that community relations screening increased
financial performance, while environmental and labor relations screening decreased it. Renneboog, Ter Horst and Zhang (2008b) examine the impact of the screening activity on risk-adjusted returns and risk loading. They show that the number of social screens reduces significantly the financial performance of the SRI funds, while the number of ethical screens, the number of sin screens, or the number of environmental screens do not have any significant impact (unfortunately, they do not test for a curvilinear relationship). With a sample similar to that used by Barnett and Salomon (2006), that is 61 US SRI funds over the period 1989-2006, Lee, Humphrey, Benson and Ahn (2010) confirm that the number of screens negatively impacts SRI fund performance; moreover, they show that screening intensity results in lower systematic risk. Interestingly, Humphrey and Lee (2011) find weak evidence that screening intensity increases (instead of decreases) risk-adjusted performance of SRI funds in Australia.
In this paper, we assess the financial performances within SRI mutual funds. In particular, we examine whether the financial performance of these funds is related to the characteristics of the extra-financial screening process. Our paper departs from the existing literature in two ways.
First, we consider French SRI mutual funds. Modern SRI takes its roots in the US in the 1970s and spread slowly to other Anglo-Saxon countries and to the rest of the world. In Continental Europe, the growth of SRI dates back only to the 1990s. But now, the European market is larger and is expanding faster than the US one.2 This argument alone could be enough to justify interest in European markets. More importantly, the practices significantly differ on both sides of the Atlantic (Louche and Lydenberg, 2006; Sandberg et al., 2009). Shareholder advocacy, for instance, is rather specific to the US market, for both cultural and regulatory reasons. Furthermore, almost all SRI funds in the US (as well as in Anglo-Saxon countries, particularly in Australia) use negative screening criteria, which is far from being the case in Europe, particularly in France: thus, in our sample, only one third of the SRI funds use negative screens. Instead, in Europe, the best-in-class approach – where the leading companies with regard to ESG criteria from all industries are included in the portfolio – is the norm. Moreover, the best-in-class approach is often considered at the cutting-edge of SRI (Statman and Glushkov, 2009; Landier and Nair, 2008). Therefore, one may question the relationship between the screening intensity and the SRI funds’ financial performance.
Second, we do not consider only the intensity and the type of the screening process, but also its nature and its quality. Such improvement is possible thanks to our rich database. Our sample is composed of 116 French SRI mutual funds over the period 2004-2007. Information about the funds is provided by Novethic, the leading research center in France on SRI. For this study, we collected information about the basic characteristic of the funds (net asset value, size, age, etc.) and on the screening process (intensity, type, quality, etc.).
On the methodological side, our paper proceeds in two steps. First, we assess the risk-adjusted return of the French SRI mutual funds. As expected and confirming previous studies, we show that French SRI mutual funds do not outperform the market, whatever the performance measure considered. Then, we examine the significance of the extra-financial screening process on financial performance. To do so, we build three sets of explanatory variables. First, we focus on the number of exclusion criteria to proxy the extent of the screening intensity. Following Barnett and Salomon (2006), we hypothesize a
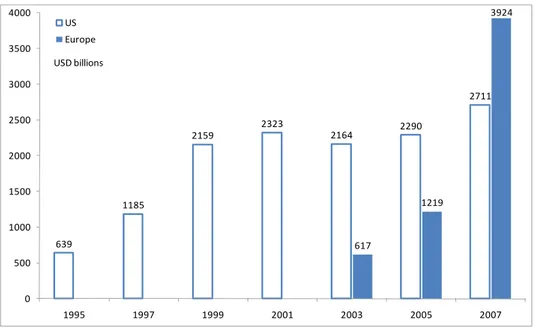
2
In 2007, the European SRI market is estimated to be worth about US$ 4,000 billion (1,200 billion in 2005), while the US SRI market is US$ 2,700 billion (2,300 billion in 2005) according to Eurosif and the US Social Investment Forum. It should be noted that these figures should be considered as upper bounds. For a critical appraisal of the growth of the SRI market, see Capelle-Blancard and Monjon (2010).
negative impact of the number of screens on risk-adjusted performance. The second variable of interest concerns the type of extra-financial screens used, and whether fund managers focus on specific ESG – environment, social, or governance – issues. In particular, we hypothesize that the only damaging exclusion criteria for SRI investors are those which target specific sectors. Third, we examine the potential impact of the quality of the extra-financial screening process, proxied with the SRI ratings provided by Novethic.
Our study provides some salient results. Overall, we confirm empirically that the SRI screening process may have a cost: the financial performance of SRI funds is hurt by the exclusion of non-socially responsible stocks. Like Barnett and Salomon (2006), we find also that this initial negative effect is partly offset as the number of screens increases. Further, we show that only sectoral screens (such as avoiding sin stocks) pull down financial performance, while transversal screens (commitment to UN Global Compact Principles, ILO/Rights at Work, etc.) do not have any impact. To a lesser extent, we show that the impact of shareholder activism is not significant, and nor is the overall quality of the SRI selection process (proxied by the rating provided by Novethic). Lastly, it is not clear whether one of the ESG factors influences the financial performance of SRI funds more than the others, but these issues need further analysis.
The remainder of the paper is organized as follows. Section 2 briefly surveys the empirical literature on the financial performance of SRI funds and proposes a set of testable hypotheses. Section 3 presents the French SRI market and the data used in the study. Section 4 examines the determinants of the risk-adjusted returns of the French SRI mutual funds. Section 5 concludes.
2.
T
HE IMPACT OF SCREENING ONSRI
FUND PERFORMANCE2.1 Previous papers
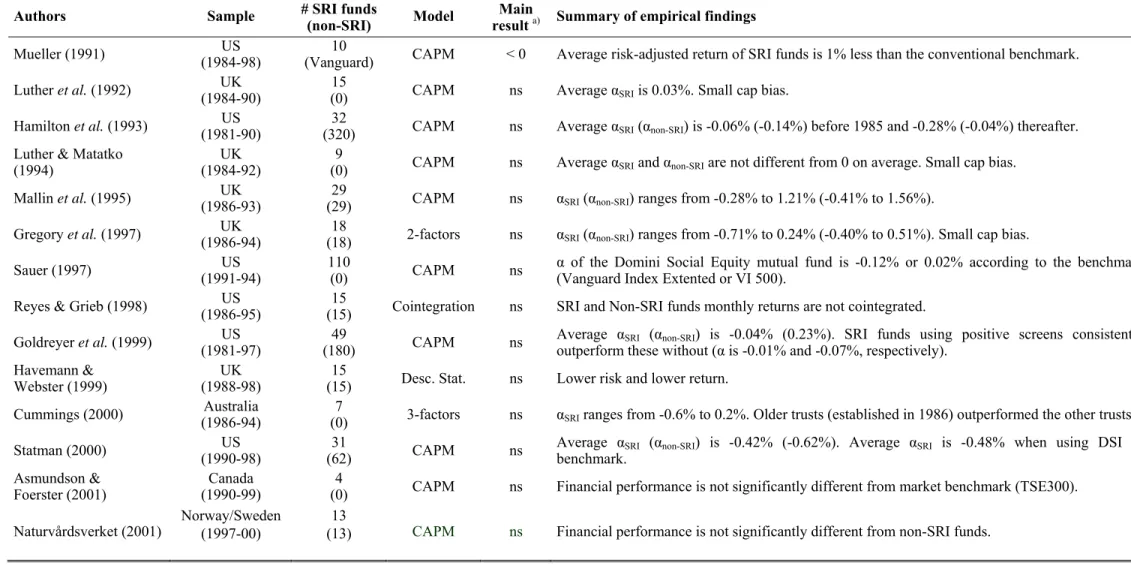
SRI has been the subject of a good deal of research. Among all the publications on SRI, those dealing with financial performance are by far the most numerous (see Capelle-Blancard and Monjon, 2010). Table A in the Appendix lists more than fifty academic papers on SRI fund performance published between 1992 and 2011. If we draw together the data, these studies cover several hundred funds in almost twenty countries over the period 1963-2008. Most of them used roughly the same methodology (they used the CAPM or a multifactor model to assess the risk-adjusted return of SRI funds), albeit more recent studies have access to larger samples and use more sophisticated ways of measuring performance. Whatever, their main conclusion is the same: SRI fund performance is no better or no worse than that of conventional (non-SRI) funds.
Almost all academic studies find no significant results, including Statman (2000) or Bauer et al. (2005, 2006, 2007) who are often cited as prime examples. A comprehensive review of the academic literature brings out seven studies (Mueller, 1991; Tippet, 2001; Miglietta, 2004; Jones et al., 2007; Jégourel and Maveyraud, 2008; Renneboog et al., 2008a; and Hong and Kostovetsky, 2010) finding that SRI funds significantly under-performed. Only one (Gil-Bazo et al., 2008) finds that SRI funds significantly outperformed their conventional peers when the asset management company is specialized in SRI.3 Likewise, studies concerning SRI stock indexes (e.g. Luck and Pilotte, 1993; Statman, 2000, 2006; Jin, Mitchell and Piggott, 2005; Collison et al. 2007; Ghoul and Karam, 2007; Schröder, 2007) or SRI stock portfolios (e.g. Diltz, 1995; Kurtz and diBartolomeo, 1996; Guerard,
3
Renneboog, Ter Horst and Zheng (2008a) or United Nations Environment Programme Finance Initiative (2007) provide additional references.
1997; Kempf and Osthoff, 2007) lead also to the conclusion that social or environmental screenings have no significant impact on risk-adjusted returns.
Recently, several studies have proposed not to compare the performance of SRI funds with those of conventional (non-SRI) funds, but to consider the relative performance between SRI funds. By doing this, they provide an in-depth analysis of the relationship between the selection process of SRI funds and their financial performances. These studies are Barnett and Salomon (2006) and Renneboog, Ter Horst and Zhang (2008b), and more recently, Lee, Humphrey, Benson and Ahn (2010), Renneboog, Ter Horst and Zhang (2011) and Humphrey and Lee (2011).4 They are denoted respectively as BS, RTZ08, LHBA, RTZ11 and HL hereafter.5
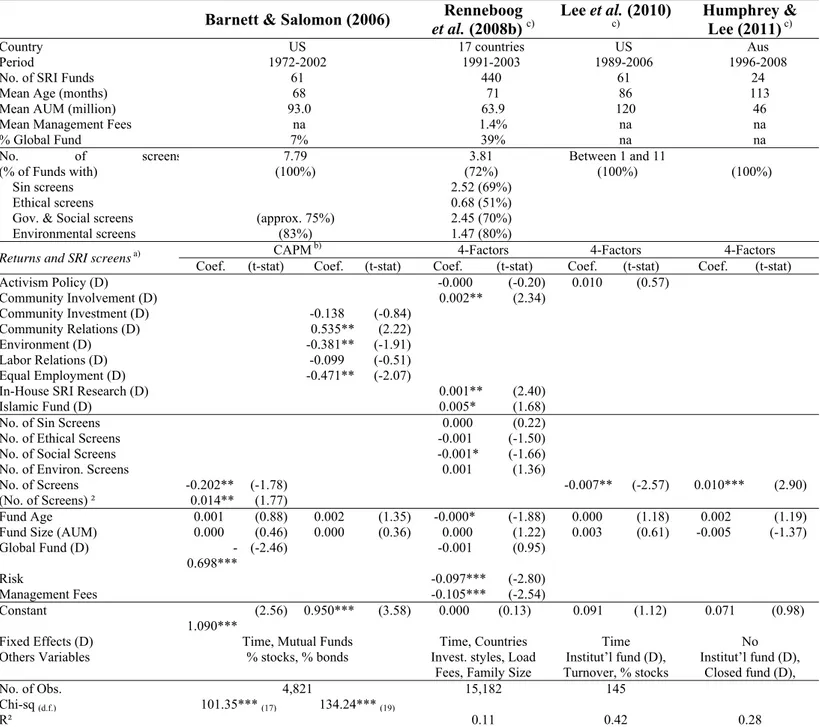
The findings of these papers tend to converge, though neither the data nor the econometric specifications are perfectly comparable (see Table B in the Appendix). BS and LHBA examine 61 US SRI funds over a long time period (1972-2002 and 1989-2006 respectively), while RTZ08 (and RTZ11) examine 440 (321) SRI funds in 17 (23) countries over the period 1991-2003 (1992-2003); HL focus on 24 Australian SRI funds over the period 1996-2008. Overall, the methodology is the same in all studies. Firstly, they use the CAPM (for BS) or a multi-factor model (for RTZ08, RTZ11, LHBA, and HL) to assess the risk-adjusted performance, RAP, of the SRI funds. Secondly, they explore the cross-sectional differences within SRI funds and investigate the determinants of the RAP.6 The definition of the independent variables varies according to the study, but we can classify them into three groups: the screening intensity, the features of the selection process and the control variables.
The screening intensity. The screening intensity is a quantitative variable. The aim is to measure the
strength of the requirements imposed by the fund managers to filter firms. At the same time, it measures the lack of diversification of SRI funds and, in some extent, the quality of the process. The screening intensity is proxied by the number of screens applied by each fund. More precisely, BS, LHBA and HL consider the total number of screens by funds – which varies from one to a dozen. RTZ08 do not consider a unique variable for proxying the screening intensity, but four variables defined according to the screen types. Actually, they identify twenty-one different screening criteria and set apart the number of sin screens (Tobacco, Alcohol, Gambling, Weapons, Pornography), the number of ethical screens (Animal Testing, Abortion, Genetic Engineering, Non-Marital, Islamic, Healthcare), the number of corporate governance and social screens (related to Corporate Governance, Business Practice, Community, Labor Diversity, Labor Relations, Human Rights, Foreign Operations) and the number of environmental screens (Nuclear, Environment, Renewable Energy). Note that among the previous screens, some are positive screens (Healthcare, Environment and Renewable Energy). RTZ11 do not consider the number of screens, but only the screening types.
4
There is also a broad literature on the relationship between financial performance and the characteristic of conventional (non-SRI) funds. See, for instance, Chevalier and Ellison (1999) or Gottesman and Morey (2006).
5
Actually, three others papers (Scholtens, 2007; Jégourel and Maveyraud, 2008; Spekl, 2009) address this issue, albeit to a lesser extent. Scholtens (2007) attempts to associate social and financial performance of SRI mutual funds, but his sample contains only seven funds and two indexes for a three-year period (with annual data). Results suggest that there is no significant correlation between the CSR score and financial returns. Jégourel and Maveyraud (2008) examine the financial performance of 71 European SRI equity funds, classified in three categories according to the number of negatives screens (1 to 4; 5 to 8; 9 to 16). These funds significantly under-perform the Aspi Eurozone or the MSCI Europe indexes whatever the number of screens. Spekl (2009) investigates the impact of the screening intensity on the financial performance of 173 European SRI mutual funds. She finds decreasing risk-adjusted financial performance for increasing screening intensity, but her results are not statistically significant.
6
RTZ08 and RTZ11 also examine the cross-sectional differences between SRI funds and conventional funds but it does not change their conclusion, so we have left these results aside.
The features of the selection process. The second group of variables of interest is of a qualitative
nature. The ultimate goal is to highlight “best practices” among the SRI funds, in terms of financial performance. At least, the funds orientation should be taken into account. BS use the screening criteria (once again) to distinguish between types of SRI funds. They created five dummy variables: Environment (equal to 1 for funds which exclude firms with a record of poor environmental performance), Labor Relations (equal to 1 for funds which exclude firms with a record of poor labor relations practices), Equal Employment (equal to 1 for funds which exclude firms that violate norms of equal employment and diversity at work), Community Investment (equal to 1 for funds which exclude firms that do not invest in and/or develop economically depressed communities), and Community Relations (equal to 1 for funds which exclude firms that have a poor record of accountability to local community stakeholders). RTZ08 do not set apart the impact of the screening intensity and the SRI fund orientation. But in addition to the numbers of screens, they consider the impact of activism policy, community involvement, and in-house SRI research. The same variables are used by RTZ11, but they only consider the screening types (they use a set of three dummy variables for SRI funds that used at least one sin/ethical screen, one social screen, or one environmental screen), instead of the number of screens. LHBA only consider the participation in proxy voting.
The control variables. Lastly, traditional control variables are also considered: fund age, fund size, a
dummy variable if the fund invests abroad, and time fixed effects are generally included. BS also consider the percentage of total assets each fund invests in stock, the percentage of total assets each fund invests in bonds, as well as mutual funds fixed effects. RTZ08 add the total risk of the fund (measured as the standard deviation of monthly fund returns over the last twelve months), the management fees, the load fees, the size of the fund’s family, as well as countries’ fixed effects; RTZ11 include also past flows. LHBA and HL consider, in addition to the traditional controls, the turnover, the average proportion of equity, and dummy variables if the fund is an institutional fund or a closed fund.
2.2 A set of testable hypothesis
In accordance with the previous literature (see mainly BS and RTZ08), we can briefly formulate several testable hypotheses.
A first set of hypotheses is about the relationship between the screening intensity and SRI financial performance. If we stick to the modern portfolio theory, this relationship should be negative because of the lack of diversification of some SRI funds:
H1. A higher screening intensity reduces SRI financial performance.
According to BS, however, the combination of the modern portfolio theory and the stakeholder theory may lead to a U-shaped relationship between screening intensity and financial performance. The rationale for this hypothesis is that the lack of diversification might be (at least partially) offset by a better stock-picking as the screening becomes really selective. The idea of a non-linear relationship can be also related to Derwall, Koedijk and Ter Horst (2011) which confront what they called the “shunned-stock hypothesis” and the “errors-in-expectations hypothesis”. The former hypothesis predicts that a value-driven strategy may hurts financial performance while, at the same time, the latter predicts that SRI can deliver superior performance as the market is prone to undervalue the impact of the corporate social responsibility on future cash flows.
H2. The relationship between the intensity of social screening and financial performance for SRI funds is curvilinear (U-shaped).
In the previous literature, they do not distinguish screens that avoid entire sectors (i.e. sin screens and environmental screens) and those which are transversal and are applied to all firms (for instance, compliance with fundamental international conventions, such as the Universal Declaration on Human Rights). Yet, it is very likely that portfolio diversification is more impacted by sectoral screens than by transversal screens. Thus, compare to the previous studies, we add the following hypothesis:
H3. Only sectoral screens hurt financial performance, while transversal screens do not have any impact.
The second set of hypotheses is related to the types of screens employed by SRI funds. SRI funds may focus on environmental, social or corporate governance issues, the so-called ESG factors. The relative impact of these topics (one relative to another) on financial performance is mostly an empirical issue.
H4. SRI funds that select firms for their portfolios based on labor relations (H4a), or community relations (H4b), or environmental (H4c) screening criteria earn higher risk-adjusted returns than those that do not.
We may also wonder whether the quality of the screening process matters. There are several ways to measure the quality of the screening process. RTZ08 and RTZ11 consider whether the fund bases its screening activities on an in-house SRI research team to proxy for the quality. In this paper, we take advantage of the SRI ratings, provided by Novethic, which synthesize several indicators of the quality of the screening process (see next section and appendix). We expect that higher quality should lead to better financial performances:
H5. The relationship between the quality of the screening procedure and financial performance for SRI funds is positive.
Whether a fund engages in shareholder activism can be also a determinant of the financial performance (RTZ08). It is a sign of the fund managers’ engagement with the companies in which they invest.
H6. SRI funds engaged in shareholder activism earn higher risk-adjusted returns than those that do not.
In the following part of the paper, we will consider this framework to assess the determinant of SRI risk-adjusted returns and to compare our results with previous ones.
3.
T
HESRI
M
ARKET INF
RANCEInformation about the French SRI market was provided by Novethic (a subsidiary of the Caisse des
Dépôts et Consignations), which is the leading French information center dedicated to SRI. Novethic
also provided all the data concerning the SRI funds used in this study.
3.1 General market overview
The SRI market in France represented more than €20 billion at the end of 2007. Moreover, growth has been tremendous. Indeed, the total amount of assets under management increased ten-fold between 2001 and end-2007 (forty-fold from 1998 onwards). There were 175 SRI mutual funds in 2007, compared to 80 in 2002. In terms of assets managed, the French SRI market is the third largest in Europe (tied with Belgium), after the Netherlands and the United Kingdom. Most of the French SRI funds follow a best-in-class approach, almost all of them use information from SRI rating agencies
(mainly Vigéo and Innovest), while one third do not employ any special analyst to examine firms’ extra-financial performances.
Out of the 175 French SRI mutual funds, 97 invest in stocks (the others are bond funds or funds of funds). Moreover, they invest mainly in the euro area or in Europe, but one third of the total outstanding assets are invested worldwide. About half of the SRI funds manage less than €50 million in assets, while one third of them manage more than €100 million.
3.2
The performance of the French SRI mutual funds
The initial sample includes 175 French SRI mutual funds, most of them having been created in the middle of the 2000s. Thus, we consider 116 funds with complete data, over the period 2004-2007.7 We exclude guaranteed funds, funds of funds and community funds. Like Barnett and Salomon (2006), we do not collect data on conventional (non-SRI) mutual funds, since in this study we are interested in financial performance among SRI funds only.
Monthly logarithmic returns are computed using funds’ net asset values, adjusted for distributions. All fund returns are net of expenses. This panel contains 5,568 observations (116 funds × 4 years × 12 months).8 As far as we know, no domestic SRI fund ceased operations during the sample period, so we do not have to correct for survivor bias in the data.
The characteristics of the 116 funds included in our analysis (as of December 31, 2007) are presented in Table 1, Panel A. In our sample, fund age varies between 3 years (by construction) and 25 years, with a mean equal to 8 years, while assets range from €0.32 million to €1,446.21 million.9Most of the French SRI funds in our sample are classified as equity funds (59%) and the others split equally between bond funds (21%) and balanced funds (20%). About a fourth diversify their assets outside Europe. Finally, the management fees range from 0.10% to 2.25% of the outstanding assets.
Panel B of Table 1 reports summary statistics for several equally-weighted portfolios of the SRI funds. We consider four different portfolios composed of four different categories of SRI funds: Equity funds that invest mainly in Europe, Equity funds that invest worldwide, Bond funds, and Balanced funds. For each category, we also document the Sharpe Ratio (which measures the portfolio's excess return per unit of its risk) and the Jensen’s alpha estimated with the CAPM model (which captures the portfolio’s excess return over what is expected, based upon its systematic risk). According to the CAPM model:
Rt – Rf,t = α + β (Rm,t – Rf,t)+ εt (1) where Rt is the return on the equally weighted portfolio of funds in month t, Rf,t is the risk-free interest rate, Rt,m is the market return, α is Jensen's alpha, β is the factor loading on the market portfolio, and εt stands for the idiosyncratic return.In this paper, the proxy for the risk free interest rate is the 3-month Euribor. The proxy for the market index is the MSCI Euro Index for European equity funds, the MSCI
7
The oldest SRI mutual fund in France (Nouvelle Stratégie 50) was created in 1983.
8
In a previous version of the paper, we considered an additional sample composed of 54 French SRI mutual funds, with complete data over the period 2001-2007. This panel contained 4,536 observations (54 funds × 7 years × 12 months). Interpretations of the finding did not change.
9
With regard to these criteria, our sample is very similar to the sample used in BS of RTZ08: Fund age is 5.7 years on average in BS and 5.9 in RTZ08, while managed assets averaged $93 million (with a minimum of $0.19 million and a maximum of $1,483.92 million) in BS and to €63.9 million in RTZ08.
International Index for International equity funds, the ML Europe Bond Index for bonds funds. All these data come from Datastream.
Overall, as expected, our results show that French SRI funds do not outperform the market.10 For all categories, over the period 2004–2007, Jensen’s alpha is slightly negative, but significant for bond funds only (this last result was expected and has nothing to do with SRI). These findings corroborate the results obtained by Le Sourd (2008) or Renneboog et al. (2008b) for the French market. Our results are also in line with international evidence provided by Bauer et al. (2005, 2006, and 2007) and others; see Table A in the Appendix.
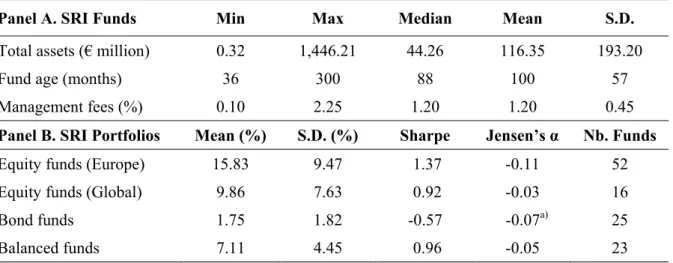
Table 1. Characteristics of the French SRI Mutual Funds Sample
This table documents some characteristics of our sample of French SRI mutual funds. The initial sample includes 175 French SRI funds, but we only consider funds created before 2004, i.e. 116 funds. Panel A reports some descriptive statistic (minimum, maximum, median, mean and standard deviation) concerning managed assets (in million euros), age (months since inception), and management fees per funds (in percentage), as of December 31, 2007. Panel B reports the mean annualized return, its standard deviation, the Sharpe Ratio, the Jensen’s alpha and the number of funds for several equally weighted portfolios of SRI funds, over the period 2004-2007. Monthly logarithmic returns are computed using funds’ net asset values adjusted for distributions. All fund returns are net of expenses and annualized. Data are provided by Novethic. a) indicates significance levels of 5%.
Panel A. SRI Funds Min Max Median Mean S.D.
Total assets (€ million) 0.32 1,446.21 44.26 116.35 193.20
Fund age (months) 36 300 88 100 57
Management fees (%) 0.10 2.25 1.20 1.20 0.45
Panel B. SRI Portfolios Mean (%) S.D. (%) Sharpe Jensen’s α Nb. Funds
Equity funds (Europe) 15.83 9.47 1.37 -0.11 52 Equity funds (Global) 9.86 7.63 0.92 -0.03 16
Bond funds 1.75 1.82 -0.57 -0.07a) 25
Balanced funds 7.11 4.45 0.96 -0.05 23
3.3 Data on the screening process
Unlike most of the previous studies, our database does not contain only financial data. Indeed, we also have valuable information concerning the screening activity of SRI funds. Some statistics are provided on Table 2 related to the quality of the selection process (A), to the nature of the selection process (B), and to the intensity of the screening process (C).
10
This result holds whatever the measure of risk-adjusted performance considered. In addition to the classic CAPM model, we considered multifactor models, regression-based measures as well as conditional measures, but it did not change the conclusion.
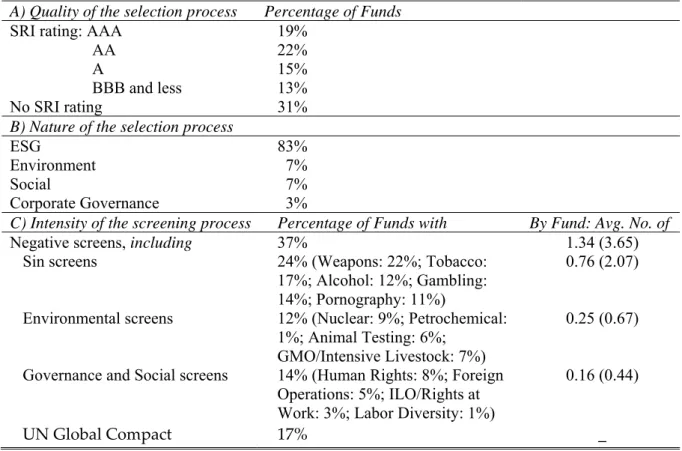
Table 2. The Screening Activity of the French SRI Mutual Funds Sample
This table provides some descriptive statistics about the quality, the nature and the intensity of the screening process of the French SRI funds considered in this study. Information is provided by Novethic. A) The quality of the screening process is proxied by an overall SRI rating: AAA is the highest rating and B the lowest. B) We report the percentage of funds which are identified as attentive to Environmental issues, Social issues, Corporate Governance issues, or all of these issues (ESG). C) Intensity of the screening process: The first column reports the percentage of SRI funds which use a given category of screen. The second column reports the number of screens of a given category used by SRI funds, divided by the total number of funds, i.e. 116 for our sample (in parenthesis: the number of screens of a given category used by SRI funds, divided by the number of funds which apply screens, i.e. 43 in our sample).
A) Quality of the selection process Percentage of Funds
SRI rating: AAA 19% AA 22% A 15% BBB and less 13%
No SRI rating 31%
B) Nature of the selection process
ESG 83%
Environment 7%
Social 7%
Corporate Governance 3%
C) Intensity of the screening process Percentage of Funds with By Fund: Avg. No. of
Negative screens, including 37% 1.34 (3.65)
Sin screens 24% (Weapons: 22%; Tobacco: 17%; Alcohol: 12%; Gambling: 14%; Pornography: 11%)
0.76 (2.07)
Environmental screens 12% (Nuclear: 9%; Petrochemical: 1%; Animal Testing: 6%;
GMO/Intensive Livestock: 7%)
0.25 (0.67)
Governance and Social screens 14% (Human Rights: 8%; Foreign Operations: 5%; ILO/Rights at Work: 3%; Labor Diversity: 1%)
0.16 (0.44)
UN Global Compact 17% _
In 2002, Novethic launched a rating system to assess the social responsibility of SRI equity funds put on the market in France. The rating scale is from AAA (the highest rating) to B (the lowest).11 Three aggregated criteria are considered:
• The selection device: Which source of information is used? How selective is the process? What kind of control is achieved? Is SRI reporting comprehensive? Etc.
• Shareholder activism of the fund on behalf of its investors: Is there a formal proxy for voting policy? What are the mechanisms for promoting dialogue with businesses on CSR and sustainable development issues? Etc.
11
• The global attitude of the asset management firm towards SRI issues: What is the firm’s contribution to the debate on SRI? What is the experience of the firm in the SRI market? Etc. According to Novethic, amongst our sample of 116 SRI funds, 48 (41%) are graded AAA or AA, and these funds are in the vanguard of SRI. 18 funds (15%) make a remarkable effort to meet the expectations of the SRI community and are graded A. 13 funds (11%) yield to SRI community demands, but only partially and are graded BBB. Two funds (2%) are considered as mediocre with respect to all SRI requirements and are graded BB or B. Lastly, 36 funds (31%) have no rating: this is either because the process was still in progress or because the asset management firm refused the rating.
Most of the SRI funds in our sample care about environmental, social and corporate governance (ESG) issues all together. Nonetheless, a few put the emphasis on a specific topic. In our sample, eight funds (7%) focus on the environment, eight more (7%) deal mainly with social concerns, and four more (3%) stress the importance of corporate governance.
While the best-in-class approach is the norm among the French SRI funds, some combine this approach with negative screens. In our sample, hardly more than one third of the funds (43 out of 116) use such screens. The array of screens varies a lot and they are not exclusive. As usual, the most widespread screen concerns “sin stocks”: 22% of the SRI funds in our sample exclude “Weapons”, 17% exclude “Tobacco”, 12% exclude “Alcohol”, 14% exclude “Gambling”, and 11% exclude “Pornography”. Additionally, 12% of the SRI funds use “Environmental screens” (10% exclude “Nuclear”, 1% exclude “Petrochemicals”, 6% exclude firms related to “Animal Testing”, and 7% “GMO or Intensive Livestock”).
Some of the previous screens are more debatable than the others12, but all in all “Sin screens” and “Environmental screens” are very similar: they result in the exclusion of a whole sector, without any differentiation within the sector. Conversely, “Governance and Social screens” are transversal. In our sample, 14% of the SRI funds exclude firms, whatever the sector, either because they do not comply with fundamental international conventions, such as the Universal Declaration on Human Rights (8%), the ILO Declaration on Fundamental Principles and Rights at Work (3%), or because they have business relations with totalitarian and corrupt regimes (Foreign Operations: 5%). “Labor Diversity” also belongs to the category “Governance and Social screens”, but accounts for only 1% in our sample. Finally, 17% of the SRI funds exclude firms which do not conform to the Principles of the UN Global Compact.
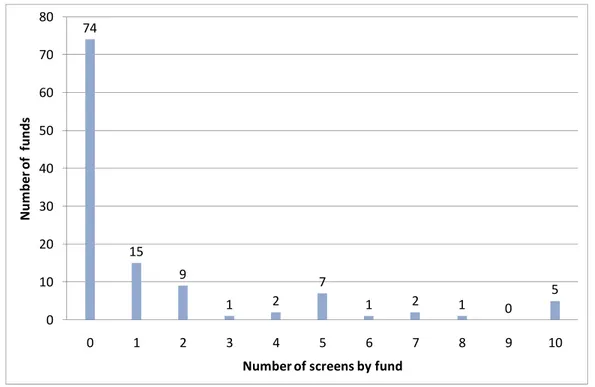
The SRI funds also differ by screening intensity, measured by the number of screening criteria. The number of negative screens varies between 0 and 10. If we consider only the SRI funds which apply at least one screen, the average number of screening criteria is equal to 3.6 and as shown in Figure 1, the distribution of the screening intensity is very skewed.
12
For instance, some SRI funds exclude firms owning nuclear plants, while other SRI funds support them, arguing that they help control climate change (nuclear plants do not emit greenhouse gases in the way that fossil-fuel-fired plants do).
Figure 1. Screening Intensity of the French SRI Funds
About one third of the French SRI funds do not apply any screens. Moreover, the screening intensity varies widely. The initial sample includes 175 French SRI mutual funds. We consider funds created before 2004 only, i.e. 116 funds. Data are provided by Novethic.
3.4 Comparison with previous studies
Clearly, SRI practices on both sides of Atlantic are very different. Negative screens are widespread in the US (and Anglo-Saxon countries), while the best-in-class approach is the norm in Continental Europe, including France. Therefore, our sample differs significantly from previous studies. As BS and LHBA focus on the US, 100% of the SRI funds in their sample use negative screens; this is the same for HL on Australia. RTZ08 cover 17 countries, but half of the SRI funds in their sample come from Anglo-Saxon countries: as a result, the percentage of SRI funds using negative screens in their sample rises to 72% (whereas only 56% of the SRI funds from Continental Europe in their sample use negative screens). It should be recalled that less than half of the SRI funds apply negative screens in our sample. Moreover, for both BS and RTZ08, the average number of screens is almost equal to eight, which is five times higher than in France.
Obviously, this raises questions about the possibility of generalizing previous results. BS and RTZ08 paved the way for studying the impact of the SRI screening process on financial performances. But, a lot of work is needed to accommodate the results to best-in-class SRI funds; all the more if we consider that the best-in-class approach is at the cutting-edge of SRI. The following section aims to fill this gap. 74 15 9 1 2 7 1 2 1 0 5 0 10 20 30 40 50 60 70 80 0 1 2 3 4 5 6 7 8 9 10 Num b er of f unds Number of screens by fund
4.
T
HE DETERMINANTS OFSRI
MUTUAL FUNDS’
FINANCIAL PERFORMANCE4.1 Methodology
The aim of this section is to test econometrically the impact of SRI screening on mutual funds’ financial performance. In order to facilitate comparisons, we follow a methodology very similar to the one considered by BS and RTZ08.
Our dependent variable is the risk-adjusted performance of a given SRI fund, over the whole period.13 The risk-adjusted return of a fund is the difference between its risk premium and its expected return, given its beta and the market’s risk premium. Then, the risk-adjusted performance (RAPi) is defined as αi + εi. RAPi is estimated for each individual fund i over the full sample period.
We then examine whether SRI mutual funds’ performance is related to characteristics of the screening process. In particular, we study the relationship between performance and three categories of variable of interest: the quality, the nature, and the intensity of the screening process. Moreover, we consider almost the same set of control variables as BS and RTZ08.
Hence, our model of SRI returns is the following:
RAPi = γ0 + γ1 SRI Ratingi + γ2 ESGi + γ3 Screening Intensityi
+ γ4 Fund Characteristicsi + γ5 Investment Stylei + ui (2)
SRI Ratingi, ESGi, and Screening Intensityi are the variables of interest. SRI Ratingi is a categorical variable ranging from 0 (no rating) to 6 (AAA) – the rating are attributed by Novethic.14 This variable serves as a proxy for the overall quality of the SRI screening process. ESGi is a set of three dummy variables: Environmenti, Sociali, and Governancei equal to 1 if the fund i focuses on environmental issues, social issues and corporate governance issues respectively, and 0 otherwise: i.e. the reference here is when the fund cares about environmental, social and corporate governance issues all together. The aim is to identify the nature of the screening process. Screening Intensityi is equal to the number of negative screening criteria. We also include the square of the number of negative screening criteria to capture a potential non-linear relationship.
The control variables include Fund Characteristicsi and Investment Stylei. Fund Characteristicsi comprises the following variables: i) Agei is the number of months since the fund's inception, as of end of 2007; ii) Sizei is the fund size (total assets in euros)
15
; iii) Management Feesi is the annual management fee in percentage16. Investment Stylei is a set of three dummy variables: Globali is equal to 1 if the fund i invests outside Europe, and 0 otherwise; Bondi and Balancedi are equal to 1 if the fund i is a bond fund or a balanced fund respectively, and 0 otherwise.
13
In BS, the dependent variable is the RAP of a given SRI fund for a given month. Thus, BS apply a panel data specification with a fixed year effect and a random fund effect. But, since the variables of interest vary very little, we consider that it is more relevant to use a cross-sectional approach.
14
We have also considered different specifications less parsimonious (like a dummy variable equal to 1 if the rating attributed by Novethic is AAA, AA or A, and 0 otherwise), but it does not change the results.
15
Fund size may erode mutual fund performance as shown by Chen et al. (2004).
16
Actually, we do not expect a significant effect of this variable, albeit Kreander et al. (2005) find that management fee is a significant explanatory variable for the Jensen measure of SRI funds.
4.2 The impact of SRI screens on mutual funds’ performance
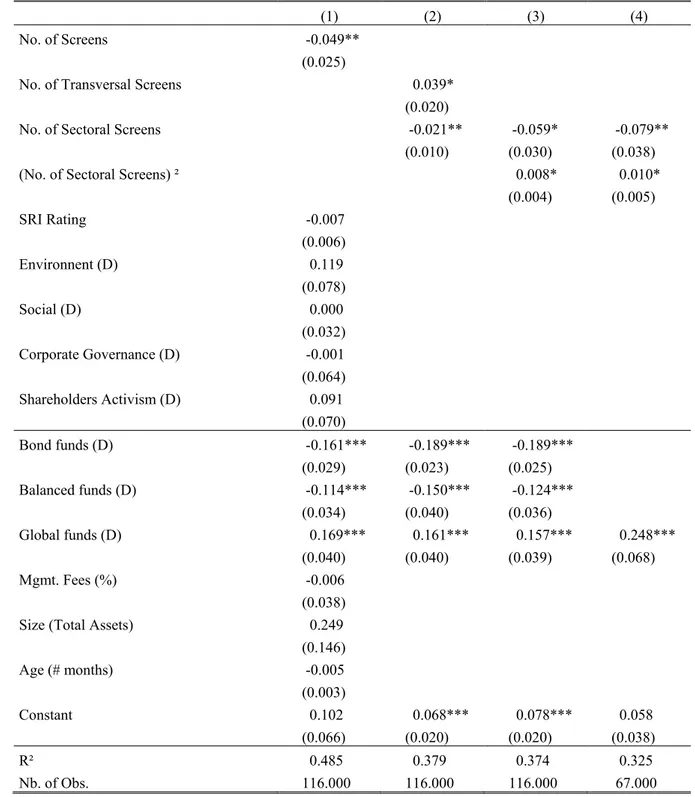
To begin with, we consider the impact of the number and the type of screens on the risk-adjusted performance of our sample of SRI funds. Regression results are summarized in Table 3. In Model 1, we test for a negative relationship between screening intensity and financial performance, the orientation of the fund and the overall quality of the SRI selection process.
• First, according to the (lack of) diversification hypothesis, the coefficient associated with the number of screens is negative and significant at the 5% level (this result holds for all specifications tested). That is, there is a financial cost of imposing screens.
• Second, there is no a priori fundamental reason to find different financial performances between environment-oriented, social-oriented or corporate governance-oriented SRI funds. To put it differently, one can find several theoretical arguments to support each of the so-called ESG factors. Besides, empirically, neither BS nor RTZ08 find clear results in this respect. Likewise, in our regressions, none of the proxies for the ESG factors is significant. Also, shareholder activism does not impact on SRI financial performance.
• Third, we consider the quality of the rating process and its potential impact on SRI funds’ risk-adjusted returns. Whatever the specifications (we tested several), the SRI rating is not correlated with the financial performance of SRI funds.
In Model 2, we examine which type of screens may be relevant. More precisely, we separate the screens that avoid entire sector (mostly the sin screens and the environmental screens) and those that apply to all firms.17 The latter are qualified as transversal screens and are likely to impose less diversification costs. The results corroborate our intuition. Indeed, while the coefficient associated with transversal screens is not significant, the one associated with sectoral screens is negative and significant at the 5% level.
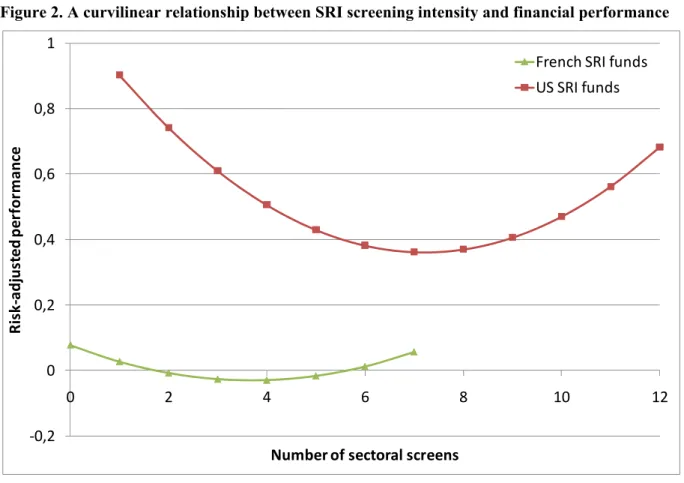
In Model 3, we posit risk-adjusted performance to be a non-linear function of the number of sectoral screens. Given that the bulk of French SRI funds do not use any screens, the number of screens and the square of the number of screens are highly correlated but, like BS, we show a rebound in financial performance, as the number of screens rises: the coefficient associated with the number of sectoral screens is negative and significant at the 5% level, while the square of the number of screens is positive and significant at the 10% level.18 Figure 2 compare our results on the French SRI market with BS on the US SRI market.
In Model 4, we consider only equity funds: the number of observations decrease, but the results seems robust. We still obtain a U-shaped relationship between SRI financial performance and the number of screens.
17
We have also tested to break down the number of screens by distinguishing screens related to sin stocks, environmental concerns and corporate governance issues. None of these variables was significant.
18
To capture a potential non-linearity, we have previously added, in addition to the number of screens, a dummy variable equal to 1 if the funds impose at least one screen and 0 otherwise. In this case, the coefficient associated with the dummy is negative and significant at the 5% level, while the impact of the number of screens is no more significant.
Table 3: The Impact of the SRI Selection Process on Financial Performance
The dependent variable is the risk-adjusted performance (RAP) associated to SRI funds. The sample includes 116 French SRI mutual funds created before 2004 (except model (4) with only 67 equity funds). Data are provided by Novethic. (D) denotes dummy variables. Robust standard errors are given in parenthesis.
(1) (2) (3) (4) No. of Screens -0.049**
(0.025) No. of Transversal Screens 0.039* (0.020) No. of Sectoral Screens -0.021** -0.059* -0.079**
(0.010) (0.030) (0.038) (No. of Sectoral Screens) ² 0.008* 0.010* (0.004) (0.005) SRI Rating -0.007 (0.006) Environnent (D) 0.119 (0.078) Social (D) 0.000 (0.032) Corporate Governance (D) -0.001 (0.064) Shareholders Activism (D) 0.091 (0.070) Bond funds (D) -0.161*** -0.189*** -0.189*** (0.029) (0.023) (0.025) Balanced funds (D) -0.114*** -0.150*** -0.124*** (0.034) (0.040) (0.036) Global funds (D) 0.169*** 0.161*** 0.157*** 0.248*** (0.040) (0.040) (0.039) (0.068) Mgmt. Fees (%) -0.006 (0.038) Size (Total Assets) 0.249 (0.146) Age (# months) -0.005 (0.003) Constant 0.102 0.068*** 0.078*** 0.058 (0.066) (0.020) (0.020) (0.038) R² 0.485 0.379 0.374 0.325 Nb. of Obs. 116.000 116.000 116.000 67.000 * p < 0.10, ** p < 0.05, *** p < 0.01
Figure 2. A curvilinear relationship between SRI screening intensity and financial performance
Sources: French SRI funds: authors’ computation; US SRI funds: Barnett and Salomon (2006).
4.3 Discussion and summary
In this subsection, we aim at summarizing and providing an overall view of the results related to the determinants of SRI financial performance. If we combine our results with previous findings, we obtain a set of six key results related to our set of hypotheses (see Table 4).
• Five out of six studies find that higher screening intensity reduces SRI financial performance, though this result appears less clearly in RTZ08. Interestingly, the relationship between the number of screens and the risk-adjusted performance is positive for HL, but the sample is small and the evidence is weak.
• The negative relationship between the screening intensity and financial performance decreases as the number of screens increases. Like BS we find a U-shaped relationship (the others do no test the curvilinear hypothesis). Notwithstanding the functional form, the overall effect is negative or to put it differently, the initial negative effect is not offset.
• Only sectoral screens (such as avoiding sin stocks or the nuclear industry, for instance) hurt financial performance, while transversal screens (commitment to UN Global Compact Principles, ILO/Rights at Work, etc.) do not have any impact. Our study is the only one to test this hypothesis, and our results are robust for various specifications. This result is fully ‐0,2 0 0,2 0,4 0,6 0,8 1 0 2 4 6 8 10 12 Ri sk ‐ad ju st e d pe rf o rm a n ce Number of sectoral screens French SRI funds US SRI funds
consistent with modern portfolio theory, since transversal screens may not have a decisive impact on diversification, unlike sectoral screens. This result is also consistent with empirical evidence concerning the risk-adjusted performance of “sin stock” portfolios which outperform the conventional benchmarks (Hong and Kacperczyk, 2009; Statman and Glushkov, 2009). • It is not clear whether one of the ESG factors influence more than the other the financial
performance of the SRI funds. Besides, the theoretical literature on this point is not really conclusive.
• The impact of shareholder activism is non-significant, except weak evidence of a positive impact for the US (RTZ11).
• In-house SRI research seems to enhance SRI financial performance (RTZ08), but the quality of the SRI selection process does not; at first, these results seem contradictory, and in any case, this last issue deserves more research.
Table 4. The Relationship between Social Responsibility and SRI Funds Financial Performance Barnett & Salomon (2006) Renneboog et al. (2008b) Lee et al. (2010) Renneboog et al. (2011) Humphrey & Lee (2011) Capelle-Blancard & Monjon (2011)
Country US 17 countries US 17 countries Australia France
Period 1972-02 1991-03 1989-06 1992-03 1996-08 2004-07
No. of SRI Funds 61 440 61 321 24 116
H1: A higher screening intensity reduces SRI financial performance a) Yes Yes Yes Yes No Yes
H2: The relationship between the screening intensity and SRI financial
performance is curvilinear (U-shaped). Yes Yes
H3: Only sectoral screens hurt financial performance, while transversal screens
do not have any impact. Yes Yes
H4a: SRI funds that select firms based on labor relations screening criteria earn
higher risk-adjusted returns than those that do not. No No
H4b: SRI funds that select firms based on community relations screening criteria
earn higher risk-adjusted returns than those that do not. Yes Yes No
H4c: SRI funds that select firms based on environmental screening criteria earn
higher risk-adjusted returns than those that do not. No No
H5: The high quality of the SRI selection process (in-house SRI research or good
SRI ratings) enhances SRI financial performance Yes (in Europe) Yes No
H6: SRI funds engaged in shareholder activism earn higher risk-adjusted returns
than those that do not. No No
Yes
(in the US) No
Note: To save space, this table does not include Scholtens (2007, NL, 7 funds) or Jégourel & Maveyraud (2008, Europe, 71 funds); these papers do not find evidence of a negative relationship between screening intensity and SRI financial performance.
5.
C
ONCLUSIONThe concept of diversification is a key ingredient in portfolio selection, and according to the modern portfolio theory all rational investors should hold a market portfolio: i.e. a value-weighted portfolio of all securities. Nevertheless, diversification has its own limitations. Some investors have not given up the wish of having portfolios that reflect their own personalities. Of course, there are still and will always be investors who are not satisfied with passive management, and who try to beat the market. But, what is new today is that a significant share of investors wants portfolios consistent with their beliefs. They refuse to invest in certain sectors – the famous “sin stocks” – and give priority to environment- or social-friendly companies. In other words, they want to “put their money where their
mouth is”.
We show in this paper that these investors should be prepared to bear a cost for such strategies. Most of the papers on SRI do not find significant differences in risk-adjusted returns between SRI funds and conventional funds. Using a different approach, by looking into the determinants of the financial performance among the SRI funds, we find evidence that a higher screening intensity reduces the risk-adjusted return. However, this result holds only for sector-specific screening criteria; transversal screening criteria do not necessarily lead to poor diversification, and so, do not hurt financial performances.
In a way, these results favor the best-in-class approach. Still, this approach suffers from other drawbacks. For instance, in some cases, SRI funds which follow the best-in-class approach are barely distinguishable from traditional funds. Moreover, the multiplication of criteria can be detrimental to the consistency of the strategy. All in all, even if they lead to poorer financial performance, exclusion funds have the merit of simplicity and reflect well investors’ values.
R
EFERENCESAmbec, S., and P. Lanoie, 2007, When and why does it pay to be green?, Cahiers de recherche 07-04, HEC Montréal, Institut d'économie appliqué.
Asmundson, P., and S.R. Foerster, 2001, Socially responsible investing: Better for your soul or your bottom line? Canadian Investment Review, 14(4), 26-34.
Barnett, M., and M. Salomon, 2006, The curvilinear relationship between social responsibility and financial performance, Strategic Management Journal, 27 (11), 1101-1122.
Bauer, R., K. Koedijk and R. Otten, International evidence on ethical mutual fund performance and investment style, Journal of Banking and Finance, 29, 1751-1767.
Bauer, R., R. Otten and A. Tourani Rad, Ethical investing in Australia: Is there a financial penalty?,
Pacific-Basin Finance Journal, 14(1), 33-48.
Bauer, R., J. Derwall and R. Otten, The ethical mutual funds performance debate: New evidence for Canada, Journal of Business Ethics, 70(2) (2007), 111-124.
Bello, Z.Y., 2005, Socially responsible investing and portfolio diversification, The Journal of
Financial Research, 28(1), 41-57.
Benjaminsson, N., and O. Westerdahl, 2002, Is there a cost to being ethical? A study on the performance of Swedish ethical mutual funds, Working Paper.
Blanchett D.M., 2010, Exploring the cost of investing in socially responsible mutual funds: An empirical study, The Journal of Investing, 19(3), 93-103
Bollen, N.P.B., 2007, Mutual fund attributes and investor behavior, Journal of Financial and
Quantitative Analysis, 42(03), 683-708.
Burlacu, R., I. Girerd Potin and D. Dupré, 2004, Y a-t-il un sacrifice à être éthique ? Une étude de performance des fonds socialement responsables américains, Banque et Marchés, 69, 5-13. Capelle-Blancard, G., and S. Monjon, 2010, Socially responsible investing: It takes more than words,
Working paper.
Chen, J., H. Hong, M. Huang et J. Kubik, 2004, Does fund size erode mutual fund performance? The role of liquidity and organization, American Economic Review, 94, 1276-1302.
Chevalier, J., and G. Ellison, 1999, Are some mutual fund managers better than others? Cross-sectional patterns in behavior and performance, The Journal of Finance, 54(3), 875-899.
Chong, J., M. Her and G.M. Philips, 2006, To sin or not to sin? Now that’s the question, Journal of
Asset Management, 6(6), 406-417.
Collison, D.J., G. Cobb, D.M. Power, and L.A. Stevenson, 2007, The financial performance of the FTSE4Good indices, Corporate Social Responsibility and Environmental Management, 15(1), 14-28.
Cortez, M.C., F. Silva and N. Areal, 2009, The performance of European socially responsible funds,
Journal of Business Ethics, 87, 573-588.
Cummings, L., 2000, The financial performance of ethical investment trusts: An Australian perspective, Journal of Business Ethics, 25(1), 79-92.
Derwall, J., and K. Koedijk, 2008, Socially responsible fixed-income funds, Working Paper.
Diltz, J.D., 1995, Does social screening affect portfolio performance? Journal of Investing, 4, 64-69. Fernandez-Izquierdo, A., and J. Carlos Matallin-Saez, 2008, Performance of ethical mutual funds in
Spain: Sacrifice or premium?, Journal of Business Ethics, 81(2), 247-260.
Geczy, C., R. Stambaugh and D. Levin, 2006, Investing in socially responsible mutual funds, Working
Paper, Wharton School.
Ghoul, W., and P. Karam, 2007, MRI and SRI mutual funds: A comparison of christian, islamic (Morally Responsible Investing), and socially responsible investing (SRI) mutual funds, The