This project is funded by the European Union under the 7th Research Framework Programme (theme SSH) Grant agreement nr 290752. The views expressed in this press release do not necessarily reflect the views of the European Commission.
Working Paper n° 44
Minimum Wage and Income Distribution in Brazil from the
2000s
UFRJ
João Saboia and João Hallak Neto
1
Minimum Wage and Income Distribution in Brazil from the 2000s
João Saboia and João Hallak Neto1
Abstract
For several years Brazilian minimum wage (MW) has been going through an intense process of growth. Different authors have argued that an important part of the improvement in income distribution can be attributed to increased MW in recent past. Using income elasticities with respect to MW, this paper seeks to estimate the effects of current MW adjustment policy on improving income distribution. The results of simulations show that the MW contributed greatly in recent years through the labor market as well as through pensions and other official income transfers.
Keywords: Minimum wage; Brazilian income distribution; functional income distribution.
Classification JEL: J30; J38; H53; E24; E27.
1
João Saboia is professor emeritus of economics at the Institute of Economics of the Federal University of Rio de Janeiro. João Hallak Neto is analyst at the IBGE Directorate of Research. The authors thank Jordão Fernandes Andrade for organizing the empirical material and support in the processing of simulations of the distribution of per capita family income. This work is part of Nopoor research funded by the European Union.
2
1. Introduction
In the last decades Brazilian minimum wage (MW) has been going through an intense process of growth. Although no well-defined rules for adjustments existed until recently the political situation favored the granting of real increases to the MW. Only in 2011 a law was passed (Law 12,382) setting the rules for the annual adjustments of MW, keeping somehow mechanisms that were already being used in practice. Such legislation has defined the format of adjustments for the period 2012/2015 and has been renovated for the new period 2016/2019 by Law 13,152 in 2015. In other words, MW has been receiving every year the correction of inflation by the consumer price index (INPC), plus real increase according to gross domestic product growth (GDP) recorded two years earlier and should remain so until 2019.2
The role of MW on improving the distribution of income is controversial. Some authors argue that it is important, while others minimize their redistributive capacity. Usually those that minimize the role of MW defend the targeted distribution of income programs, whose effect on poverty reduction is unquestionable. In general, such criticisms are related to the fact that people who receive one MW in the labor market, or through pensions, are located in the intermediate ranges of income, apart from the fact that the minimum wage increase has an unfavorable effect on the public accounts.3
Making use of simulation results based on recent past experience this article argues that MW has contributed to the improvement of income distribution. It recognizes, however, that there are limits on its redistributive potential. For this, simulations are developed considering the various forms of integration of workers into the labor market and the social transfers associated to MW.
The years analyzed go from 2004 to 2013 when MW showed strong growth in real terms. Elasticities are estimated for various types of labor income in relation to MW. These elasticities are applied to the income structure observed in 2004 simulating what would happen to income distribution assuming the real growth of MW in the period. Then it compares the simulation results with the income distribution actually observed in 2013.4
In view of Brazilian labor market behavior in recent years, when there was heavy MW growth, intense generation and formalization of employment and reduction in unemployment rates, it was chosen not to use any hypothesis in the simulations
2
Minimum wage was created in Brazil in 1940. It is fixed at the national level, although some states like Rio de Janeiro and São Paulo have their own minimum wage, usually a little bit over the national level. It is the monthly payment due to workers for a weekly journey of 44 hours. It was fixed at R$ 880 in January of 2016 (about US$ 320 ppp in 2015).
3
The different visions on the subject in Brazil are presented in various papers listed in the bibliography. Among the most recent articles that discuss the effect of increasing MW in the reduction of income inequalities it can be mentioned Afonso et al (2011), Brito (2015), Ferreira et al (2014), Komatsu (2013), Neder and Ribeiro (2010), Saboia (2015) and Soares (2010).
4
The data source utilized here for income distribution is the National Household Survey - Pesquisa Nacional por Amostra de Domicílios (PNAD). When preparing this text the PNAD data for 2014 had not yet been disclosed. In addition, economic growth was virtually nil (0.1%) and the MW grew little in 2014 (only 0.7%). So it was decided to use 2013 as the final year of study. As for the beginning of the period in 2004 was a natural choice, as it was when the economy began to show higher growth rates and when the minimum wage increase accelerated.
3
relating MW growth to changes in the occupational structure of the labor market. The basic effect of MW growth on income levels uses only the elasticities estimated for different types of workers. In other words, it is considered fixed the occupational distribution found in 2004 and it is simulated the changes in the income levels due to MW growth.
The simulation study is completed with the estimation of the effect of MW growth on the floor of official pension system (INSS) and on Continuous Cash Benefit (BPC), whose values are equal to one MW.
In addition to the discussion of the distribution of income under the personal/family focus, the article also analyzes the effect of increasing MW on the functional income distribution, which has favored labor income since 2004. In this part of the study, it is used the aggregate elasticity of labor income relative to MW, plus the growth of the employed population, the mass of compensation and the average income in the period.
The main contribution of this paper is the development of simple techniques for calculating the effects of MW's policy on income distribution in recent years when this favorable policy was applied by the government. It also provides subsidies for the estimation of its possible effects in the future, at least until 2019, to the extent that the MW law has been extended to that year.
The next section presents the results of estimates for the elasticities of various types of labor income relative to MW. Next, it is developed the methodology for the calculation of the simulations of the effect of MW growth on the distribution of personal/family income. The fourth section illustrates the simulation results in terms of reducing income inequality. In the fifth section, a new simulation is developed for the functional income distribution (FID). Finally, the main conclusions are presented. As mentioned before, the basic data source for the article is the National Household Survey (PNAD). For the analysis of FID it is used also the System of National Accounts (SNA).
2. The elasticity of labor income relative to minimum wage
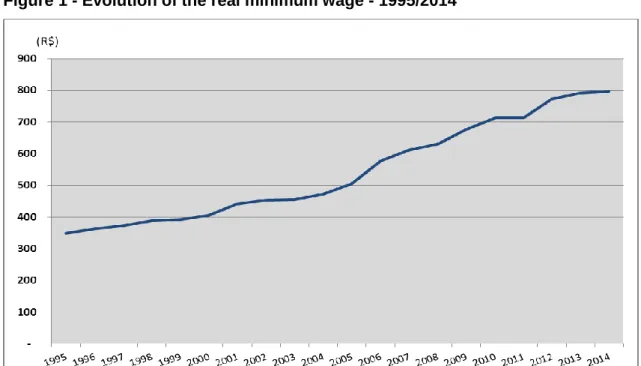
Figure 1 shows the evolution of MW since 1995. It shows a strong growth in the period, especially from the middle of the last decade, a period that will be the object of our study. MW grew 128.8% in real terms between 1995 and 2014, being 35.7% between 1995 and 2004 and 68.6% between 2004 and 2014.
4
Figure 1 - Evolution of the real minimum wage - 1995/2014
Obs: Average values of the year, deflated by INPC / IBGE. Constant values of July 2015.
Source: Ipeadata / IPEA
Saboia (2010) presented estimates for the elasticities of labor income relative to MW for the period 1995 to 2006 using PNAD data. Three features can be highlighted in the results obtained.
First, the elasticities vary greatly depending on the worker’s position in the labor market (employees, with or without a formal contract, self-employed etc.). Second, they change inside each position in the occupation, according to the worker's income level. Third, the elasticities also change over time according to economic conditions in the period.
For greater precision in the simulations, in the next section average elasticities are estimated for the period 2004/2013 in six worker’s positions provided by PNAD - employees with and without a formal contract; domestic workers with and without a formal contract; self-employed; and military and public servants. In some cases, such as workers with a formal contract, the relationship with MW is obvious. In others, like those in the informal sector, the relationship is indirect, via the "lighthouse" represented by MW in terms of remuneration. For civil servants it is a different situation, in that their salaries are set according to local government policies, but to the extent that MW is the legal minimum, there is a direct influence, at least for the lowest wages of public administration. In the case of employers income we decided not to use the elasticities since an increase on MW could represent higher costs. On the other hand, it can also represent more sales and revenue due to possibility of increasing demand. Thus, we opted for a neutral effect, keeping constant the real income of employers when MW increases.
5
The raw data of the calculated elasticities were adjusted by three-points moving average procedure to smooth the gaps between adjacent values. Figures 2 to 7 illustrate the results for the twentieths of the income distribution for the six type of occupations.5
As expected, the elasticities for employees with formal contract are close to unity only in the first three twentieths where wages equal one MW. From thereon they tend to decrease falling to about 0.2 for the highest wage levels. The average value for their elasticity was only 0.38, the lowest among the six groups analyzed. In terms of income, however, it represents the second highest average level. Therefore, MW acts with a strong de-concentrating effect of income among employees in the formal sector of the economy.
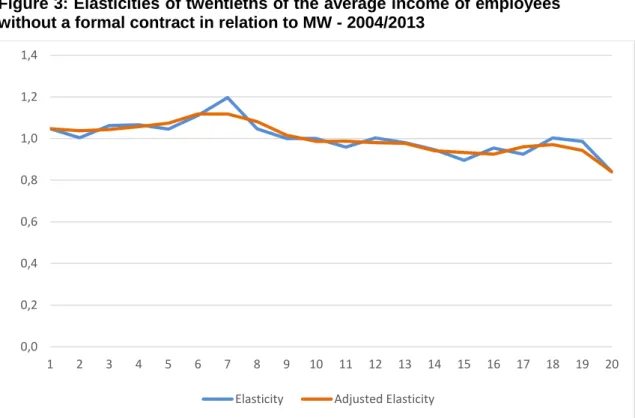
The results for the unregistered workers are very interesting, with elasticities close to unity, and small decrease for higher levels. The average elasticity reaches 0.95. This confirms the "lighthouse" effect of MW in the informal sector and may also be explained by the low wage levels of employees without a formal contract. This is one of the lowest groups in terms of average income, surpassing only domestic workers with or without formal contract. Such high elasticity level certainly contributed to the reduction of income inequalities.
Figure 2: Elasticities of twentieths of the average income of employees with a formal contract in relation to MW - 2004/2013
Source: Authors' processing from Pnad and Ipeadata / IPEA.
5
The method used for the estimation of average elasticities in the period 2004/2013 is quite simple. They were estimated for each twentieth of the income distribution as the ratio of the percentage change in the average income and the percentage change in MW in the whole period. In the adjustment by moving averages the values for the first and the last twentieths were kept unchanged. The values have been deflated by INPC for the calculation of elasticities. 0,0 0,2 0,4 0,6 0,8 1,0 1,2 1 2 3 4 5 6 7 8 9 10 11 12 13 14 15 16 17 18 19 20
6
Figure 3: Elasticities of twentieths of the average income of employees without a formal contract in relation to MW - 2004/2013
Source: Authors' processing from Pnad and Ipeadata / IPEA.
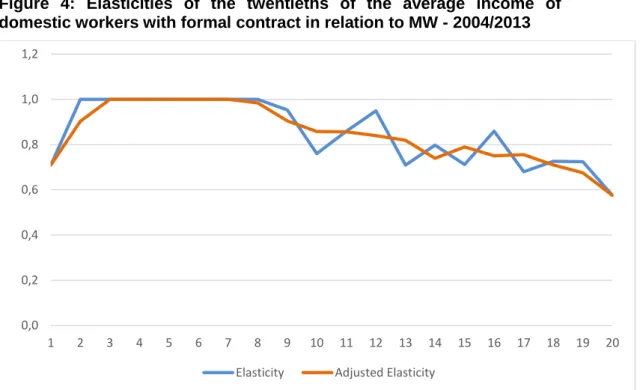
In the case of domestic workers with a formal contract, the general rule is to obtain unitary elasticity in the first half of the distribution, corresponding to workers who receive exactly one MW or close values. In the second half elasticities fall slightly dropping to about 0.6 for the higher salary levels. The average elasticity is 0,81.
For domestic unregistered workers the opposite occurs. Their elasticities start at little more than 0.8 for lower wages (below MW) and reach unitary values for higher levels of remuneration, near or even slightly above the MW. These are the workers with the lowest incomes. Their average elasticity is high reaching 0.95, collaborating to the improvement of the distribution of income in the period.
0,0 0,2 0,4 0,6 0,8 1,0 1,2 1,4 1 2 3 4 5 6 7 8 9 10 11 12 13 14 15 16 17 18 19 20
7
Figure 4: Elasticities of the twentieths of the average income of domestic workers with formal contract in relation to MW - 2004/2013
Source: Authors' processing from Pnad and Ipeadata / IPEA.
Figure 5: Elasticities of the twentieths of the average income of domestic workers without formal contract in relation to MW - 2004/2013
Source: Authors' processing from Pnad and Ipeadata / IPEA.
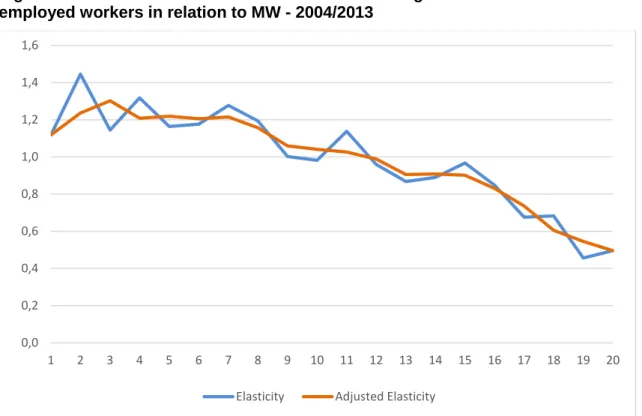
The self-employed workers show a downward curve for the elasticities, down from about 1.2 for the lower levels of income to 0.5 for higher levels, having therefore a
0,0 0,2 0,4 0,6 0,8 1,0 1,2 1 2 3 4 5 6 7 8 9 10 11 12 13 14 15 16 17 18 19 20
Elasticity Adjusted Elasticity
0,0 0,2 0,4 0,6 0,8 1,0 1,2 1 2 3 4 5 6 7 8 9 10 11 12 13 14 15 16 17 18 19 20
8
typically redistributive format. Such workers have the second highest level for the average income. Their average elasticity was estimated at 0.72.
Figure 6: Elasticities of the twentieths of the average income of self-employed workers in relation to MW - 2004/2013
Source: Authors' processing from Pnad and Ipeadata / IPEA.
For military and public servants and the elasticities are systematically below the unit, around 0.8, except for the lowest wage levels, which correspond to the remuneration of one MW, where it reaches the unit value. The average elasticity is 0.76. These workers represent the group with the highest average income.
0,0 0,2 0,4 0,6 0,8 1,0 1,2 1,4 1,6 1 2 3 4 5 6 7 8 9 10 11 12 13 14 15 16 17 18 19 20
9
Figure 7: Elasticities of the twentieth of the average income of military and civil servants in relation to MW - 2004/2013
Source: Authors' processing from Pnad and Ipeadata / IPEA.
In summary, the above results confirm the wide range of elasticities behavior and the tendency to obtain higher values for the lowest incomes and in the range where workers receive exactly one MW. These results indicate a favorable potential for MW growth in terms of improving the distribution of income through the labor market. The elasticities calculated for the twentieths of the six types of worker’s occupations presented above will be used in the simulations developed further.
3. The methodology used for the simulations of the distribution of per capita family income6
The simulations to estimate the effect of increasing MW on the income distribution are developed in three main steps. The distribution used is the per capita family income, which reasonably reflects the welfare level of the household. The starting point is the per capita family income distribution in 2004.
Various MW growth rates are used. In the case of labor income it is used the values of the adjusted twentieth elasticities for each type of occupation in order to find what would be the change in the per capita family income distribution for a certain increase in MW. It is included the labor income of all family members.
In the case of income from official pensions, whose floor is the minimum wage itself, the simulation is quite simple. It just moves all people who receive pensions between the old and the new MW to the value of the new MW. For example, if the real increase
6
Similar methodology was used in Saboia (2015).
0,0 0,2 0,4 0,6 0,8 1,0 1,2 1 2 3 4 5 6 7 8 9 10 11 12 13 14 15 16 17 18 19 20
10
in MW is 10%, all pensioners receiving between the floor and 10% above it are moved to the new value of MW. The others remain with their values unchanged.7
A third group of people has also its income adjusted when the MW increases. It is those who receive the Continuous Cash Benefit (BPC), whose value is equal to one MW. The location of such income in PNAD is not simple, because it is included in "other income". The hypothesis used in this case is that all people who receive exactly one SM in this type of income would be receiving the BPC. Therefore, their income are adjusted in the same proportion as the MW in the simulations performed.8
It should be noted that the simulations presented below do not consider any effect of MW increases on incomes such as rents, donations, financial gains etc. As is known, PNAD's ability to capture income other than those from labor and pensions is very limited. It is neither considering any effect of the entry and exit of workers in the labor market, keeping thus the original distribution of workers unchanged.9
Thus, the results of the next section should be viewed as a simulation exercise, representing an approximation of the role of increasing MW on the improvement of income distribution.
4. Simulation results for the distribution of per capita family income
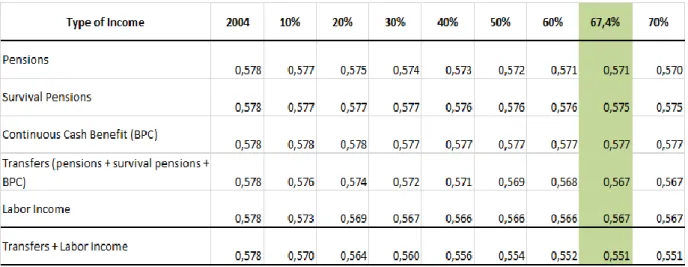
The results of the simulations can be analyzed through the data in Table 1 that shows the value of the Gini index of the distribution of per capita family income in 2004 and its evolution to the extent that MW has real growth from 10% to 70%. It also presents a column for a growth rate of 67.4%, which was the real growth for MW in the period 2004/2013.
It is clear that when MW increases the Gini index tends to fall.10 Note, however, that the intensity of the fall is reduced when considering higher rates of MW growth. While in 2004 the figure was 0.578, the simulations show that with the increase of 67.4% for the MW the index would drop to 0.551. In fact, the Gini index in 2013 was 0.530. Therefore, the increase in MW would have been responsible for 56% of the decline in income inequality measured by the Gini index.
It is worth noting that BPC contributes very little to the fall in inequality, to the extent that its volume of income is relatively small in the total income.11 Pensions and labor
7
In practice this is what has occurred to the extent that the government has adjusted official pensions and survival pensions over the value of one MW according to the INPC, without any real increase in recent years. Since we are working with real variations, zero real growth means keeping "values unchanged”.
8
BPC data in PNAD are not very reliable since they come together with several other types of income including earnings from interest. Hence the lower reliability of the simulation results obtained for BPC. As BPC is intended for the elderly and/or disabled people (young or old), it is difficult to use age filters to identify those that are effectively receiving BPC. The total number of people receiving BPC identified under PNAD’s "other income" is less than the number of benefits actually paid by the government under that heading.
9
The implicit assumption here is that entries and exits can occur but retain the original distribution.
10
Gini index varies from zero to one. The lower is its value the best is the income distribution.
11
Labor income account for about three quarters of the income data obtained by PNAD. Pensions and survival pensions, around 25%, most of which pensions. The participation of the BPC and other type of income is marginal.
11
income have a much higher potential to contribute to reducing inequalities. As a whole, transfers (pensions, survivor pensions and BPC) would be responsible for reducing the Gini index to 0.567, same value found for the reduction obtained with labor income. In other words, transfers and labor income would be responsible each for about half of the observed reduction in the Gini index in the period.
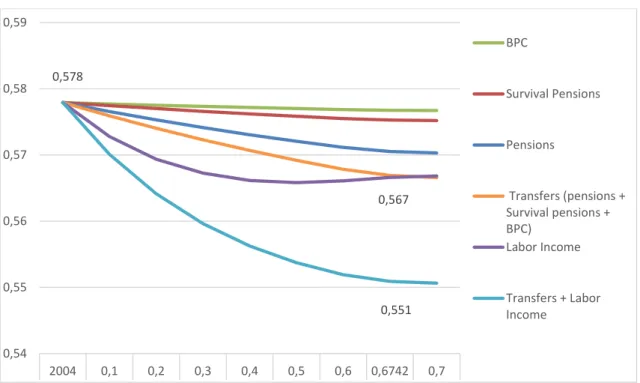
Figure 8 summarizes the results found, showing the reductions in the Gini index according to each type of income and different growth rates for MW. It should be noted that the de-concentrating effect of labor income is too strong for lower MW real growth rates, losing strength for rates above 50%. In contrast, the effect of transfers is lower for MW growth rates relatively small, but continues operating as to match that obtained by the labor income at the end of the reporting period.
Table 1: Gini index of the distribution of per capita family income according to the percentage of MW increase
12
Figure 8 - Evolution of the Gini index of the distribution of per capita family income from 2004 according to the real growth rate of minimum wage
Source: Authors' processing
The results found through the simulations calculated here show the same trend, but also some differences with those obtained by Brito (2015). The author, using another methodology for the period 1995/2013, estimated that MW would have been responsible for 72.4% of the reduction of the Gini coefficient for per capita household income, being more intense the role played by pensions (37.7%), followed by labor market (26.3%) and BPC (8.4%). In other words, the transfers would have had a more important role than wages in reducing inequalities. It is important, however, to point out the differences in methodologies and periods analyzed in the two studies.12
5. Minimum wage and functional income distribution
A complementary way to analyze the distributive phenomenon is through its functional income distribution (FID), as it regards the allocation of the income generated by the factors used in production. The functional term indicates that the income distribution is performed considering the "function" played by agents in the production process. From this primary distribution, it defines the shares of labor and capital income in the income generated. Such relationships have their origin in the System of National Accounts (SNA) and they are obtained through the breakdown of GDP from the perspective of income.
12
In some households there are more than one family, but using per capita household or family income makes little difference in terms of distributional outcomes.
0,567 0,578 0,551 0,54 0,55 0,56 0,57 0,58 0,59 2004 0,1 0,2 0,3 0,4 0,5 0,6 0,6742 0,7 BPC Survival Pensions Pensions Transfers (pensions + Survival pensions + BPC) Labor Income Transfers + Labor Income
13
The components of the GDP income are recorded in the second account of the SNA, the generation of income account. The balance of this account is the value added, which is the difference between the output value and the intermediate consumption needed to carry out such output, becoming thus the amount actually created by productive units during the economic activity in a given period.
Thus, the value added is allocated to the compensation of employees, corresponding to the labor expended by employees; the gross operating surplus to remunerate the assets used by the corporation units; the gross mixed income for the households producers; and the net taxes on production and imports, which the government deducts from production.13
The focus of this section is to estimate the effect of MW growth on the participation of compensation in GDP. The real increase in the MW in the period 2004/2013 positively influenced the change in compensation that grew up in greater proportion than the increase in GDP, resulting in the increase of its weight in the FID.
In quantitative terms, two effects may explain the increase in compensation: i) the increase in the number of employed jobs in the economy; and/or ii) the increase in average compensation of employed people. The growth of MW impacts the average compensation of employed people and the compensation, and consequently its weight in the FID. In addition, we try to measure to what extent the increase in MW influenced the average compensation in the Brazilian economy and the latter, the growth of compensation in GDP.
The income data are available in the time series published by Brazilian Institute of Geography and Statistics (IBGE, in Portuguese) in the new SNA, reference for the Brazilian economy from 2000 to 2013. This new series, based on the latest revision of the International Handbook of National Accounts, the SNA-2008, has 2010 as reference and was released by IBGE in 201514.
Figure 10 shows the evolution of the share of GDP components from the perspective of income in the period available for the current SNA series. Note that in the early 2000s, compensation lose share to the gross operating surplus; reversing this trend since 2004, which happens to be the starting point for the analysis developed. For the other components, net taxes on production and imports and gross mixed income, the first increases its share from 2000 and continues in relative stability; and the second undergoes a continuous drop in participation since the beginning of the series and a stabilization at a lower level in the final years.15
13
The detailed definition of the components of income in the GDP can be found in the international SNA manual, SNA-2008 (UN, 2009, ch. 7), and the methodological note of the SNA of Brazil (IBGE, 2014).
14
The new results of the SNA, published in November 2015, can be accessed in the link (IBGE, 2015): http://www.ibge.gov.br/home/estatistica/economia/contasnacionais/2013/default.shtm.
15
Hallak Neto and Saboia (2014) interpret the movements of functional income distribution components in the period 1995-2009, using the previous series reference of SNA. The analysis is coincident for the 2000-2009 period shown here because there was virtually no change between one series and another with respect to variations of the components. For this reason, the authors restrict their comments about the movements of the variables to the period after 2009.
14
Figure 10: Percentage composition of GDP by income perspective in Brazil - 2000/2013
(%)
Source: SCN/IBGE.
The minimum value of compensation on GDP in the time series occurred in 2004, when it registered 38.3%. Recovery continuously continued until 2010, resisting even the sharp slowdown of GDP in 2009. From 2004, there was an increase in the employment level of the working population, higher formalization at work and substantial improvements in wages and social contributions, which lasted until the last year from the series. Thus, in 2013, the compensation component has reached the maximum percentage in GDP (43.4%), that is, a gain of 5.1 percentage points (pp) in the period.
It should be noted that MW, a key variable for determining much of the wages in the country, received continuous adjustments above inflation in the period 2004/1316. Another sign that reinforces the compensation recovery movement was the systematic attainment by organized labor wage increases above inflation from the second half of the 2000s.17
While the share of wages suffered slight decrease in 2010 to return to the upward trend in the last three years of the series, the gross operating surplus moved downward. In 2010, the year the GDP growth rate reached 7.5%, the highest since 1985, it is understood that all economic agents gained in absolute terms. However, this "gap of GDP" was mainly channeled to the capital, which recovered part of its lost share in previous years.
16
From 2005 to 2013, average real increases in MW, deflated by the INPC, reached significant 5.9% per year, while from 2000 to 2004, these amounted to 3.9% per year.
17
For more details see Hallak Neto (2013).
39,2 38,3 42,4 41,6 43,4 0,0 5,0 10,0 15,0 20,0 25,0 30,0 35,0 40,0 45,0 50,0 Compensation Gross operating surplus Net taxes on products and imports Gross mixed income
15
In the following years, however, with the reduction in GDP growth rate, the compensation regained weight in the FID. Traditional sources of the labor market such as PNAD, RAIS and PME reported very favorable results to workers up to 2013, with respect to the growing occupation and the increase of labor income.18
Therefore, the deceleration of GDP growth in the period 2011-2013 (average 2.9% per year over the three years) combined with the maintenance of the labor market heating and wage gains justified the observed behavior of compensation and gross operating surplus in FID in the last years of the series.
5.1. Estimate the impact of changes in the minimum wage
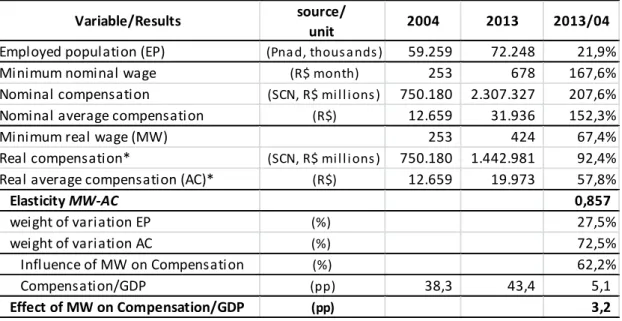
From 2004 to 2013, MW increased 67.4% in real terms (167.6% in nominal terms) bringing impacts to the growth of compensation, which in turn gained significant 5.1 pp weight in FID in the period, as shown in Figure 10. According to PNAD, in the same period, the employed population rose from 59.2 million to 72.2 million, being a second factor to increase the total of compensation. So quantitatively, we can attribute the growth of compensation to these two effects: i) an increase of 21.9% in employed population; and ii) an increase of 57.8% in the average real income of the employed population.19 Given these variations, it is assigned proportionally the weight of 27.5% to the first effect (employed population) and 72.5% to the second effect (average real compensation). These data are organized in Table 2.
For the period under review, the MW/average compensation elasticity was estimated at 0,857. The calculation was obtained by average compensation percentage change divided by MW percentage change, in real terms, from 2004 to 2013. This high correlation was expected because the structure of wages in the Brazilian economy is highly concentrated in jobs that receive up to two MW.20 Thus, the effect of MW on compensation was equivalent to 62.2% (72.5% x 0.857). Since the increase in share of compensation in GDP was 5.1 pp, it can be said that 3.2 percentage points of this increase can be attributed to MW increase in the period, through its influence on the average income of the employed population.
18
Saboia and Kubrusly (2014) presents a multidimensional indicator that confirms the improvement in the labor market up to 2013. To get an idea, the lowest unemployment rate in PME time series occurred just in 2013, averaging 5.4%.
19
The use of average real income is justified to isolate the price effect of this monetary variable in the breakdown of compensation. As the employed population is a variable in real terms, the price effect would be fully associated with the average real income component, subsequently adding its contribution to the behavior of compensation.
20
16
Table 2 - Variables and results of the impact of MW change on the functional income distribution in the period 2004-2013
* Deflated by INPC/IBGE (prices of 2004)
Source: Authors’ processing from Pnad and SCN / IBGE.
This simplified exercise breakdown of the components that determine the compensation in the perspective of MW variation in effect confirms that the MW adjustment policy plays a decisive role in the results of FID. However, it should be noted the importance of other conditions for the determination of FID, since it involves not only the amount of wages and contributions, but also corporate, property owners and financial security holders income; and the amount allocated to taxes on production. Factors such as the productive structure, the degree of formalization of the labor market, inflation rates and the effects of economic policy decisions (monetary, tax, fiscal and exchange rate) also exert influence, more or less directly, on how the income generated will be distributed among economic agents.
Regarding the forecasts, contrary to what tends to occur in the distribution of family income, it is difficult to established a priori a direct relationship between stagnation (or slowdown, or recession) and fall in the share of wages in the FID. If GDP and gross operating surplus are more affected than compensation, the last one may gain weight, as noted in 2009. Although the current MW adjustment policy represents lower gains in the future, if compensation increases more than GDP growth, you can still see the continuation of its weight gain in the FID.
6. Final remarks
Brazilian minimum wage undergone in the last two decades an intense recovery. Benefited initially by a relatively favorable political situation and later by the economic recovery, MW grew 128.8% in real terms between 1995 and 2014.
Variable/Results source/
unit 2004 2013 2013/04
Employed population (EP) (Pna d, thous a nds ) 59.259 72.248 21,9%
Minimum nominal wage (R$ month) 253 678 167,6%
Nominal compensation (SCN, R$ mi l l i ons ) 750.180 2.307.327 207,6%
Nominal average compensation (R$) 12.659 31.936 152,3%
Minimum real wage (MW) 253 424 67,4%
Real compensation* (SCN, R$ mi l l i ons ) 750.180 1.442.981 92,4%
Real average compensation (AC)* (R$) 12.659 19.973 57,8%
Elasticity MW-AC 0,857 weight of variation EP (%) 27,5% weight of variation AC (%) 72,5% Influence of MW on Compensation (%) 62,2% Compensation/GDP (pp) 38,3 43,4 5,1 Effect of MW on Compensation/GDP (pp) 3,2
17
Since 2011 there is a specific law for MW with annual adjustments according to the inflation in previous year plus the GDP growth rate of two years ago. In 2015 these rules have been extended until 2019.
There is unanimous recognition among the experts that MW had an important role in improving income distribution in recent years, both through the labor market and the various mechanisms of income transfers. This, however, has not spared MW criticism from those who point to the current difficulties of public accounts and the role played by MW in the budgetary expenditures.
It was developed in this article two methodologies to estimate the role of the minimum wage in improving income distribution in recent years. Both use the concept of elasticity of labor income relative to MW. The first one focus on the per capita family income while the second deals with the functional income distribution.
In the first case it was shown that MW would explain more than half of the fall on Gini index of the distribution of per capita family income between 2004 and 2013. On the other hand, it shows that both, the labor market and the income transfers, are responsible for improving the income distribution. The results of the simulations indicate that while the Gini index declines as the MW increases, the fall decreases for higher rates of MW growth. It therefore points to MW efficiency loss in the reduction of income inequalities in the future.
The MW's contribution in raising the share of labor compensation in GDP was estimated confirming its favorable role also in the analysis of functional income distribution. Over 60% of the increased share of compensation in GDP in the period analyzed could be linked to the effects of MW on the average income of the employed population.
Due to the maintenance of the current law of MW up to 2019, it would be reasonable to expected the continuation of the redistributive effect of MW in coming years. Occurs, however, that since 2014 the economy stopped growing and that in 2015 there was a sharp fall in GDP that should remain at least until 2016. As the real growth of MW depends on GDP growth of two years ago, it is hardly expected any real increase in MW, at least until 2018.
These results show that, despite the success of MW increase policy in distributional terms in recent years, other means should be encountered for the favorable MW evolution and the improvement of income distribution in the future.
First, it is essential that the current political and economic crisis be overcome and the economy return to growth. On the other hand, we must tackle the low rate of investment in recent years. Third, it is necessary to increase the current levels of labor productivity of the Brazilian economy, admittedly low even compared to less developed countries. Such a combination of results could create conditions for the resumption of MW growth in the future when the current legislation will end.
18
Bibliography
Afonso, L.E., Pereda, P. C., Giambiagi, F. and Franco, S., O Salário Mínimo como Instrumento de Combate à Pobreza Extrema: Estariam Esgotados seus Efeitos?, Economia Aplicada, v. 15. n. 4, 2011.
Baltar, P., Dedecca, C. and Krein, J. orgs., Salário Mínimo e Desenvolvimento, Unicamp, Campinas, 2005.
Barros, R. P., A Efetividade do Salário Mínimo em Comparação com o Bolsa Família como Instrumento de Redução da Pobreza e da Desigualdade, in Barros, R., Foguel, M. and Ulyssea, G., orgs., Desigualdade de Renda no Brasil: Uma Análise da Queda Recente, v. 2, IPEA, Brasília, 2007.
Brito, A. S., O Papel do Salário Mínimo na Redução da Desigualdade na Distribuição de Renda no Brasil entre 1995 e 2013, PhD thesis, Programa de Pós Graduação em Economia, Universidade Federal Fluminense, Niterói, August 2015.
Corseuil, C., Servo, L., Salário Mínimo e Bem-Estar Social no Brasil, Uma Resenha da Literatura, WorkingPaper, n. 880, IPEA, Rio de Janeiro, 2002.
Fajnzylber, P., Minimum Wage Effects through the Wage Distribution: Evidence from Brazil’s Formal and Informal Sectors, Working Paper, n. 151, CEDEPLAR, Universidade Federal de Minas Gerais, 2001.
Ferreira, F., Leite, P. e Messina, J., A more Level Playing Field? Explaining the Decline in Earnings Inequality in Brazil, 1995-2012, International Research Initiative on Brazil and Africa (IRIBA) Working Paper, n. 12, September 2014.
Firpo, S. and Reis, M. C., O Salário Mínimo e a Queda Recente da Desigualdade no Brasil, in Barros, R., Foguel, M. and Ulyssea, G., orgs., Desigualdade de Renda no Brasil: Uma Análise da Queda Recente, v. 2, IPEA, Brasília, 2007.
Foguel, M., Ramos, L. and Carneiro, F, The Impact of Minimum Wage on the Labor Market, Poverty and Fiscal Budget in Brazil, Working Paper, n. 839, IPEA, 2001.
Giambiagi, F. and Franco, S., Esgotamento do Papel do Salário Mínimo como Mecanismo de Combate á Pobreza Extrema, Working Paper, n. 1290, IPEA, Rio de Janeiro, 2007.
Hallak Neto, J. A Distribuição Funcional da Renda e a Economia não Observada no Âmbito do Sistema de Contas Nacionais do Brasil, PhD thesis, Instituto de Economia, Universidade Federal do Rio de Janeiro, Rio de Janeiro, 2013.
Hallak Neto, J. and Saboia, J. A distribuição funcional da renda no Brasil: Análise dos resultados recentes e estimação da conta da renda nos anos de informações preliminares do Sistema de Contas Nacionais. Revista de Economia Aplicada, v. 18, n. 3, July/September 2014.
IBGE. Sistema de Contas Nacionais – Brasil – Referência 2010. Emprego e Remunerações. Nota metodológica n. 14, Rio de Janeiro, 2014. (Available
19
inftp://ftp.ibge.gov.br/Contas_Nacionais/Sistema_de_Contas_Nacionais/Notas_Metod
ologicas_2010/14_emprego_e_remuneracoes.pdf )
IBGE. Sistema de Contas Nacionais – Brasil 2010-2013. Rio de Janeiro, 2015. (Available
in
http://biblioteca.ibge.gov.br/index.php/biblioteca-catalogo?view=detalhes&id=294942 )
Komatsu, B. K., Salário Mínimo, Desigualdade e Informalidade, MSc dissertation, Universidade de São Paulo, São Paulo, 2013.
Lavinas, L., Salário Mínimo, Linha de Pobreza e Benefícios Assistenciais: Desvincular é Preciso?, in Baltar, P., Dedecca, C. and Krein, J., orgs., Salário Mínimo e Desenvolvimento, Unicamp, Campinas, 2005.
Lemos, S., Minimum Wage Effects on Wages, Employment and Prices: Implications for Poverty Alleviation in Brazil, Working Paper 05/15, University of Leicester, 2005.
Menezes Filho, N. and Rodrigues, E. A. S., Salário Mínimo e Desigualdade no Brasil entre 1981-1999: Uma Abordagem Semiparamétrica, Revista Brasileira de Economia, v. 63, n. 3, Rio de Janeiro, July/September 2009.
Neder, H. D. and Ribeiro, R., Os Efeitos Distributivos do Salário Mínimo no Mercado de Trabalho Brasileiro no Período 2002-2008: Enfoque a partir de Distribuições Contrafactuais, Pesquisa e Planejamento Econômico, v. 40, n. 3, December 2010. Neri, M., Gonzaga, G. and Camargo, J., Salário Mínimo, Efeito Farol e Pobreza, Revista de Economia Política, v. 21, n. 2, 2001.
Neri, M. and Giambiagi, F., Previdência Social e Salário Mínimo: O que se Pode Fazer Respeitando a Restrição Orçamentária?, Revista do BNDES, v. 7, n. 13, 2000.
Saboia, J. O Salário Mínimo e seu Potencial para a Melhoria da Distribuição de Renda no Brasil, in Barros, R., Foguel, M. and Ulyssea, G., orgs., Desigualdade de Renda no Brasil: Uma Análise da Queda Recente, v. 2, IPEA, Brasília, 2007.
Saboia, J., Efeitos do Salário Mínimo sobre a Distribuição de Renda no Brasil no Período 1995/2005 – Resultados de Simulações, Econômica, v.9, n.2, 2007.
Saboia, J., Elasticidades dos Rendimentos do Trabalho em Relação ao Salário Mínimo: A Experiência de um Período Recente de Crescimento do Salário Mínimo, Economia e Sociedade, v.19, n. 2, 2010.
Saboia, J., Salário Mínimo e Distribuição de Renda no Brasil – Potencial e Limites, in Barbosa, N., Pessoa, S. and Moura, R. L., orgs., Política de Salário Mínimo para 2015-2018: Avaliações de Impacto Econômico e Social, Elsevier, Rio de Janeiro, 2015.
Saboia, J.; Kubrusly, L. S. Indicadores para o mercado de trabalho metropolitano no Brasil. Working Paper, n. 021/2014, Instituto de Economia, UFRJ, Rio de Janeiro, 2014. Soares, S., O Impacto Distributivo do Salário Mínimo: A Distribuição Individual dos Rendimentos do Trabalho, Working Paper, n. 873, IPEA, Rio de Janeiro, 2002.
20
Soares, S., Análise do Bem-Estar e Decomposição por Fatores da Queda na Desigualdade entre 1995 e 2004, Econômica, v. 8, n. 1, 2006.
Soares, S. A Distribuição dos Rendimentos do Trabalho e a Queda da Desigualdade de 1995 a 2009, Mercado de Trabalho – Conjuntura e Análise, v. 15, n.45, IPEA, 2010. Ulyssea, G. and Foguel, M., Efeitos do Salário Mínimo sobre o Mercado de Trabalho Brasileiro, Working Paper, n. 1168, IPEA, Rio de Janeiro, 2006.
United Nations (UN). System of National Accounts 2008 [SNA-2008]. New York: UN, 2009. (Available inhttp://unstats.un.org/unsd/nationalaccount/docs/SNA2008.pdf )
Scientific Coordinator : Xavier Oudin ([email protected]) Project Manager : Delia Visan ([email protected])
Find more on www.nopoor.eu Visit us on Facebook, Twitter and LinkedIn