This project is funded by the European Union under the 7th Research Framework Programme (theme SSH) Grant agreement nr 290752. The views expressed in this press release do not necessarily reflect the views of the European Commission.
Working Paper n°78
Labor Market and Income Distribution in the
Economic Slowdown and Crisis of the Period 2012/2016
– Minimum Wage versus GDP
João Saboia, João Hallak Neto, André Simões, Paulo Dick
UFRJ
Enhancing Knowledge for Renewed Policies against Poverty1
Labor Market and Income Distribution in the
Economic Slowdown and Crisis of the Period
2012/2016 – Minimum Wage versus GDP
1
João Saboia2; João Hallak Neto3; André Simões3; Paulo Dick3
Abstract: This study deals with the evolution of the Brazilian labor market and the distribution of labor income in the recent period of slowdown and economic crisis. During the period analyzed there
were significant changes in the labor market with an increase of unemployment and labor informality.
Despite the deterioration of the labor market in recent years, especially in 2015 and 2016, inequality indicators showed a different trend, with continued deconcentration of income and subsequent stabilization until the end of the period. The econometric analysis showed that these results are associated not only with the behavior of the economy but also with the policy of increasing the minimum wage, which maintained the income gains of the lower tenths of the income distribution at higher levels than the ones observed for the higher tenths.
Thus, the dynamics of the Brazilian labor market revealed the importance of public policies to guarantee the living conditions of unemployed workers. For those who remain employed, the object of the present study, policies such as increasing the minimum wage fulfill the function of minimizing the losses in income caused by the crisis.
Key words: Labor market; Income distribution; Labor income; Minimum wage. JEL Codes: J21; J31.
1 This article was developed with resources from the Nopoor Project supported by the European Union. See www.nopoor.eu. 2
Professor Emeritus of the Institute of Economics at the Federal University of Rio de Janeiro (UFRJ).
2
Labor Market and Income Distribution in the Economic Slowdown and Crisis of the
Period 2012/2016 – Minimum Wage versus GDP
1. Introduction
The past fifteen years were the scene of significant transformations in the Brazilian labor market, which included a long period of dynamism that translated into high rates of job growth and a continuous rise in income, with positive effects on worker living conditions, and a – current – phase marked by the increase in unemployment and great worsening of the labor market. Its dynamic was influenced by a combination of public policies devoted to the expansion of demand – led by the policy of increasing the minimum wage – whose effects, for their part, did not appear to be sustainable over time, since they operated in specific political and economic circumstances.4
An important consequence of this process is the increase of labor formalization, in which the growth of the proportion of formal employee and of those who contribute to social security reveals a labor market that has been providing basic conditions of social protection for more than half of Brazilian workers. Just as important is the increase in labor income that is seen in all income levels, but that has a greater impact among the lower brackets, especially those with incomes around the minimum wage, leading not only to the fall in inequality, but also to positive impacts in the living conditions of workers. This source of income composes more than 70% of household incomes in Brazil (IBGE, 2015).
However, this dynamism, which was the tonic of the past few years, has been put to the test with the deepening of the economic and political crisis that has fallen upon the country since mid-2014, leading to the inversion of trends presented by a series of indicators that until then reflected the favorable conditions of the Brazilian labor market. The continuous increase of the unemployment rate and, to a lesser degree, the fall in average labor income, has been pointing toward the deterioration in the living conditions of Brazilian workers, especially for the portion with a more vulnerable inclusion in the labor market. This behavior, seen both for the working population and for the set of the population that is economically active, did not directly affect the indicators of income inequality, when the labor income was analyzed. In other words: despite the fall in labor income, inequality indicators have continued to fall, throughout almost the whole period, which most likely implies that income is falling more among workers who earn more.
This paper addresses issues that involve the recent behavior of the Brazilian labor market and its impact on indicators of income inequality. It intends to show that, despite the impacts of the economic crisis on the labor market, the income of the most vulnerable strata of workers fell less than what was observed for the strata with the highest earnings. This result most likely occurred on account of the continuation of the policy of increasing the minimum wage, which has a greater impact on the segments that earn the lowest incomes. This paper also intends to show that, although unemployment has reached high levels, promoting the deterioration of the population’s living conditions, among the working population the effects of the crisis have not significantly affected the general structure of the labor market. More than half of employed workers have remained in formal jobs, at the same time in which one sees a growth in social security contributions by employers and mainly by Own-account workers.
The paper is organized into three parts, in addition to this introduction. The objective of the second section is to analyze the recent behavior of the Brazilian labor market in light of information from
4 The minimum wage was created in Brazil in 1940. Initially there were several regional levels. It was unified nationally in
the 1980s. There is currently only one official value for the minimum wage in the country, although some more developed states like São Paulo and Rio de Janeiro have slightly higher levels. By 2017 its value is set at R$ 937, approximately US$ 400 ppp.
3
the Continuous National Household Sample Survey (PNAD Contínua). The household interviews collected since 2012 by this new survey provide cyclical information – quarterly – about the labor market, which allows for the detection of subtler changes in its behavior such as those related to the seasonality of employment and of income. It intends to more thoroughly explore the recent dynamics of important structural indicators such as the Economically Active Population (EAP), Working-Age Population (WAP), and Working Population (WP), as well as identify changes in the inclusion of workers in the labor market.
This information will provide the bases for the third part of the paper, whose objective will be to analyze the changes in the forms of income appropriation by workers facing the recent economic crisis. Using the information from the Continuous National Household Sample Survey (PNAD Contínua), one may follow the behavior of average and total labor income on a quarterly basis. One may also assess the distribution of income among the working population according to classic measures of inequality, considering the impact of minimum wage and economic growth on labor income distribution.
The paper ends with the main conclusions.
2. Stagnation, Crisis, and the Labor Market
The Brazilian labor market presented significant dynamism between 2004 and 2014, with a strong generation of formal employment, a fall in the unemployment rate, and a reduction of informality.5 As of mid-2014, however, the national economy gave its first signs of crisis, a fact that worsened as of 2015, when economic indicators, which until then had been presenting a favorable trend, began to regress.6 It is important to mention that the complexity of the aforementioned crisis resides in the fact that its foundations are not only connected to the behavior of the national economy, but also through its relation to the international economy, and especially, through its political component.
This dynamic strongly impacted the Brazilian labor market throughout 2015 and 2016, which in this paper presents the challenge of performing a detailed analysis of its behavior in this recent period. In order to identify and characterize the main modifications in the context of the economic crisis, information has been used from a source that has until now been little explored in academic studies on the labor market: the Continuous National Household Sample Survey (PNAD Contínua) performed by the Brazilian Institute of Geography and Statistics (IBGE) since 2012.7
Graph 2.1 presents important labor market structural indicators that were marked by more intense fluctuations since the beginning of 2015. This movement can be clearly seen in the behavior of the unemployment rate – percentage of unemployed people in relation to the Economically Active Population
5 Different publications, such as Krein et al. (2011); Baltar and Leone (2012); Cepal (2013); Amitrano (2013) and
Saboia (2014) have documented and interpreted the Brazilian labor market during this period.
6 According to the Brazilian Business Cycle Dating Committee (CODACE) of the Getúlio Vargas Foundation (FGV),
the recession began in the second quarter of 2014, after a peak in the business cycle in the first quarter of this year (see CODACE, 2015).
7 The Continuous National Household Sample Survey (PNAD Contínua) was created in the context of the
reformulation process of IBGE household surveys, whose main objective was to make its system of labor statistics information more robust, adjusting them to the demands for increasingly decentralized and more frequent information. The surveys that were the object of reformulation – the Monthly Employment Survey (PME) and the National Household Sample Survey (PNAD) – presented distinct characteristics, which therefore made it necessary to standardize the methodologies, periods of reference, and dissemination of information. The Continuous National Household Sample Survey (PNAD Contínua) arose as a synthesis of these two surveys, adding in its methodology an expanded geographical coverage of the PNAD with the circumstantial frequency of the PME. In addition, it incorporated a series of recommendations from the 19th International Conference of Labor Statisticians that made possible the calculation of new indicators, which redefined, in the same way, a series of concepts, such as, for example, the very concept of labor, which came to incorporate non-paid activities in its definition (Simões and Dick, 2016; OIT, 2013).
4
(EAP) – and of the level of employment – percentage of employed people in relation to the working-age population (WAP). What one notes in the first case is a differentiated behavior in the quarters from 2015, when compared to the previous years analyzed, in which one observes a definite pattern in the fluctuation of unemployment, marked by falling rates in the last quarters and growth in the first quarters. This is related, among other reasons, to a seasonal effect of hiring in the periods before Christmas and firing in the beginning of the year. In 2015 the unemployment rate continued to rise after the beginning of the year, as a reflection of the effects of the crisis, which was responsible for a growth of around 40% in the number of unemployed people in the fourth quarter of this year, when compared to the same quarter in 2014. This dynamic continued in 2016, with the unemployment rate reaching 11.9% in the fourth quarter.
The level of employment, for its part, which until mid-2014 remained steady, began to fall as of the fourth quarter of this year, as a result of the higher growth of the WAP in relation to the Working Population (WP). The pace of the decrease was intensified as of the third quarter of 2015, as an effect of the even greater reduction in the number of employed people.
Graph 2.1: Unemployment Rate, Employment Rate, and Labor Force Participation Rate – Brazil – 2012/2016
Source: IBGE, Continuous National Household Sample Survey (PNAD Contínua).
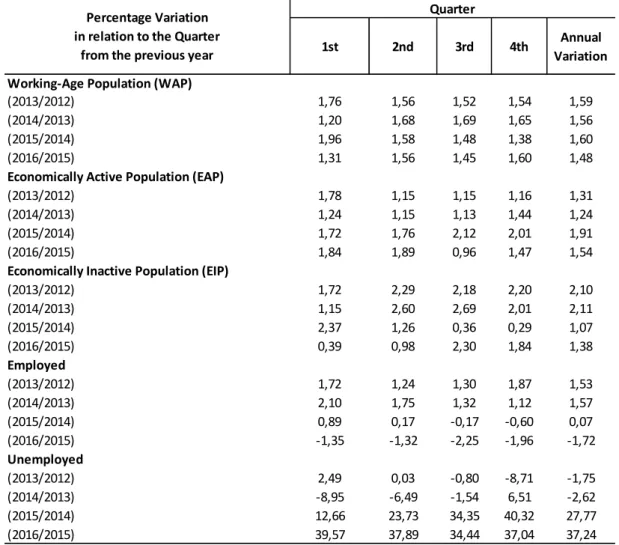
The labor force participation rate – percentage of EAP in relation to the WAP –, for its part, remained steady, but its composition began to count on a greater proportion of unemployed people. As an important effect of the economic crisis one observes a greater proportion of unemployed people looking for employment, when one compares the variation in the EAP during the last three quarters of 2015, which is greater than that observed for the other previous years analyzed. In fact, the variation in the EAP is greater than that in the WAP during this period, which reveals a change in trends that had prevailed until then, and points to the entry in the labor market of people who had been inactive (Table 2.1). The first two quarters of 2016 point to a small reduction in the EAP – and a resulting growth in the -economically inactive population (EIP), a trend that continues in the other quarters. Even so, the significant growth in unemployment throughout the year of 2016 is noteworthy. One observes, similarly, an intensification in the pace of the decrease in the working population, which explains the even greater rise in unemployment rates among the last quarters of 2015 and 2016, and corroborates the perception of deterioration in the labor market.
5
Table 2.1: Percentage Variation in Labor Market Indicators - Brazil - 2012/2016
(%)
Source: IBGE, Continuous National Household Sample Survey (PNAD Contínua).
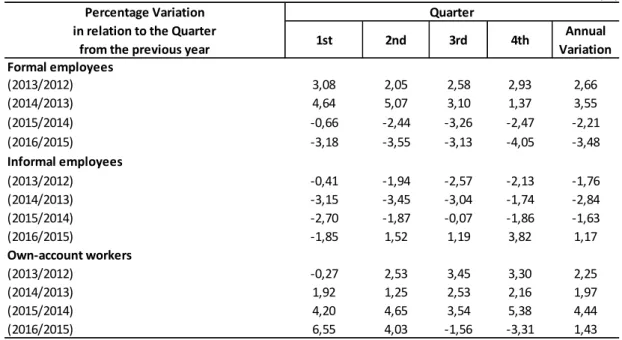
An important dimension of the labor market to be analyzed in this period refers to the labor relations established by workers, whose characteristics will determine the forms of reproduction of their material living conditions. The behavior of the three most important categories of workers was therefore analyzed, which together respond for more than 80% of work positions: formal employees, informal employees, and own-account workers.
In the first place, a continuous decline is observed, since the beginning of the series, in the number of informal employees. This reveals a movement that is different from that of the other categories analyzed, and it is related, most likely, to the formalization process that advanced until mid-2014, which granted rights to workers who had been unprotected until then.8 On the other hand, the reduction in the pace of the decrease in the number of informal employees among the quarters of 2015/2014, in comparison with 2014/2013,seems to indicate that the economic crisis has been inhibiting the effects of the formalization process in the labor market, which occurred previously through the migration of
8 There is no common definition in relation to what to consider as protected or formal employment, which vary
according to the study elaborated. For example, the Institute for Applied Economic Research (IPEA) adopts three measures that are denominated Degree of Informality (GI) 1, 2, and 3. These are: GI1: (informal employees + own-account workers) / (protected workers + informal employees + own-account workers); GI2: (informal employees + own-account workers + non-paid workers) / (protected workers + informal employees + own-account workers + non-non-paid workers + employers); and GI3: (informal employees + own-account workers) / (protected workers + informal employees + own-account workers + employers). In this paper we used another classification to separate protected and non-protected employments, also taking into consideration social security contribution.
1st 2nd 3rd 4th Annual
Variation Working-Age Population (WAP)
(2013/2012) 1,76 1,56 1,52 1,54 1,59 (2014/2013) 1,20 1,68 1,69 1,65 1,56 (2015/2014) 1,96 1,58 1,48 1,38 1,60 (2016/2015) 1,31 1,56 1,45 1,60 1,48
Economically Active Population (EAP)
(2013/2012) 1,78 1,15 1,15 1,16 1,31 (2014/2013) 1,24 1,15 1,13 1,44 1,24 (2015/2014) 1,72 1,76 2,12 2,01 1,91 (2016/2015) 1,84 1,89 0,96 1,47 1,54
Economically Inactive Population (EIP)
(2013/2012) 1,72 2,29 2,18 2,20 2,10 (2014/2013) 1,15 2,60 2,69 2,01 2,11 (2015/2014) 2,37 1,26 0,36 0,29 1,07 (2016/2015) 0,39 0,98 2,30 1,84 1,38 Employed (2013/2012) 1,72 1,24 1,30 1,87 1,53 (2014/2013) 2,10 1,75 1,32 1,12 1,57 (2015/2014) 0,89 0,17 -0,17 -0,60 0,07 (2016/2015) -1,35 -1,32 -2,25 -1,96 -1,72 Unemployed (2013/2012) 2,49 0,03 -0,80 -8,71 -1,75 (2014/2013) -8,95 -6,49 -1,54 6,51 -2,62 (2015/2014) 12,66 23,73 34,35 40,32 27,77 (2016/2015) 39,57 37,89 34,44 37,04 37,24 Percentage Variation in relation to the Quarter
from the previous year
6
informal employees to formal ones (Table 2.2). The growth of informal employees observed in the last three quarters of 2016 represents a true outlier in relation to the consecutive declines that occurred until then, which points to the gravity of the effects of the economic crisis on the labor market.
Table 2.2: Percentage Variation in the Number of Workers in Selected Categories of Employment – Brazil – 2012/2016
(%)
Source: IBGE, Continuous National Household Sample Survey (PNAD Contínua).
Similarly, a drop is observed in the number of formal employees as of the first quarter of 2015 that was accompanied, until mid-2016, by a more intense increase in the number of own-account workers in the same period (Table 2.2). This dynamic was responsible for a reduction in the share of formal employee in the structure of employment which, in 2016, decreased to percentages close to those observed in 2012. Own-account workers, for their part, had a significant and continuous percentage growth since 2014, reaching one-fourth of all Brazilian workers in 2016 (Graph 2.2). As of mid-2016, however, a significant reduction is observed in the number of own-account workers, concomitant to the continuing decline in formal employees and rise in informal ones. This movement indicates a worsening of the effects of the economic crisis on the labor market, since the movement of the supposed “migration” of formal employees to own-account workers is possibly being substituted by the “migration” of both to informal employees.
1st 2nd 3rd 4th Annual Variation Formal employees (2013/2012) 3,08 2,05 2,58 2,93 2,66 (2014/2013) 4,64 5,07 3,10 1,37 3,55 (2015/2014) -0,66 -2,44 -3,26 -2,47 -2,21 (2016/2015) -3,18 -3,55 -3,13 -4,05 -3,48 Informal employees (2013/2012) -0,41 -1,94 -2,57 -2,13 -1,76 (2014/2013) -3,15 -3,45 -3,04 -1,74 -2,84 (2015/2014) -2,70 -1,87 -0,07 -1,86 -1,63 (2016/2015) -1,85 1,52 1,19 3,82 1,17 Own-account workers (2013/2012) -0,27 2,53 3,45 3,30 2,25 (2014/2013) 1,92 1,25 2,53 2,16 1,97 (2015/2014) 4,20 4,65 3,54 5,38 4,44 (2016/2015) 6,55 4,03 -1,56 -3,31 1,43 Percentage Variation in relation to the Quarter
from the previous year
7
Graph 2.2: Share of Workers Aged 16 Years or Older in Selected Categories of Employment – Brazil – 2012/2016
Source: IBGE, Continuous National Household Sample Survey (PNAD Contínua).
Surprisingly, the growth in the share of own-account workers in the structure of the Brazilian labor market benefited in a way the formalization process of workers, which would have occurred even in a context of economic crisis and reduction in the proportion of formal employees (Graph 2.3). In fact, the proportion of protected workers arrived at 63.8% of the total in the fourth quarter of 2016, versus 61.6% in the same period of 2012. On the other hand, an important change is observed in the composition of this group, in which there is an increase in the share of segments whose access to social protection is linked to the payment of social security, which does not include all the benefits derived from the possession of formal contracts. While in the fourth quarter of 2012 own-account workers and employers who contribute to social security corresponded to 13.3% of all protected workers, in the fourth quarter of 2016 this proportion arrived at 17.7%. Apparently, the own-account seem to have become aware of the importance of social security contribution and they continued the behavior that had been occurring before the crisis, increasing the share of contributors.9
8
Graph 2.3: Share of the Categories that Compose Formal Employment – Brazil – 2012/2016
Source: IBGE, Continuous National Household Sample Survey (PNAD Contínua).
The growth of social security contribution is not a phenomenon restricted to own-account workers, being likewise seen among employers and informal employees. This last case deserves to be stressed, for it represents a search for greater social protection among non-formalized workers, which occurs even in a scenario of economic crisis as already highlighted (Graph 2.4).
Graph 2.4: Share of Workers Who Contribute to Social Security According to Selected Categories of Employment – Brazil – 2012/2016
Source: IBGE, Continuous National Household Sample Survey (PNAD Contínua).
The behavior of labor incomes analyzed by the Continuous National Household Sample Survey (PNAD Contínua) includes elements that allow one to better qualify the expansion of worker access to social security, independently of the characteristics of their labor relations. Similarly, they offer elements that allow one to apprehend aspects referring to their living conditions, through the analysis of different measures of inequality, which will be done in the next section.
9
3. Labor Income and Its Distribution in the Context of an Economic Crisis
3.1. Evolution of Labor Incomes as of 2012
The period of reference of the Continuous National Household Sample Survey (PNAD Contínua) analyzed in this chapter, with the quarterly information from 2012 to 2016, although short, is quite fertile for the analysis of incomes in the country. These 20 quarters saw the decline of the expansive post-2010 cycle, the stagnation and later depression observed during the final years of the series. These three distinct phases in the 5-year period are made evident by the quarterly GDP growth rates, which are observed in Graph 3.1.
Graph 3.1: Quarterly GDP Growth Rate in Relation to the Same Quarter of the Previous Year – Brazil – 2012/2016
Source: IBGE, System of Quarterly National Accounts.
As of the second quarter of 2014, the quarterly GDP variation rates (in relation to the same quarter of the previous year), which had been positive until then, become null and come to be negative as of 2015, remaining as such until the last available result when this text was prepared. The strong retraction becomes evident when considering the annual results of the last two years (-3.8% in 2015; and -3.6% in 2016), which represent a cumulative drop of 7.5% in the GDP in real terms.
As expected, the intense decline of economic activity at the end of the period brought negative impacts to the incomes in the labor market. However, these occurred in lesser magnitude in relation to what could have happened in view of the strong drop in the GDP. A plausible hypothesis for this result is the role of the minimum wage, whose real value was maintained on account of its official readjustment policy, which contributed to minimizing the losses of labor incomes. The nominal readjustments of the minimum wage were systematically higher than the inflation of the previous year between 2012-2016.
The quarterly data reinforce that labor income had a favorable behavior until 2014. The number of employed people, the real average income, and the mass of labor income mostly grew until 2014, but began to record frequent negative quarterly variations in the two following years (Table 3.1).
10
Table 3.1: Employed People, Minimum Wage (MW), Average Income, and Total Income per Quarter – Brazil – 2012/2016 (in R$ of 2006.04)
Source: Continuous National Household Sample Survey (PNAD Contínua)/IBGE.
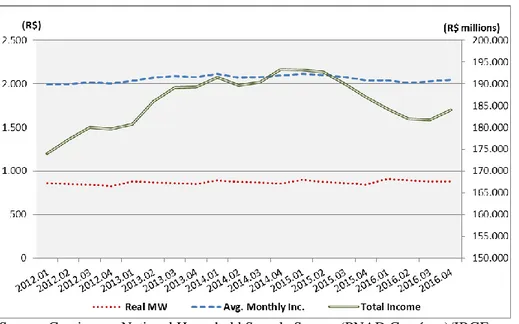
Table 3.1 makes evident the trajectory pattern of the minimum wage, which has its annual readjustment in the first quarter, and the inflationary loss over the following quarters until the date of the new readjustment. One also perceives that, in a way, such a behavior tends to be transmitted to the average income, as defined in the year of 2015 and in the beginning of 2016. In this period in particular, in addition to the actual economic and political crisis, there was an upsurge in inflation, which more rapidly corroded the real gains in incomes. Nonetheless, the two final quarters of 2016 show a small recovery of real average income, a behavior that may be associated with the reduction in the inflationary pace during the second semester of the year.
The curves that portray the quarterly evolution of the wage variables in Table 3.1 are presented in Graph 3.2. The behavior of the total income (secondary axis), for aggregating in a single indicator the employed people and the average income, is revealing both of the improvement in the labor market, which prevailed until mid-decade, and of its deterioration, which began in the second quarter of 2015 and was partially reverted at the end of 2016.
Period
(quarter) (thou.) (var %) (R$) (var %) (R$) (var %) (R$ millions) (var %)
2012.01 87.245 861 1.995 174.055 2012.02 88.765 1,7 851 -1,2 1.997 0,1 177.263 1,8 2012.03 89.327 0,6 843 -0,9 2.016 1,0 180.083 1,6 2012.04 89.524 0,2 829 -1,7 2.007 -0,4 179.675 -0,2 2013.01 88.743 -0,9 883 6,6 2.037 1,5 180.770 0,6 2013.02 89.862 1,3 871 -1,4 2.070 1,6 186.013 2,9 2013.03 90.486 0,7 866 -0,5 2.091 1,0 189.205 1,7 2013.04 91.200 0,8 854 -1,4 2.076 -0,7 189.332 0,1 2014.01 90.608 -0,6 892 4,5 2.114 1,8 191.545 1,2 2014.02 91.435 0,9 874 -2,0 2.074 -1,9 189.637 -1,0 2014.03 91.682 0,3 869 -0,7 2.077 0,1 190.424 0,4 2014.04 92.218 0,6 856 -1,5 2.097 1,0 193.381 1,6 2015.01 91.417 -0,9 902 5,4 2.114 0,8 193.255 -0,1 2015.02 91.594 0,2 877 -2,7 2.104 -0,5 192.713 -0,3 2015.03 91.526 -0,1 863 -1,6 2.077 -1,3 190.099 -1,4 2015.04 91.665 0,2 843 -2,3 2.040 -1,8 186.997 -1,6 2016.01 90.183 -1,6 913 8,3 2.044 0,2 184.333 -1,4 2016.02 90.382 0,2 896 -1,8 2.013 -1,5 181.939 -1,3 2016.03 89.464 -1,0 885 -1,3 2.031 0,9 181.701 -0,1 2016.04 89.869 0,5 880 -0,5 2.048 0,8 184.052 1,3
11
Graph 3.2: Minimum Wage (MW), Average Income, and Total Income per Quarter – Brazil – 2012/2016 (in R$ of 2006.04)
Source: Continuous National Household Sample Survey (PNAD Contínua)/IBGE.
The series of incomes consolidated annually (Table 3.2) show that, in relation to 2012, both the average income and the total income are still relatively preserved, with growth rates of 1.5% and 3.0%, respectively. However, considering 2014 as a reference, only the variation in the minimum wage was positive (+2.4%). In this comparison, the average income recorded a loss of 2.7% and the total labor income a drop of 4.3%.
Table 3.2: Employed People, Minimum Wage (MW), Average Income, and Total Income in real terms per Year – Brazil – 2012/2016 (in R$ of 2006.04)
Source: Continuous National Household Sample Survey (PNAD Contínua)/IBGE.
The results of the collective negotiations in the 2012-2016 period reinforce the perception of the worsening of labor conditions in the country. Contrary to what had been observed until 2014, a significant part of wage negotiations was not translated into real gains for workers in the years of 2015 and 2016 (Graph 3.3). While the collective agreements that resulted in negotiations below inflation were only 2.3% in 2014, they went to 18.7% in 2015 and to a significant 36.7% in 2016. The loss of bargaining power of employed people becomes evident in the two final year of the series.
Period
(annual avg.) (thou.) (var %) (R$) (var %) (R$) (var %) (R$ millions) (var %)
2012 88.715 846 2.004 177.763 2013 90.073 1,5 869 2,7 2.069 3,2 186.315 4,8 2014 91.486 1,6 873 0,5 2.091 1,1 191.251 2,6 2015 91.550 0,1 871 -0,2 2.084 -0,3 190.768 -0,3 2016 89.974 -1,7 893 2,5 2.034 -2,4 183.008 -4,1 2014/2012 3,1 3,2 4,3 7,6 2016/2014 -1,7 2,4 -2,7 -4,3 2016/2012 1,4 5,6 1,5 3,0
12
Graph 3.3: Distribution of Wage Readjustments in Comparison with the National Consumer Price Index (INPC) – Brazil – 2012/2016
Source: Inter-Union Department of Statistics and Socio-Economic Studies (DIEESE), Monitoring System of Salaries (SAS).
3.2. Distribution of Labor Income
As of the mid-2000s, Brazil experienced an extremely favorable period in relation to the labor market and to the distribution of labor income. With the economic growth in most of the period, progress was noted in relation to job creation and to salary improvement, which was reflected in a less unequal distribution of income in the country.
The policy of increasing the minimum wage, combined with the production of goods and services and the heated labor market, which led to real increases in labor income, an expansion of formal employment, and a greater worker bargaining power, resulted in a reduction of the amplitude of the wage gap in the 2004-2014 period.10 Consider, for example, that, based on the distribution of labor income in the National Household Sample Survey (PNAD), the Gini index presented a continuous decline, going from 0.544 in 2004, to 0.489 in 2014. The distribution ratios between the average incomes of the 10% with the highest incomes and the 40% with the lowest incomes also suffered a significant reduction, going from 16.2 to 11.6 in the same period.11
The heating of the labor market and the rise of the incomes observed in most of this period also favorably impacted the share of labor income generated in the economy, which occasioned an increase in its weight in the GDP, as of 2004. Data from Brazil’s System of National Accounts (SCN-IBGE) reveal that the share of wages in the GDP went from 38.3%, in 2004, to 43.5%, in 2014.12
The fall in the real income of workers during the crisis that began in mid-2014, and subsequently intensified, was not accompanied by a rise in the levels of inequality in the distribution of incomes. Such a movement, in a sense, was expected, but it was not confirmed through the analysis of different indicators in most of the available period. Although the continuing trend of inequality reduction, which had been revealed since the beginning of the series, continued until the second quarter of 2016, this trend
10 According to General Registry of Employed and Unemployed (CAGED)/ Ministry of Labor and Employment
(MTE), the liquid creation of formal job positions was of 17.5 million, between 2004 and 2014.
11
Saboia et al (2017).
13
seems to present a reversal in the last two quarters. That being the case, the increasing deterioration of the labor market would be starting to inhibit the effects of redistributive public policies.
It is worth pointing out the greatest reduction of inequality portrayed by the indicator that measures the ratio between the top of income distribution and the strata with the lowest incomes which, according to authors such as Cobham (2013) and Palma (2011), has a greater elasticity to policies and economic cycles, when compared to the center of the distribution. This movement may be related to the continuation of the policy of increasing the minimum wage throughout the economic crisis, which granted real gains not only to the workers who receive this amount, but also to those whose salaries are influenced by the value of the minimum wage. In both cases, it possibly impeded (or reduced) the fall in the income received by the lowest tenths of the population distribution, when compared to the top of the distribution (Brito, 2015). This theme is explored more at length in the next section.
In relation to the inequality measures, the reduction in the ratio between the average income of workers with 10% of the highest incomes and those with 40% of the lowest incomes went down from almost 13 times in the beginning of 2012 to a little less than 12 times at the end of 2016. The Gini index also suffered a reduction over the period analyzed, but at a slower pace, since its calculation takes all income levels into consideration, with a significant weight exerted by the center of distribution, which fluctuates less than the extremes (Graph 3.4).13 Both indicators reveal that, despite the oscillations among the quarters, the general trend was of improvement in the distribution of labor incomes, at least until the second quarter of 2016. Such data reinforces the hypothesis in relation to the continuation of the gains of the workers who receive minimum wage, in a context marked by the fall in labor income as a whole.
Graph 3.4: Gini Index (G) and Ratio between the Average Labor Income of the 10% with the Highest Incomes and the 40% with the Lowest Incomes in the Working Population (Ratio 10/40) – Brazil – 2012/2016
Source: Continuous National Household Sample Survey (PNAD Contínua)/IBGE.
Thus, the quarterly data of labor income indicate that, even in the second half of the five-year period of 2012-2016, when the economic and political crisis intensely affects economic growth, reflecting negatively on the labor market, the continuing improvement in the distribution of incomes remains relatively preserved. However, this behavior appears to begin to show signs of reversal as of mid-2016,
13 It was noticed that the data from the inequality measures in the 2014-2 and 2014-3 quarters did not present the
14
when the indicators, even though they seem to be better than those observed for previous years, begin to point toward an increase in levels of inequality.
Graph 3.5 synthesizes the results consolidated annually for the two measures of distribution presented in this section. While the ratio 10/40 suffered a reduction between 2012 and 2016 from 12.5 to 11.7, the Gini fell from 0.503 to 0.492, considering the annual averages.14
Graph 3.5: Gini Index (G) and Ratio between the Average Labor Income of the of the 10% with the Highest Incomes and the 40% with the Lowest Incomes in the Working Population – Brazil – 2012/2016 (Annual Averages)
Source: Continuous National Household Sample Survey (PNAD Contínua)/IBGE.
3.3. Distribution of Labor Income, Minimum Wage, and GDP
The minimum wage is considered a relevant variable for the definition of the economy’s average wage, for it has an effect on negotiated minimum wage levels for different workers and also on income from informal labor, impacting all wage distribution. Its use as an explanatory variable for the analysis of the dispersion of labor income becomes, therefore, fundamental.
After 2004, political and economic circumstances favored the concession of annual real increases in the minimum wage, a measure that was ratified with the legislative formalization approved in the year of 2011.15 In the period of high GDP average growth rates and real minimum wage readjustments, between 2004 and 2013, a significant reduction of income inequality was seen in the country.
This being the case, some studies highlight the existence of an inverse relation between the minimum wage and labor income inequality in Brazil.16 Others used the minimum wage as an explanatory variable for the effects of income inequality in general, since its amount determines the official Social Security (insurance and welfare) minimum, impacting the basic value of pensions, and the Continuous Cash Benefit (BPC).17
14 Hoffmann (2016) finds that the distribution of labor income in the recent period worsened when one includes zero
income for unemployed workers and considers all the EAP and not only the working population. Bearing in mind the large increase in the unemployment rate, such a result is not surprising.
15 Law 12.382, which sets the rules for its annual readjustments, defines every year the correction of inflation by the
National Consumer Price Index (INPC), plus the real increase according to the GDP growth rate verified two years beforehand.
16
Firpo and Reis (2007), Neder and Ribeiro (2010).
15
The inverse relationship between MW and wage inequality observed in Brazil is compatible with the international results. Observing the USA, Lee (1999) and Autor; Katz and Kearney (2008) conclude that the MW real value loss affected the work income distribution, especially among lower wages and thus contributing for the growth in the wage dispersion. In the same direction, Bosch and Manacorda (2010) found a relation between MW value decrease and work income inequality increase in Mexican economy. Manning 2012; Butcher et al. 2012; Dolton et al. 2010, emphasized that the definition of MW in Great Britain in 1999 was responsible for lower wages dispersion in the following years.
This section seeks to explore more at length the Continuous National Household Sample Survey (PNAD Contínua) database in order to substantiate the result seen in section 3.2, that is, the continuing reduction of labor income inequality between the years 2012 and 2016. It is worth noting that such a movement, though in lesser intensity, was not interrupted even after the beginning and deepening of the economic crisis clearly observed since the second quarter of 2014.
Table 3.4 presents quarterly the average income distribution by tenths and halves of the working population, as well as the correlations between them and the minimum wage (MW) and GDP series – in real terms. The examination of the results in the final lines of the table shows that, for the minimum wage (MW), the highest coefficient appears in the third tenth (0.885), which is precisely where people who receive income equal or very close to the minimum wage (MW) are situated. Positive and moderate correlations with the minimum wage (MW) are also seen around the third tenth of income distribution. All the tenths presented positive correlations with the minimum wage (MW). As for the relation to the GDP, the last tenth presents the greatest coefficient of correlation (0.617), while the three previous ones are also relatively high.
Such results indicate that the average labor incomes of the tenths with the relatively lowest amounts have, as expected, a greater association with the minimum wage (MW). For the tenths closer to the top of the distribution the association is stronger in relation to the GDP. Since in the period evaluated there were continuous increases in the minimum wage (MW) on account of the official policy, and there was very little GDP growth, the result found in the examination of the correlations points toward the continuation of the fall in labor income inequality between 2012 and 2016.
To observe this association in a more aggregated way, we proceeded to examine the correlations between the halves of higher (50% of highest incomes) and lower income (50% of lowest incomes) and the minimum wage (MW) and GDP series in the final two columns of Table 3.4. The results obtained reinforce the observed conclusions, since the half of lower income presented a positive and relatively high correlation with the minimum wage (MW) and a weaker correlation with the GDP. The opposite occurred with the half that receives higher incomes, which presented a strong correlation with the GDP and a weak one with the minimum wage (MW).
16
Table 3.4: Income Real Values and Correlation with the Minimum Wage (MW) and the GDP for the Tenths and the Halves of Labor Income – Brazil – 2012/2016 (in R$ of 2016.04)
Source: Elaborated by authors based on the Continuous National Household Sample Survey (PNAD Contínua)/DPE/IBGE.
To complement the analysis developed, a model of multiple regression was used to quantify the joint influence of the minimum wage and the GDP on the average income in the tenths of distribution, as well as in its halves in the more aggregated analysis. The logarithms of the variables were considered.
log Yit = a + b log MWt + c log GDPt + residue, (1)
where Yit represents the average labor income of the tenths of the income distribution, i = 1, 2, ..., 10, in the period of time t (first quarter of 2012 to the fourth quarter of 2016). A second version of the model was also used for the incomes from the two halves of the distribution (50% lowest and 50% highest incomes).
Before estimating the model, it was observed that some original data for the income tenths, minimum wage, and GDP seem to be non-stationary series, as suggested by the KPSS test (at the significance level of 5%), such that the estimates of the regression coefficients were possibly being biased by the characteristic of the series. To avoid this, we opted to estimate also the regressions using the first-order differences of the variables used, that is, Δ𝑦𝑡 = 𝑦𝑡− 𝑦𝑡−1, to make the series stationary.18
Table 3.5 presents the estimates of the model and the p-value for the distribution by tenths and halves of average incomes. The two models are presented – with and without first-order differences. The p-value for the Durbin-Watson statistic is also presented, 19 showing that the differentiated series present better results with respect to the absence of residual self-correlation in the model.
Beginning with the average incomes of the two halves, one notes that the relation with the minimum wage (MW) is stronger (higher values for the minimum wage coefficient estimate) in the first
18 As can be verified in the table of the KPSS test in the annex, after takingthe differences there was an improvement in the
stationarity of some series.
19
The Durbin-Watson (DW) test has a null hypothesis of absence of autocorrelation in the residues. Using a level of significance of 5%, the models with p>0,05 do not reject this hypothesis.
Total D1 D2 D3 D4 D5 D6 D7 D8 D9 D10 M1 M2 2012_01 861 163,2 1.995 252 627 831 908 1.070 1.276 1.557 2.021 3.004 8.405 738 3.253 2012_02 851 168,0 1.997 255 648 846 914 1.082 1.291 1.577 2.040 3.022 8.299 749 3.246 2012_03 843 173,6 2.016 265 664 841 922 1.097 1.304 1.597 2.071 3.057 8.338 758 3.273 2012_04 829 171,9 2.007 266 666 827 928 1.101 1.304 1.606 2.086 3.064 8.227 758 3.257 2013_01 883 167,6 2.037 270 676 863 950 1.107 1.319 1.624 2.116 3.072 8.370 773 3.300 2013_02 871 174,7 2.070 275 689 869 955 1.121 1.337 1.648 2.148 3.097 8.565 782 3.359 2013_03 866 178,4 2.091 289 709 869 967 1.144 1.358 1.668 2.183 3.146 8.574 796 3.386 2013_04 854 176,3 2.076 288 706 859 969 1.161 1.365 1.680 2.200 3.153 8.380 797 3.356 2014_01 892 173,5 2.114 301 727 889 988 1.175 1.380 1.698 2.196 3.144 8.645 816 3.413 2014_02 874 174,0 2.074 244 679 875 970 1.156 1.363 1.680 2.166 3.098 8.505 785 3.363 2014_03 869 177,3 2.077 221 652 868 964 1.154 1.361 1.682 2.165 3.108 8.597 772 3.383 2014_04 856 175,7 2.097 273 706 861 987 1.163 1.392 1.701 2.195 3.180 8.518 798 3.397 2015_01 902 170,4 2.114 294 729 904 990 1.167 1.396 1.707 2.176 3.155 8.622 817 3.411 2015_02 877 168,9 2.104 285 717 882 979 1.149 1.382 1.687 2.172 3.135 8.648 803 3.405 2015_03 863 169,2 2.077 280 700 868 968 1.140 1.369 1.670 2.156 3.136 8.481 791 3.363 2015_04 843 165,6 2.040 273 687 851 963 1.132 1.348 1.648 2.127 3.095 8.278 781 3.299 2016_01 913 161,2 2.044 269 677 889 972 1.123 1.343 1.641 2.124 3.086 8.313 786 3.302 2016_02 896 162,8 2.013 263 673 897 964 1.121 1.341 1.628 2.106 3.063 8.076 783 3.243 2016_03 885 164,4 2.031 269 686 886 963 1.132 1.357 1.633 2.118 3.079 8.184 787 3.274 2016_04 880 161,5 2.048 267 678 880 962 1.135 1.363 1.642 2.138 3.116 8.297 785 3.311 Corr. MW 0,334 0,195 0,319 0,885 0,549 0,340 0,416 0,334 0,283 0,190 0,137 0,518 0,248 Corr. GDP 0,531 0,080 0,327 - 0,169 0,198 0,442 0,278 0,477 0,531 0,493 0,617 0,239 0,605
17
half of incomes than in the second, while the association with the GDP tends to be a little higher for the second half of incomes. It is important to observe that because it works with logarithms of the variables, the coefficients of the model without differences represent an estimate for the respective elasticities. Therefore, it would be higher when the first half and the minimum wage (MW) variable are considered.
When the tenths of distribution are considered, the elasticities of the incomes in relation to the minimum wage (MW) are higher between the second and fourth tenth of income distribution, and lower for the highest levels. As for the GDP, the elasticities tend to be smaller than in relation to the minimum wage (MW), except in the two highest tenths of income.
In general, in the model in which differences of the variables are used, the values of the estimates are less significant. They present similar behaviors, but with smaller values for R2.
Table 3.5 – Econometric Results for the Estimation of the Regression Models
Source: Elaborated by the authors.
In summary, the results of the regressions highlight the important role represented by the minimum wage (MW) during the 2012/2014 period in the formation of labor incomes for the lowest income levels, indicating its continuing contribution in the improvement of income distribution during the 2012/2016 period.
Final Considerations
The five-year period analyzed in this study was very fertile from the investigative point of view, for it presented big transformations in the Brazilian labor market, with the alternation of a favorable period, with job and income growth, and a recent period marked by a strong deterioration in the labor market and an increase in unemployment.
The political and economic crisis which fell upon the country as of 2014 strongly impacted the Brazilian labor market, leading to a deterioration of its indicators, especially the unemployment rate, which reached extremely high levels at the end of 2016. The significant increase in the number of unemployed people has direct effects on the population’s living conditions, which depend more and more on the Brazilian network of social protection. Although it is not as ample as that seen in some developed countries, it provides a set of social benefits – such as unemployment insurance and social transfers – and universal services – such as health care – that mitigate the effects of the crisis on the population.
Estimate p-value Estimate p-value Estimate p-value Estimate p-value
1 0,486 0,757 0,002 0,408 0,016 0,003 0,267 0,340 0,024 0,225 0,289 0,390
2 0,631 0,408 0,003 0,452 0,000 0,000 0,365 0,244 0,008 0,272 0,038 0,210
Estimate p-value Estimate p-value Estimate p-value Estimate p-value
1 0,050 0,666 0,370 0,303 0,588 0,020 0,032 0,439 0,533 0,000 1,000 0,510 2 0,332 0,812 0,029 0,624 0,027 0,008 0,070 0,305 0,292 0,352 0,415 0,485 3 0,814 0,948 0,000 0,143 0,111 0,016 0,855 0,749 0,000 0,255 0,046 0,844 4 0,488 0,735 0,001 0,358 0,024 0,001 0,293 0,232 0,020 0,107 0,440 0,473 5 0,490 0,617 0,006 0,522 0,003 0,000 0,204 0,117 0,192 0,266 0,055 0,054 6 0,394 0,620 0,008 0,389 0,024 0,000 0,214 0,149 0,105 0,262 0,060 0,129 7 0,533 0,624 0,004 0,550 0,001 0,000 0,280 0,157 0,051 0,265 0,030 0,014 8 0,549 0,554 0,005 0,547 0,001 0,001 0,184 0,091 0,295 0,247 0,067 0,086 9 0,407 0,266 0,044 0,301 0,005 0,001 0,141 0,035 0,671 0,194 0,128 0,393 10 0,541 0,346 0,027 0,475 0,000 0,006 0,378 0,391 0,005 0,312 0,105 0,443 GDP DW DW Tenth
Logarithms Differences of the Logarithms
R2 MW GDP DW R2 MW
Half
Logarithms Differences of the Logarithms
R2 MW GDP DW R2 MW GDP
18
Although the increase in unemployment is worrisome, among those who remained employed the dynamic was a little different, that is, for those who were able to keep their jobs significant changes were not noted, whether in income, whose fall was not so pronounced, or in the inclusion of workers in employment with social protection. The first case is most likely due to the fact of unemployment having specifically reached the most vulnerable workers, with lower incomes, thus minimizing the drop in average income among the employed. In the case of the latter, an increase was seen in the share of own-account workers who contribute to social security, which changed a little the composition of the group of protected workers, with a small fall in the share of formal employees.
A similar behavior could be observed in the inequality indicators, which presented a different trend than that imagined in a moment of economic crisis, since its growth was expected when considering labor income. The correlations and regressions estimated in the paper showed that the fall in inequality in the Brazilian labor market is associated in part with the policy of increasing the minimum wage, which maintained the income gains of the lower tenths at higher levels than that observed for the higher tenths. In other words: even though there was a general fall in income, those who earn more lost more and those who earn less lost less, or even had gains if their income is in the minimum wage range. The maintenance of employment with social protection contributed to this process, since labor formalization is mainly related to jobs with formal contracts (formal employees), whose income is associated with the variation in the minimum wage.
The econometric results found indicates that the elasticities of lower incomes in relation to the minimum wage are much higher than those for the higher levels. Therefore, in a period in which the GDP fell, the continuity of the favorable trajectory of the minimum wage represented a protection against an occasional worsening of labor income distribution, which continued a favorable trend at least until mid-2016.
In summary, the dynamics of the Brazilian labor market in the past fifteen years reveals the importance of public and social policies for the protection of the population as a whole. Since crises are periodic and often inevitable, the aforementioned policies have an important role in guaranteeing that, after periods of prosperity in the labor market – like that seen between 2004 and 2014 –, the living conditions of workers are maintained, even for those who lose their jobs. For those who remained employed, the object of this study, policies like that of increasing the minimum wage fulfilled the function of minimizing the losses in income established by the crisis, in addition to guaranteeing to the worker a standard of living that most likely would not be the same if defined exclusively by the market.
References
AMITRANO, C. R. Considerações sobre o mercado de trabalho no Brasil. In: Vanessa Petrelli Corrêa (org.). Padrão de acumulação e desenvolvimento brasileiro. São Paulo, Fundação Perseu Abramo, 2013.
AUTOR, D.; KATZ, L.; KEARNEY, M. Trends in U. S. wage inequality: revising the revisionists. The Review of Economics and Statistics, v. 90, n. 2, p. 300-323. May 2008.
BALTAR, P. E.; LEONE, E. T. O mercado de trabalho no Brasil nos anos 2000. Carta Social do
Trabalho, n. 19, Julho a Setembro. Campinas: IE/Unicamp, 2012.
BOSCH, M.; MANACORDA, M. Minimum Wages and Earnings Inequality in Urban Mexico. American Economic Journal: Applied Economics, v. 2, n. 4, p.128-149, October 2010.
BRITO, A. S. O papel do salário mínimo na redução da desigualdade da distribuição de renda no Brasil entre 1995 e 2013. Tese (Doutorado em Economia). Niterói: UFF, 2015.
19
BUTCHER, T.; DICKENS, R.; MANNING, A. Minimum wages and wage inequality: some theory and an application to the UK. CEP DP n. 1177, November 2012.
CODACE. Comitê de Datação de Ciclos Ecoômicos. Rio de Janeiro: Agosto de 2015. Disponível em: file:///C:/Users/andre.simoes/Downloads/Comite%20de%20Datacao%20de%20Ciclos%20Economico s%20-%20Comunicado%20de%204_8_2015%20(2).pdf . Acesso em: 3 de Dezembro de 2016.
COBHAM, A. Palma vs Gini: measuring post-2015 inequality. London: Center for Global Development - CGD, 2013. Disponível em: http://www.cgdev.org/blog/palma-vs-ginimeasuring- post-2015-inequality . Acesso em: out. 2016.
DIEESE. Balanço das negociações dos reajustes salariais de 2015. Estudos e Pesquisas, nº 80. São Paulo: Dieese, abril/2016.
DOLTON, P.; ROSAZZA-BONDIBENE, C.; WADSWORTH, J. Employment, inequality and the UK national minimum wage over the medium-term. IZA Discussion Paper n. 5278, October 2010.
FIRPO, S.; REIS, M. O salário mínimo e a queda recente da desigualdade no Brasil. In: BARROS, R. P.; FOGUEL, M.; ULYSSEA, G. (Org.). Desigualdade de renda no Brasil: uma análise da queda recente. V. 2, cap. 33. Brasília: IPEA, 2007.
HOFFMANN, R. A desigualdade relevante não caiu de 2014 a 2015. Disponível em: http://iepecdg.com.br/wp-content/uploads/2016/12/RH2015B.pdf Acesso em 16 de janeiro de 2017. IBGE. Síntese de indicadores sociais: uma análise das condições de vida da população brasileira.
Coordenação de População e Indicadores Sociais. - Rio de Janeiro: IBGE, 2015. IBGE. Sistema de Contas Nacionais – Brasil 2010-2014. Rio de Janeiro: IBGE, 2016.
KREIN et al. Trabalho no governo Lula: avanços e contradições. Revista ABET v. X - n. 2 - Jul./Dez. 2011.
LEE, D. Wage inequality in the United States during the 1980s: rising dispersion or falling minimum wage? The Quarterly Journal of Economics, v. 114, n.3, p. 977-1023, August 1999.
MANNING, A. Minimum wage: maximum impact. Resolution Foundation, April 2012.
NEDER, H. D.; RIBEIRO, R. Os efeitos distributivos do salário mínimo no mercado de trabalho brasileiro no período 2002-2008: enfoque a partir de distribuições contrafactuais. Revista Pesquisa e Planejamento
Econômico (PPE), v.40, n.3, dezembro de 2010.
OIT. Resolucion sobre las estadisticas del trabajo, la ocupacion y la subutilizacion de la fuerza de trabajo. In: CONFERENCIA INTERNACIONAL DE ESTADISTICOS DEL TRABAJO, 19., 2013, Ginebra. Ginebra: Organizacion Internacional del Trabajo - OIT, 2013. Disponivel em: <http://www.ilo.org/global/statistics-anddatabases/meetings-and-events/international-conference-of-\-statisticians/19/ lang--es/index.htm>. Acesso em: ago. 2016.
PALMA, G. Homogeneous middles vs. heterogeneous tails, and the end of the ‘Inverted-U’: the share of the rich is what it’s all about. Cambridge Working Papers in Economics (CWPE), 2011.
SABOIA, J. O Salário Mínimo e seu Potencial para a Melhoria da Distribuição de Renda no Brasil. In: BARROS, R.P.; FOGUEL, M.N.; ULYSSEA, G. (Org). Desigualdade de Renda no Brasil: uma
análise da queda recente, vol II. Rio de Janeiro: IPEA, ago. 2007.
SABOIA, J. Baixo crescimento econômico e melhora do mercado de trabalho - Como entender a aparente contradição? Estudos Avançados, v. 28, n. 81, 2014
SABOIA, J. e HALLAK NETO, J. Salário Mínimo e Distribuição de Renda no Brasil a partir dos Anos 2000. Texto para Discussão, TD 002/2016. Instituto de Economia/UFRJ, 2016.
20
SABOIA, J.; HALLAK NETO, J.; SIMÕES, A.; DICK, P. Mercado de Trabalho e Distribuição de Renda no Crescimento e na Crise – Análise do Período 2001/2016. Texto para Discussão, TD 016/2017. Instituto de Economia/UFRJ, 2017.
SIMÕES, A. e DICK, P. Indicadores de Trabalho. In: Panorama Nacional e Internacional da
Produção de Indicadores Sociais. Simões, A; Fresneda, B (org). Rio de Janeiro: IBGE, 2016
Annex
KPSS Tests for the Evaluation of the Stationarity of the Series – Brazil - 2012/2016
Note: The KPSS test verifies the null hypothesis of stationarity of the series. A level of significance of 5% was used. Source: Elaborated by the authors.
p-amount Decision p-amount Decision p-amount Decision p-amount Decision
Total > 0,1 yes > 0,1 yes > 0,1 yes > 0,1 yes
D1 > 0,1 yes > 0,1 yes > 0,1 yes > 0,1 yes
D2 > 0,1 yes > 0,1 yes > 0,1 yes > 0,1 yes
D3 0,014 no > 0,1 yes 0,013 no > 0,1 yes
D4 0,021 no 0,079 yes 0,021 no 0,073 yes
D5 0,056 yes 0,070 yes 0,054 yes 0,064 yes
D6 0,023 no > 0,1 yes 0,023 no > 0,1 yes
D7 0,065 yes 0,025 no 0,063 yes 0,023 no
D8 0,091 yes 0,050 yes 0,089 yes 0,047 no
D9 0,094 yes > 0,1 yes 0,093 yes > 0,1 yes
D10 > 0,1 yes > 0,1 yes > 0,1 yes > 0,1 yes
M1 0,045 no > 0,1 yes 0,043 no > 0,1 yes
M2 > 0,1 yes > 0,1 yes > 0,1 yes > 0,1 yes 0,045 no > 0,1 yes 0,046 no > 0,1 yes 0,058 yes > 0,1 yes 0,056 yes > 0,1 yes
Logarithm Difference of the log,
In co m e MW GDP
Scientific Coordinator : Xavier Oudin (oudin@ird.pdr.fr) Project Manager : Delia Visan (delia.visan@ird.fr)
Find more on www.nopoor.eu Visit us on Facebook, Twitter and LinkedIn