Subjective Return Expectations, Information and Stock Market
Participation: Evidence from France
Luc Arrondel
Paris School of Economics-Banque de France
Hector Calvo-Pardo University of Southampton Derya Tas University of Southampton January 17, 2012 Abstract
Despite of its importance for the economy, stock ownership by households is poorly under-stood. Recent research has uncovered that expectations of stock market returns by individuals strongly correlate with stock ownership. This paper reports new …ndings from a survey that collected data on stock-market return expectations, individual information sets and stock own-ership, for a representative sample by age and wealth (’Mode de vie des Français’, TNS 2007). Individual information sets measure in probabilistic terms the beliefs that individuals hold about equity returns over the last …ve years. We …nd that (i) expected returns and information sets are very heterogeneous, hump-shaped in age, higher for males and increasing in wealth; (ii) stock ownership increases with the subjective conditional expectation of a positive return; and (iii) that information is costly acquired, sourced from social interactions, professionals, specialised media access, or own past experience, and is consistent with rational inattentiveness amongst optimists and income constrained respondents.
Keywords: Subjective Expectations, Information, Stock Market Participation, Household Finance
JEL Codes: D12, D8, G11
The authors thank Toke Aidt, Adeline Delavande, Antonio Cabrales, Chuck Manski, Andre Masson, Alessandro Mennuni, Xisco Oliver and Jian Tong for their various comments, and seminar audiences at the 2nd. Dauphine Workshop on Economic Theory "Recent Advances on the Role of Beliefs in Decision Theory", Nottingham University, PSE (Economie et Psychologie), the RES 2011 annual meeting, and at the University of Cambridge. The …rst author gratefully acknowledges …nancial support from the "Agence Nationale pour la Recherche" (ANR), and the second from the ESRC (RES-061-25-0327). The second author would also like to thank Toke Aidt for his hospitality at the Unviersity of Cambridge, where this piece was written.
1
Introduction
Prior to the 2008 …nancial crisis, nonparticipation in risky asset markets was awarded the status of ‘…nancial mistake’, with potentially large consequences for equilibrium asset prices and the equity
premium.1 The ’nonparticipation’puzzle uncovers the fact that a signi…cant fraction of households
hold no risky assets despite of their historical excess average returns over riskless assets, or ’equity premium’ (Haliassos and Bertaut, 1995). To date, and since the educated and the wealthier are more likely to participate, transactions and information costs remain the most important quanti-tatively (Vissing-Jorgensen, 2002; Haliassos and Michaelides, 2003). But several questions remain, like the nonparticipation of the wealthiest, or the precise nature of information costs. Recently uncovered factors such as trust (Guiso et al., 2008), …nancial literacy (Lusardi, 2008), ’…nancial awareness’ (Guiso and Jappelli, 2005) or (time spent in acquiring) …nancial information (Guiso and Jappelli, 2006) are shaping our understanding of the nature and importance of …nancial in-formation costs. Here, rather than embracing non-standard behaviour, we attempt to directly measure individual-level information sets and examine empirically the extent to which they matter in explaining nonparticipation.
But the crisis, that has so far lead to the “Great Recession”, is also shaking the foundations of macro-economics (Hall, 2010). At the heart of the debate, is the role of expectations in state-of-the-art macro-economic models, and in particular, in their …nancial counterparts (Stiglitz, 2011). The standard practice has been to adopt the rational expectations paradigm, whereby households hold a (common) statistically correct unbiased view of the future. Rational expectations have a crucial advantage: rather than attempting the di¢ cult task of measuring expectations, they can be inferred from (past equilibrium) realizations. Because the stock market is a public non-manipulable event, under rational expectations di¤erences in household …nancial choices cannot be explained by di¤erences in what they expect, only by di¤erences in either what they want (preferences) or, in what they have (endowments) when participation is costly. Against this received wisdom, the importance of (heterogeneous) subjective expectations in …nancial markets has been ascertained from evidence gathered (i) in laboratory experiments (Hommes, 2011), (ii) from agent-based computational algorithms (Arthur, 2006), or (iii) from survey data (Pesaran and Weale, 2006), among others. We report evidence from survey data on households’ stock market return expectations collected right before the …nancial crisis.
An incipient strand of new research in survey expectations reviewed in Hurd (2009), uncovers that households’ expectations regarding the future evolution of the stock market are: (i) for the majority, no better than a 50-50 chance that the stock market index will go up in the year ahead, albeit (ii) extremely heterogeneous (Dominitz and Manski, 2007 and 2011); (iii) able to explain
1
The more so, the larger the fraction of the wealthiest risk-tolerant households that does not participate, since
the aggregate demand for risky assets disproportionately depends on them. And even amongst the wealthiest,
di¤erences in …nancial choices both at a point in time, and through the life-cycle (Dominitz and Manski, 2007; Hurd, van Rooij and Winter, 2011; Miniaci and Pastorello, 2010), and (iv) able to identify households’implicit risk preferences, when combined with data on …nancial choices (Kézdi and Willis, 2009). These novel contributions rest on the methodological corner stone put by Do-minitz and Manski (1997) and on Manski’s (2004) in‡uential article, who advocate for treating expectations as primitives of the model, and undertake probabilistic elicitation to obtain quantita-tive measures of individual expectations in surveys. So far, survey data has been exploited for (i) stock market investors only (Vissing-Jorgensen, 2004), for (ii) a speci…c population subgroup which includes non-stockholders (by age, Dominitz and Manski, 2007, 2011; Kézdi and Willis, 2009) and for (iii) a representative sample of the population by age and wealth (Hurd et al., 2011; Miniaci and Pastorello, 2010). Here, we exploit data from a new wave of the Taylor-Nelson Sofres French survey (TNS 2007), which contains information on attitudes, preferences, subjective expectations, individual information sets and socio-economic and demographic characteristics for a representative sample of 3,826 households, by age and wealth.
We contribute to this literature in three main directions: (i) methodologically, since we elicit probability densities instead of probability distributions and over a longer forecasting horizon (Pe-saran and Weale, 2006), (ii) quantitatively, since we exploit survey data from a representative sample by both age and wealth (Campbell, 2006), and (iii) for the …rst time, we elicit probabilisti-cally households’information sets. The latter is crucial, because "...little is known about what kind of information rational-expectations investors should learn. Since information learned determines which assets are invested in [...]" (Van Nieuwerburgh and Veldkamp, 2010). We …nd (i) less 50-50 percent responses to probability questions, possibly conveying absolute uncertainty, at the expense of (ii) more answers conveying absolute certainty, i.e. 0 (’no chance’) and 100 (’for sure’) type of answers; (iii) average …ve-year ahead probabilistic stock market forecasts appear hump-shaped in age, are higher for males and increase with total wealth, and (iv) increase with the probability of holding stocks but not with educational attainment. (v) Our measure of information, when aver-aged across individuals, is also hump-shaped in age (King and Leape, 1987), is higher for males, and increases with total wealth. Finally, (vi) the conditional cross-sectional average of …ve-year ahead probabilistic stock market forecasts also appears hump-shaped in age.
We adopt Dominitz and Manski’s (2007) methodology, and …nd that conditioning on risk pref-erences, endowments, constraints, inertial/delegation factors and information, subjective expecta-tions determine stock market participation (i) amongst the elderly, con…rming the robustness of Dominitz and Manski’s (2007) …ndings, and (ii) for all ages, but (iii) not amongst the young, for whom information appears instead crucial (King and Leape, 1987; Hurd, 2009). Our measure of information is consistent with information being costly acquired (Peress, 2004; Van Nieuwerburgh and Veldkamp, 2010), gathered from social interactions (Hong et al., 2004) and specialised me-dia (Cabrales and Gottardi, 2011), and increases with own’s past experience (’frequence of recent trades’). Optimists and income constrained respondents appear worse informed, consistent with rational inattention (Sims, 2003). However, it does not increase with the respondents’ own or
parents’ educational attainment, family background, total wealth or respondents’ preferences for either risk or time. Finally, (iv) the subjective expectations of the uninformed determine even more strongly stockownership. Hence, conditioning on what households know, subjective expectations determine actual choices, in line with elementary portfolio choice theory predictions (Arrow, 1965;
Merton, 1969; Samuelson, 1969).2
The rest of the paper is organized as follows: in section 2 we describe the methodology used to elicit expectations and individual information sets, and construct measures of expectations similar to Dominitz and Manski (2007) to assess the quality of our data against the 2004 wave of the Health and Retirement Study (HRS 2004), which contains a much larger sample of households. In section 3 we describe the TNS 2007 data set and provide descriptive statistics. Section 4 reports the main empirical results on stock market participation, and section 5 concludes.
2
Measuring Expectations and Information
2.1 Survey Design
In surveys, respondents are asked to state their perception of a future event in order to understand if it determines their current behaviour. The recent literature on measuring expectations privileges the use of probability questions rather than eliciting point expectations or the traditional qualitative approach of attitudinal research (Manski, 2004). Answers to such questions are used to understand if expectations and outcomes are related, and to evaluate if individual behaviour changes in response to changes in expectations. Dominitz and Manski (2007) elicit individuals’ expectations of stock market returns inquiring about how ‘well’ the respondent thinks the economy will do in the year ahead (Positive Nominal Return, PNR). They exploit data for a representative sample of the elderly from the 2004 wave of the U.S. Health and Retirement Study (HRS).
To validate our dataset, we build upon their work using a similar methodology, and extend it along di¤erent dimensions. First, by extending the forecasting horizon to …ve years, we intend to untie expectational answers from the bussiness-cycle conditions prevailing at the time of the survey (March 2007) to better capture (i) the historic average upward trend of the stock market index, and (ii) inertia in portfolio management (Bilias et al., 2010). The latter is important since it remains an open question with which horizon households invest in the stock market. Second, following the methodology of the Survey on Household Income and Wealth (SHIW) conducted by the Bank of Italy (Guiso et al., 1996), probability densities are elicited on seven points of the outcome space, instead of just two points of the cumulative distribution functions (cdfs.), to obtain more precise individual estimates of the relevant moments. Third, we exploit data from a representative sample by age, to examine the relationship between age-portfolio pro…les and subjective expectations at the extensive margin. Finally and most importantly, probabilistic elicitation of recent past stock market performance (past Positive Nominal Return, pPNR) provides a quantitative measure of households’
2
Here we abstract from non-expected utility models (e.g. Dow and Werlang, 1992), and focus only on the consis-tency of household choices whithin an expected utility framework.
degree of awareness regarding their investment opportunity set, to capture: (i) di¤erences in in-formation across households, and (ii) the relationship between inin-formation and expectations (Van Nieuwerburgh and Veldkamp, 2010). Without it, households who do not invest because they ex-pect the stock market to burst over the given forecasting horizon are indistinguishable from those who do not invest because they are unaware of the investment opportunities available in the stock market.
The new wave of the Taylor-Nelson Sofres French survey (TNS 2007) was designed by researchers at the Paris School of Economics (PSE), and administered by Taylor-Nelson Sofres, a professional agency paid with research funds from the Agence Nationale pour la Recherche (ANR). The …rst wave, carried in 2002, had no questions related to stock market expectations. The 2007 wave contains very detailed information on attitudes, preferences and expectations, in addition to wealth, income and socio-economic and demographic characteristics for a representative sample of French households. A questionnaire was sent to a representative sample of 4,000 individuals, corresponding to an equivalent number of households. Respondents had to …ll the questionnaire, and return it
by the post in exchange of around e25 in coupon-tickets (bons-d’achat ).3 3,826 respondents sent
their questionnaires back, representing a 97% response rate.
The survey was conducted in March 2007. Figure 1 below shows that after a drop of nearly 60% in the French stock market Index (CAC-40) caused by the ’dot-com crash’of 2001, by the time the survey was conducted, the stock market index had been steadily recovering since the mid 2002. In March 2007 the index was still below its ’dot-com’ peak. Hence, it is likely that respondents are particularly aware of the stock market evolution regarding the past, and provide very heterogeneous and uncertain answers regarding the stock market prospects for the …ve years to come, given the recent experience of a bust and a boom.
The density of nominal yearly (and 5-year rolling) log returns on the CAC-40 computed from monthly data between July 1987 and July 2011 is depicted in Figure 2, panel (a) (panel (b)). The
distribution has moments = 0:023 ( (5) = 0:108) and = 0:10 ( (5) = 0:19). The densities
depicted in Figure 2 can be thought as representing the subjective beliefs of those respondents who base them on the history of observed stock market index monthly closing values (and that are more
likely to form a rational expectation4):
2.2 Expectations
To measure expectations, we elicited households’subjective beliefs regarding the likely evolution of
the stock market index …ve years ahead in time, It+5; relative to March 2007, It; from the following
3
Within it, the survey contains a small sample of 798 households has a panel dimension, linking to the previous TNS-2002 survey (4,000 35-55 year-old households) and of 2,234 households linking to the new TNS-2009 (4,000 households). As well, a complementary experimental module which could voluntarily be …lled on-line (400 individuals corresponding to 400 households) in exchange of a variable remuneration (e5,000 shared in prizes in the form of lotteries) was introduced. Neither is exploited here.
4
In line with the literature on adaptive learning, summarized in Evans and Honkapohja (2001), where even if individuals are uncertain about the underlying structure of the economy, they may end up learning it in the limit from equilibrium realizations, under very general conditions.
t = (TNS - 2007 Survey time) CAC-40 = 5634 (30/03/2007) 6500 501.2 1051.3 1567.9 2060.8 2438.1 3075.7 3466.2 3982.2 4543.1 5065.2 5487.3 5960.1 7002.1 Aug 1987 June 198 8 July 1989 Aug 1990 June 199 1 May 1992 July 1993 Aug 1994 June 199 5 May 1996 July 1997 Aug 1998 June 199 9 May 2000 July 2001 Aug 2002 June 200 3 May 2004 July 2005 Aug 2006 June 200 7 May 2008 July 2009 Aug 2010 June 201 1
Figure 1: French Stock Market Index CAC-40 between July 1987 and July 2011. The survey was conducted
in March 2007. Source: Author’s own calculations from MSN Money hsitorical data.
Figure 2: Histogram of CAC-40 index log-returns, computed at 1-year (panel a) and 5-year (panel b) rolling
window frequencies. Source: Author’s own calculations using monthly data between July 1987 and July 2011, available online from MSN Money.
questions (translated wording):
C6. ’Five years from now, do you think that the stock market... -For each category write down the likelihood of occurrence assigning a value between 0 and 100. The sum of all your answers must be equal to 100-:
... will have increased by more than 25% ... will have increased by 10 to 25% ... will have increased by less than 10% ... will be the same
... will have decreased by less than 10% ... will have decreased by 10 to 25% ... will have decreased by more than 25%
C7b. ’In your opinion, if you expect the stock market to increase within the next 5 years, which would be the highest possible increase (as a percentage)?’
C8b. ’In your opinion, if you expect the stock market to decrease within the next 5 years, which would be the lowest possible decrease (as a percentage)?’
Question C6 inquires household i about the subjective relative likelihood of occurrence, pit+1;k,
of each of the seven alternative scenarios, k = 1; :::; 7. Each scenario represents a possible outcome
range for the percentage change in the index between t and t + 5, Rt+1(5) It+5It 1.5 Questions
C7b and C8b provide subjective upper and lower bounds for the percentage change, Rimaxand Rimin
respectively. The corresponding outcome ranges are:
Rt+12 8 < :[R i max; 0:25) | {z }; k=1 [0:25; 0:10] | {z }; k=2 (0:10; 0) | {z }; k=3 f0g |{z}; k=4 (0; 0:10) | {z }; k=5 [ 0:10; 0:25] | {z }; k=6 ( 0:25; Rimin] | {z }; k=7 9 = ; and households’subjective likelihoods are accordingly:
pit+1;k Pri[Rt+12 k] = Pri
It+5
It 1 2 k ; 8i
The four panels ((a) - (d)) in Figure 3 below illustrate how do elicited probability density functions look like for a small subset of individuals:
Out of the 3,826 sample respondents, around 63% (2,406) meaningfully answered to the
ex-5We follow the standard convention in …nance for long-horizon returns, and let 1+R
t+1(s)denote the stock market
index gross return over s periods ahead (hence the subindex t + 1), which is equal to the product of the s single-period (or yearly) returns:
1 + Rt+1(s) = sQ1 f =0 (1 + Rt+1+f) = sQ1 f =0 It+1+f It+f
Similarly, we let 1 + Rt(s)denote the stock market index gross return over the most recent s periods from date t s
to date t (hence the subindex t):
1 + Rt(s) = sQ1 b=0 (1 + Rt b) = sQ1 b=0 It b It 1 b
Figure 3: Individual histograms of respondents’answers to survey question qc6 (PNR). Source: TNS 2007.
pectations question. 328 cases are excluded as the sum of their answers do not round up to 100.6
Figure 4 below depicts the histogram, which averages the individual probability density functions of those who answered. On average, households appear more pessimistic and uncertain than the historical record would predict (Figure 2b).
To validate our survey data, and for comparison purposes, we construct from respondents’ answers Dominitz and Manski’s (1997) Positive Nominal Return (PNR) variable which captures
the 5-year ahead percentage chance of a positive nominal return7:
8i : P NRi Pri[R t+1(5) > 0] = Pri h It+5 It 1 2 [ 3 k=1fkg i = pi t+1;1+ pit+1;2+ pit+1;3
Figure 5 below, depicts the frequency distribution of responses, for ages in the 50-80 age bracket (panel (a)) and for all ages (panel (b)). Despite of the age di¤erences, the similarities with both the
6Missing and erroneous answers are regressed against stockholding status, and a set of covariates (gender, marital
status, education, risk preference) using a probit (Table 11 in the appendix). They appear strongly related to
stockholding, just as Kézdi and Willis (2009) …nd for the HRS 2002 wave.
7
In Dominitz and Manski (2007), 15,166 HRS respondents, aged 50 to 80 in 2004, were asked:
Positive Nominal Return (PNR): We are interested in how well you think the economy will do in the next year. By next year at this time, what is the percent chance that mutual fund shares invested in blue chip stocks like those in the Dow Jones Industrial Average will be worth more than they are today?
8i : P N Ri DM Pri hI t+1 It 1 2 [ 3 k=1fkg i
0 10 20 30 40 L ik el ih oo d o f E ac h S c en ari o [-Tmin%, -25%) [-25%, -10%] (-10%, 0%) [0%] (0%, +10%) [+10%, +25%] (+25%, +Tmax%]
Answer to the Expected Stock Market Performance Question (Whole Sample)
Figure 4: Histogram of average individual answers to the likelihood of the di¤erent scenarios regarding
5-year ahead stock market performance. Source: TNS 2007 survey.
HRS and the De Nederlandsche Bank Household Survey (DHS), exploited by Hurd et al. (2011), are striking: there is similar bunching of responses around round numeric probability answers. For all ages, the mean response is 46.5%, while for the elderly, it is 47.1%. This compares with a 49% mean response, for the 50-80 HRS 2004 respondents, and with a 41.6% (50.1%) for a representative sample by age of the DHS 2004 (2006) respondents. However, bunching is much stronger in the {0,100} answers, than in the 50 percent chance response, indicating less epistemic uncertainty according to Bruine de Bruin et al. (2000). For all ages, 31% (21%) gave answers consistent with absolute certainty that the index would go down (up) over the coming 5 years. Evidence from the …nancial literature on long horizon returns suggests that the longer time horizon given to evaluate stock market performance might explain the di¤erences, because of mean-reversion (Campbell et al., 1997). In the next subsection we further examine this question.
Figure 5: PNR by age groups, frequency distribution. Source: TNS 2007.
Table 1 reports the distribution of responses and the response rate conditioning on age, gender, and marital and stockholding status. Consistent with the …ndings reported in Dominitz and Manski
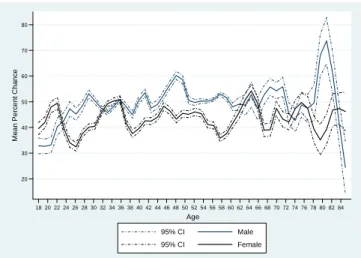
(2007), the mean percentage chance of a positive nominal return is higher for respondents who are married. The di¤erential is 1.4 percentage points for men (50.1% versus 48.7%), while for females, it is only 1.1 percentage points (43.7% versus 42.6%). Figure 6 shows that also in France, males are more optimistic than females. Even when conditioning on marital and stockholding status and for all age brackets, men give more optimistic reports than do women, and are 6-7 percentage points more likely to give a response.
20 30 40 50 60 70 80 Me an P er c en t Cha nc e 18 20 22 24 26 28 30 32 34 36 38 40 42 44 46 48 50 52 54 56 58 60 62 64 66 68 70 72 74 76 78 80 82 84 Age 95% CI Male 95% CI Female
Figure 6: Mean PNR by age and gender. Source: TNS 2007.
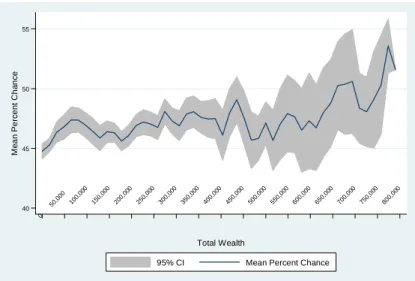
In line with the HRS 2002 …ndings by Kézdi and Willis (2009), expectations (noisily) increase with the respondent’s education and households’total wealth. Figure 7 (8) displays kernel-smoothed estimates of the mean percentage chance of a positive nominal return conditional on total wealth (educational attainement). The solid curve depicts point estimates and the grey area around it represents (bootstrap) 95% con…dence intervals. The median of total wealth is e118,792, and the 90th percentile e413,476. We excluded 42 households with wealth above e800,000. The richest households (with wealth above the 90th percentile), appear more optimistic regarding the future evolution of the stock market. An increase in wealth from the 10th to the 90th percentile, is estimated to increase the mean percentage chance of a positive nominal return by about 2 to 3 percentage points.
Figure 8 below compares by age, the mean percentage chance of a positive nominal return of respondents with some college education or more relative to those having at most completed high school. Broadly, the former seem to be slightly more optimistic than the latter, although both tend to become more optimistic regarding the future as they age.
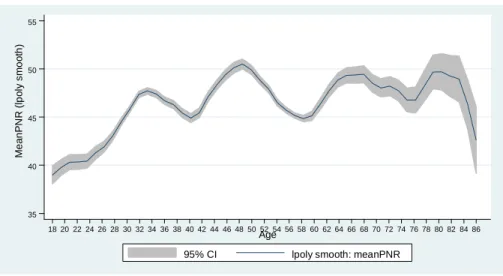
Finally, expectations of a positive nominal return appear roughly hump-shaped in age, as does the response rate to the probabilistic question. In Figure 9, the mean response increases until the late 40s, when expectations reach its peak, only to decline from the mid 60s, although the pattern is very noisy with potential cohort e¤ects present. The mean percentage chance of a positive nominal return is estimated to increase (fall) by about 8 to 12 (5 to 6) percentage points as age increases (decreases) from 20 to 50 (late 60s onwards).
T able 1: Exp ectations of p osi ti v e nominal return (PNR), b y attribute; TNS 2007 M a le F e m a le N u m b e r o f R a te o f N u m b e r o f R a te o f re sp o n d e n ts Q u a n ti le re sp o n se to re sp o n d e n ts Q u a n ti le re sp o n se to A tt ri b u te to P N R M e a n S t. D e v . 0 .2 5 0 .5 0 0 .7 5 P N R to P N R M e a n S t. D e v . 0 .2 5 0 .5 0 0 .7 5 P N R to P N R A ll R e sp o n d e n ts 1 ,1 6 9 4 9 .7 4 0 .2 0 5 0 9 5 0 .7 7 1 ,2 0 5 4 3 .2 3 9 .1 0 4 0 8 0 0 .6 6 M a rr ie d o r li v in g w it h a p a rt n e r N o 3 2 2 4 8 .7 3 8 .2 0 5 0 9 0 0 .7 6 4 7 1 4 2 .6 3 8 .9 0 4 0 8 0 0 .6 0 Y e s 8 4 7 5 0 .1 4 0 .9 0 5 0 9 7 0 .7 8 7 3 4 4 3 .7 3 9 .2 0 4 0 8 3 0 .7 2 A g e U n d e r 3 0 1 5 0 4 2 .6 3 6 .4 0 3 8 7 0 0 .7 1 1 9 3 4 0 .1 3 7 .1 0 3 5 7 5 0 .6 8 3 0 -3 9 2 4 2 4 7 .2 3 8 .3 0 5 0 8 0 0 .8 1 2 8 0 4 5 .4 3 8 .5 0 4 5 8 0 0 .7 5 4 0 -4 9 2 5 2 5 3 .7 4 0 .2 0 6 0 1 0 0 0 .8 1 2 3 6 4 3 .5 3 9 .0 0 4 0 8 2 0 .7 1 5 0 -5 9 2 4 0 5 1 .4 4 1 .1 0 5 8 1 0 0 0 .8 1 2 4 3 4 1 .5 3 9 .2 0 4 0 8 0 0 .6 8 6 0 -6 9 1 6 6 5 0 .1 4 2 .8 0 5 5 1 0 0 0 .7 7 1 4 5 4 5 .0 4 0 .1 0 4 5 9 0 0 .6 4 7 0 a n d o v e r 1 1 9 5 1 .6 4 2 .3 0 5 5 1 0 0 0 .6 8 1 0 8 4 4 .4 4 3 .1 0 4 0 9 8 0 .4 6 H o ld s st o ck s o r m u tu a l fu n d s N o 7 0 9 4 4 .0 4 0 .2 0 4 0 9 0 0 .7 1 7 7 7 3 9 .2 3 8 .8 0 3 0 7 5 0 .6 1 Y e s 4 6 0 5 8 .6 3 8 .6 2 0 7 0 1 0 0 0 .9 0 4 2 8 5 0 .5 3 8 .6 5 5 0 9 0 0 .8 1 N o te : S a m p le re st ri ct ed to th o se w it h o w n o r sp o u se / p a rt n er re p o rt o f w h et h er o r n o t h o u se h o ld h o ld s ‘s to ck s o r st o ck m u tu a l fu n d s’ .
40 45 50 Me an P er c en t Cha nc e 0 50,000 100,00 0 150,00 0 200,00 0 250,00 0 300,00 0 350,00 0 400,00 0 450,00 0 500,00 0 550,00 0 600,00 0 650,00 0 700,00 0 750,00 0 800,00 0 Total Wealth
95% CI Mean Percent Chance
Figure 7: Mean percentage chance of a positive nominal return over the next 5 years (PNR) by total wealth.
Source: TNS 2007. 30 35 40 45 50 55 60 Me an P er c en t C ha nc e 18 20 22 24 26 28 30 32 34 36 38 40 42 44 46 48 50 52 54 56 58 60 62 64 66 68 70 72 74 76 78 80 82 84 Age Educated Uneducated
Figure 8: Mean percentage chance of a positive nominal return over the next 5 years (PNR) by educational
35 40 45 50 55 Me an PN R ( lp ol y s mo oth ) 18 20 22 24 26 28 30 32 34 36 38 40 42 44 46 48 50 52 54 56 58 60 62 64 66 68 70 72 74 76 78 80 82 84 86 Age
95% CI lpoly smooth: meanPNR
Figure 9: Mean PNR, conditional on age. Source: TNS 2007.
Standard life-cycle portfolio choice models predict that, conditional on being aware of the exis-tence of a historical equity premium, the young should invest heavily in the stock market to take advantage and quickly accumulate wealth. The descriptive evidence reported here suggests that expectations vary systematically with age, and that both the young and the elderly appear partic-ularly pessimistic. Although the evidence is consistent with existing …ndings for the elderly in the US, in France the young appear pessimistic rather than optimistic (Dominitz and Manski, 2011).
2.3 Measuring Information
Another possibility is that the young are particularly unaware of the investment opportunities of-fered by the stock market (King and Leape, 1987; Hurd, 2009). Recent studies stress the importance of …nancial literacy (reviewed in Lusardi, 2008) when accounting for stock market participation decisions. Those studies ask general numeracy questions as well as speci…c questions regarding elementary notions about the working of …nancial markets. Here, we are more speci…c and inquire respondents about recent past stock market performance, in line with the …nance literature (e.g. Zhang, 2006).
To obtain a measure of how informed respondents were, we elicited probabilistically house-holds’ information sets, to capture: (i) di¤erences in information across households, and (ii) the relationship between information about the recent past, and answers to forward-looking probabil-ity questions (Dominitz and Manski, 2011). In addition, conditioning on information reduces the bunching around focal point responses conveying absolute certainty, i.e. P N R = f0; 100g.
In the TNS 2007, we inquired respondents about the likely evolution of the stock market index
over the past …ve years, It 5; relative to the time of the interview (March 2007), It; as follows
(translated wording):
C9. ’Over the past …ve years, do you think that the stock market... -For each category write down the likelihood of occurrence assigning a value between 0 and 100. The sum of all your answers must be equal to
100-:
... has increased by more than 25% ... has increased by 10 to 25% ... has increased by less than 10% ... has remained the same
... has decreased by less than 10% ... has decreased by 10 to 25% ... has decreased by more than 25%
Question C9 inquires household i about the subjective relative likelihood of occurrence, pit;k, of
each of the seven alternative scenarios, k = 1; :::; 7. Each scenario represents a possible outcome
range for the percentage change in the index between t 5 and t, Rt(5) ItIt5 1. Since ranges
k = 1 and k = 7 are unbounded, we set (Rmax; Rmin) to match observed values.The outcome ranges
for Rt are therefore identical to those of question C6 described above. Accordingly, households’
subjective likelihoods are given by:
pit;k Pri[Rt2 k] = Pri
It 5
It 1 2 k ; 8i
Five years prior to the time when the survey was conducted (March 2002), the stock market index was around half-way down the ’dot-com’bust. But, from the beginning of March 2002 (CAC 40 = 4688:02) until the beginning of March 2007 (CAC 40 = 5634:16), the index had increased an overall 20.2%. Figure 10 below illustrates the wanderings of the CAC-40 index between 1987 and 2011:
Figure 10: The French Stock Market Index CAC-40 between July 1987 and July 2011. Between March 2002
and March 2007 (5 years prior to the time of the survey) the index had increased by around 20%. Source: Author’s calculations from MSN Money monthly data, available online.
The panels (a) - (d) in Figure 11 below, illustrate how do individual information sets look like for the same small subset of individuals whose answers regarding future stock market performance
are depicted in Figure 3, panels.(a) - (d). Information regarding past stock market performance is elicited as a probability density function. According to Figure 10, a perfectly informed individual
should attribute probability one to the outcome range "...has increased by 10 to 25%" (k = 2);
higlighted in red below:
Figure 11: Individual histograms of responses to the survey question C9 (pPNR). Source: TNS 2007.
Out of the 3,826 sample respondents, around 59% (2,253) provided a meaningful answer to the information question. 322 cases are excluded as the sum of their answers do not round up to 100 [95,105]. Figure 12 below depicts histogram of the average of the individual probability density functions.
A striking …nding is that households are on average also pessimistic regarding how well has the stock market performed over the last …ve years. Although this might be due to imperfect recall given the unusually long horizon (although respondents were given enough time to access the internet or else, and report the correct response) it might also be related to the ’dot-com’bust being overweighted on respondents’memory (Hurd et al., 2011), even if outside the time frame given in the question. Table 2 below reports summary sample statistics for respondents’answers regarding past and future stock market returns, imposing a uniform distribution within the di¤erent outcome ranges. Although the big spread around the past sample average returns came as no surprise (possibly indicating ambiguity), it is remarquable that it remains smaller than the spread around the mean future stock market performance:
For consistency, we construct from respondents’ answers the past Positive Nominal Return (pPNR) variable which captures the percentage chance of a positive nominal return over the last
0 5 10 15 20 25 Li ke liho od of E a ch S ce na rio (-Rmin%, -25%) [-25%, -10%] (-10%, 0%) [0%] (0%, +10%) [+10%, +25%] (+25%, +Rmax%)
Figure 12: Histogram of average individual answers to the relative likelihood of the di¤erent scenarios
regarding the stock market performance over the last 5 years. Source: TNS 2007.
Table 2: Sample Moments from Questions QC6 (expected stock market performance) and QC9 (past stock market performance); TNS 2007.
Variable No obs. Mean Std. Dev. Min Max
Expected Return (ER) 2460 0.055311 0.112602 -0.625 1.125
Std. Dev. of ER 2460 0.068028 0.07347 0 0.43056
Past ER (pER) 2231 0.11938 0.139876 -0.375 0.375
…ve years: 8i : pP NRi Pri[R t(5) > 0] = Pri h It 5 It 1 2 [ 3 k=1fkg i = pi t;1+ pit;2+ pit;3
In Figure 13, we depict the frequency distribution of responses to pPNR for all ages. As previously, there is bunching of responses around round numeric probability answers indicating that rounding is not speci…c to forward looking questions but rather, to respondents rounding when confronted with the probabilistic elicitation format. For all ages, the mean response is 68%, while the true answer is a 100% chance of a positive nominal return over the last 5 years. Around 44% of sample respondents (990 individuals) gave the correct answer:
0 .05 .1 .15 .2 .25 .3 .35 .4 0 5 10 15 20 25 30 35 40 45 50 55 60 65 70 75 80 85 90 95 100 Percent Chance (Total Sample= 3826, Selected Sample=2253)
Figure 13: Percentage chance of a Positive Nominal Return over the past …ve years (pPNR) for all ages,
frequency distribution. Source: TNS 2007.
In Figure 14 we examine what type of information had those respondents who were absolutely certain regarding the future evolution of the stock market (panel (b), Figure 5). Panel (a) shows that amongst those who were absolutely certain that the stock market would go down (24%, 567 answered PNR=0%), around 35% were absolutely certain that it had not increased over the last 5 years, while 43% were absolutely certain that it had gone up. Around 5% gave a 50 percent chance of either going up or down. This contrasts with panel (b), for respondents who were absolutely certain that the stock market would go up (21%, 446 answered PNR=100%): 83% were absolutely certain that the stock market had gone up, while only 6% gave answers consistent with absolutely certainty of the stock market having gone down. Only 2% gave a 50 percent response. Hence, individual information about the past signi…cantly contributes to unbundle the bunching on responses conveying absolute certainty regarding the future, which are clearly wrong, and provides an additional source of heterogeneity amogst respondents.
T able 3: Distribution of Resp onses to P ast P ositiv e Nominal Return (pPNR), b y A ttribute; TNS 2007 M a le F e m a le N u m b e r o f R a te o f N u m b e r o f R a te o f re sp o n d e n ts Q u a n ti le re sp o n se to re sp o n d e n ts Q u a n ti le re sp o n se A tt ri b u te to p P N R M e a n S t. D e v . 0 .2 5 0 .5 0 0 .7 5 p P N R to p P N R M e a n S t. D e v . 0 .2 5 0 .5 0 0 .7 5 p P N R A ll R e sp o n d e n ts 1 ,0 2 4 7 4 .2 3 6 .2 5 0 1 0 0 1 0 0 0 .7 2 1 ,0 0 9 6 2 .8 3 8 .5 0 3 0 1 0 0 0 .8 8 M a rr ie d o r li v in g w it h a p a rt n e r N o 2 8 6 7 6 .8 3 4 .5 6 0 1 0 0 1 0 0 0 .9 5 3 8 6 5 9 .3 3 8 .6 2 5 7 0 1 0 0 0 .8 6 Y e s 7 3 8 7 3 .2 3 6 .9 5 0 1 0 0 1 0 0 0 .9 1 6 2 3 6 4 .9 3 8 .3 3 0 8 0 1 0 0 0 .8 7 A g e U n d e r 3 0 1 3 2 6 6 .6 3 6 .8 4 0 8 2 .5 1 0 0 0 .9 4 1 5 6 5 2 .5 3 8 .2 1 7 .5 5 0 9 0 0 .8 3 3 0 -3 9 2 1 5 6 6 .8 3 9 .3 3 0 8 0 1 0 0 0 .9 3 2 3 5 6 3 .1 3 8 .4 2 5 7 5 1 0 0 0 .8 7 4 0 -4 9 2 2 3 7 7 .9 3 3 .6 6 0 1 0 0 1 0 0 0 .9 3 2 0 8 6 5 .9 3 6 .7 4 0 8 0 1 0 0 0 .9 2 5 0 -5 9 2 1 9 7 4 .7 3 7 .2 5 0 1 0 0 1 0 0 0 .8 7 2 0 1 6 9 .3 3 9 .0 2 5 7 5 1 0 0 0 .9 4 6 0 -6 9 1 3 7 8 0 .2 3 3 .2 1 0 7 5 1 0 0 0 .8 9 1 2 3 6 8 .3 3 8 .6 3 0 9 0 1 0 0 0 .9 0 7 0 a n d o v e r 9 8 8 2 .9 3 1 .8 2 0 8 0 1 0 0 0 .8 7 8 4 6 7 .7 3 8 .7 4 2 .5 8 5 1 0 0 0 .8 3 H o ld s st o ck s o r m u tu a l fu n d s N o 6 0 4 6 8 .8 3 7 .5 4 5 9 0 1 0 0 0 .9 0 6 2 7 5 9 .4 3 8 .5 2 5 7 0 1 0 0 0 .8 5 Y e s 4 2 0 8 1 .9 3 2 .8 8 0 1 0 0 1 0 0 0 .9 6 3 8 0 6 8 .8 3 7 .6 4 2 .5 9 0 1 0 0 0 .9 3 N o te : S a m p le re st ri ct ed to th o se w it h o w n o r sp o u se / p a rt n er re p o rt o f w h et h er o r n o t h o u se h o ld h o ld s ‘s to ck s o r st o ck m u tu a l fu n d s’ .
Figure 14: pPNR conditional on PNR, for pessimists (a) and optimists (b), frequency distribution. Source: TNS 2007.
and stockholding status. Since over the …ve-year time frame given to respondents, the CAC 40 index
had increased by 20.2%, an informed respondent should have given an answer of pP N Ri = 100
percent. In accordance with the …ndings reported by Lusardi (2008) on the …nancial literacy of US adults, male respondents who are older, single and stockholders report higher mean (and lower standard deviations of) percentage chances of a past positive nominal return. The di¤erential is 11.4 percentage points higher for men than for women. Although information broadly increases with age, irrespective of gender, the uncertainty of the reports decrease with age for males, while for females, remains broadly constant. Stockholders report a higher mean by about 10 percentage points, and are around 6 percentage points more likely to give a response. Figure 15 shows that males are broadly better informed than females:
20 30 40 50 60 70 80 90 100 M ea n Pa st Po sitiv e No mina l Ch an ce (pPN R) 18 20 22 24 26 28 30 32 34 36 38 40 42 44 46 48 50 52 54 56 58 60 62 64 66 68 70 72 74 76 78 80 82 84 Age 95% CI Male 95% CI Female
Figure 15: Mean percentage chance of a positive nominal return over the last 5 years (pPNR) by age and
gender. Source: TNS 2007.
55 60 65 70 75 M ea n Pa st Po sitiv e No mina l Re turn (pPNR ) 18 20 22 24 26 28 30 32 34 36 38 40 42 44 46 48 50 52 54 56 58 60 62 64 66 68 70 72 74 76 78 80 82 84 Age 95% CI Mean pPNR
Figure 16: Mean percentage chance of a positive nominal return over the last 5 years (pPNR) by age.
Source: TNS 2007.
70s, and then decreases, although the point estimates are much noisier. Figure 16 presents kernel-smoothed estimates of the mean percentage chance of a past positive nominal return conditional on age. The mean percentage chance of a past positive nominal return is estimated to increase (fall) by about 20 to 22 (10 to 12) percentage points as age increases until (decreases after) 75. In line with King and Leape’s (1987) conjecture, …gure 16 suggests that respondents build an "informational
stock" slowly through the life-cycle, which depreciates by the end of it. This process of
life-cycle information accumulation may thus account for the identi…ed pessimism amongst the young and the elderly regarding the future performance of the stock market, providing support to Van Nieuwerburgh and Veldkamp’s (2010) basic interplay between expectations and information sets.
40 50 60 70 80 90 100 Me an P as t P os it ive Nom in al Ret u rn (m ea n p P NR ) 0 50,000 100,00 0 150,00 0 200,00 0 250,00 0 300,00 0 350,00 0 400,00 0 450,00 0 500,00 0 550,00 0 600,00 0 650,00 0 700,00 0 750,00 0 800,00 0 Total Wealth 95% CI Mean pPNR
Figure 17: Mean percentage chance of a positive nominal return over the last 5 years (pPNR) by wealth.
Source: TNS 2007.
remains roughly constant until the 90th percentile (e413,476), only to increase again albeit very heterogeneously. The richest households (with wealth above the 90th percentile), may thus be more optimistic (and disagree more) regarding the future investment opportunities because they
are better (and more heterogeneously) informed.8 Relative to non-participation amongst the richest,
and in line with Guiso and Jappelli (2005), heterogeneity in stock market information appears as a di¤erent alternative to social interactions (Hong et al., 2004; Guiso et al., 2008), better private investment opportunities (Heaton and Lucas, 2000) or taxation (Poterba, 2002).
40 50 60 70 80 90 M ea n Pa st Po si tiv e Re turn (p PN R) 18 20 22 24 26 28 30 32 34 36 38 40 42 44 46 48 50 52 54 56 58 60 62 64 66 68 70 72 74 76 78 80 82 84 Age Educated Uneducated
Figure 18: Mean percentage chance of a positive nominal return over the last 5 years (pPNR), by education.
Source: TNS 2007.
Surprisingly, information about past stock market performance does not increase with own’s educational attainement, although it broadly increases with age within educational groups (Fig-ure 18). Table 4 below reports estimation results of a two-way censored Tobit speci…cation for answers to question qc9 (censored below by ’0’ and above by ’100’), as a function of age, gen-der, sources of advice (friends, family, professional, broad media, specialised media) and informa-tion (TV, economics/…nance emissions), own and parents’ educainforma-tional attainment, family back-ground (middle/lower/other class), endowments (income and wealth), …nancial decision taking (no/partial/complete delegation of …nancial decisions), own past experience (’frequency of recent trades’), preferences (risk aversion and impatience), constraints in accessing information (’online banking’) or of inertia in information sources (parents’ stockownership status, ’cultural transmis-sion’), and of the tightness of households’budget constraint (’importance of money in life’).
Categorical answers to frequency, variety and access specialised media, advice from professionals, as well as the number of stock market transactions carried over the last year, increase the likelihood
of being informed.9 Interestingly, parents’stockownership status (’cultural transmission’), parents’
8
However, the increased heterogeneity in information for the richest might just be a small sample problem, since only 272 respondents answered to the information question.
9
infor-Table 4: The Determinants of Past Positive Nominal Return (pPNR); TNS 2007 (1) (2) (3) (4) (5) Male 23.73*** 21.91*** 22.28*** 19.57*** 17.72*** (3.631) (3.624) (3.618) (3.744) (3.782) Age 2.521*** 1.978*** 1.920*** 1.284* 1.267* (0.643) (0.65) (0.65) (0.690) (0.712) Age squared -0.0196*** -0.0146** -0.0132** -0.00840 -0.00849 (0.0065) (0.00652) (0.00656) (0.00683) (0.00702) Friends advice 9.551** 8.791** 9.175** 8.357* (4.427) (4.418) (4.431) (4.450) Professional advice 3.609 3.459 2.069 -0.419 (4.091) (4.079) (4.101) (4.178) Family advice -14.62*** -14.40*** -15.29*** -13.93*** (4.162) (4.15) (4.167) (4.204) Media advice 0.211 -0.469 0.150 -3.743 (5.251) (5.239) (5.223) (5.210)
Specialised media advice 19.81*** 18.55*** 16.09*** 11.01**
(5.194) (5.186) (5.191) (5.260)
Information from TV -8.264* -7.293 -7.192 -7.624*
(4.528) (4.52) (4.515) (4.507)
Information from economics emissions -1.52 -0.286 -1.373 -0.625
(4.03) (4.03) (4.025) (4.036)
Education (Ref. category: High school or less)
Less than college 8.047 4.086 -1.265
(6.329) (6.361) (6.473)
College or more 22.34*** 14.68** 6.443
(6.935) (7.172) (7.456)
Log (Income) 8.797*** 8.431***
(3.262) (3.265)
Log (Total wealth) 1.377 0.312
(1.269) (1.315)
Self account management 5.892 1.457
(3.654) (3.709)
Frequency of recent trades 13.97***
(2.349)
Risk aversion (CARA) 27.71
(22.68) Mother education (Ref. category: Less than secondary)
Secondary -2.140
(7.169)
Higher than secondary -1.731
(6.692) Father education (Ref. category: Less than secondary)
Secondary -0.404
(6.897)
Higher than secondary -3.839
(7.484)
Importance of money in life -4.548***
(1.065) Online banking 5.502 (4.643) Optimism -6.622* (3.684) Cultural transmission 0.495 (4.192) Temporal preference -0.818 (0.792) Constant 30.70** 44.63*** 32.50** -47.72 -8.927 (14.91) (15.47) (16.35) (29.68) (32.38) Log-likelihood -6530 -6507 -6499 -6530 -6507 No. of observations 2,253 2,253 2,253 2,200 2,133
educational attainment or family background (omitted from the table) do not increase the odds of being informed, and actually signi…cantly decreases them for those who follow ’family advice’. Since those who follow ’friends’ advice’ are more likely to be informed, we interpret it as being consistent with social interactions being instrumental in gathering information (Hong et al., 2004). On the other hand, a measure of optimism (’being lucky in life’) has a negative impact on being informed, indicating that an ’overcon…dence bias’is not present once gender is conditioned upon: although males appear better informed, supporting more optimistic forward looking expectations, optimists appear consistently worse informed. This may help reconciling Bilias et al.’s (2010) …ndings consistent with inertia in households’portfolios, with Guiso and Jappelli’s (2006) …dings consistent with excess trading even amongst the general population. We do not …nd evidence of either temporal or risk preferences determining information sets, in line with Van Nieuwerburgh and
Veldkamp (2010).10 Although total wealth does not increase the odds of being informed, income
does (even if we condition on the number of stock market operations carried over the last year), in
line with a costly information acquisition interpretation (Peress, 2004).11
Overall, these …ndings are consistent with …nancial information being slowly acquired through the life-cycle (King and Leape, 1987) from own past experience, from others (social interactions) and from specialised media. On the other hand, the negative e¤ect of the ’importance of money in life’, which scores higher the poorer and the more …nancially constrained the respondent is, reveals a novel aspect in information acquisition: disenfranchisement. Notice that the negative impact of both disenfranchisement and optimism is consistent with rational inattention theory (Sims, 2003).
3
Subjective Expectations, Information and Stock Market
Partic-ipation
An important puzzle in the literature is why so few households hold stocks (Haliassos and Bertaut, 1995). Although, in an expected utility framework, the standard two-risky asset model predicts that decision takers invest in the risky asset if and only if its expected return exceeds the return of the riskless asset (Arrow, 1965; Merton, 1969; Samuelson, 1969), only recently have researchers
started to collect data on subjective expectations of stock market returns.12 Accordingly, here
we examine the extent to which subjective expectations determine households’ stock ownership decision, conditioning on what they know.
mation is consistent with the existence of a market for …nancial information, where quality is priced, i.e. the vertical di¤erentiation component in Cabrales and Gottardi’s (2011) analysis.
1 0
Our measure of temporal preference is inversely proportional to "impatience", or how far-sighted the respon-dent is, rather than a preference for an early resolution of uncertainty. Hence, our results are consistent with Van Nieuwerburgh and Veldkamp (2010), who …nd that risk aversion does not determine the demand for information.
1 1
In unreported regressions, we estimated an ordered probit on the number of stock market operations carried over the previous year (grouped in 5 categories), and …nd evidence consistent with wealth and income increasing the number of trades, but also with liquidity and borrowing constraints forcing households to trade at the extensive margin. These results are available upon request.
1 2
In particular, the decision to invest in the stock market does not depend on either preferences, endowments or information about past stock market performance: just on the subjective expected return. Further details are provided in the elementary theory section of the appendix.
To obtain subjective expectations from answers to the probability question (PNR), Dominitz
and Manski (2007) show that if (i) stock market returns are normally distributed, with cdf. (:) :
P N Ri= Pri[Rt+1(5) > 0] = Pri Rt+1(5) i i > i i = 1 i i
and if (ii) a common variance is assumed, i = (for example, equal to the value obtained from
historical records), then:
i = 1 1 P N Ri
meaning that respondents reporting a higher percentage chance that the stock market will increase
over the next …ve years (P N Ri), have a higher subjective mean return expectation (
i), and should
then be more likely to invest in the stock market.13
To obtain a measure of stock ownership, question qc19 in the TNS 2007 inquires respondents about the di¤erent types of …nancial instruments and accounts they hold, and in particular whether they invest in the stock market either directly or indirectly. We de…ne direct stockholdings as the sum of stocks of privatised public companies, listed stocks of private companies and stocks of foreign …rms held. Indirect stockholdings are those held through mutual funds and managed investment
accounts.14 The proportion of households who hold stocks directly is 22%, and 37% either directly
or indirectly. Although low, the participation rates are slightly higher than those obtained from
previous past surveys15 and similar to the …gures reported by Haliassos (2008) for other countries
at that time. In Figure 19, stock market participation amongst respondents displays a clear hump-shaped pattern by age:
The literature on household …nance has found that those who are better educated, older and wealthier, are more likely to hold stocks. Dominitz and Manski (2007) reported that the proba-bility of holding stocks increased with the perceived chance of a positive return of investing in the
stock market amongst the elderly.16 Since subjective expectations have been found to
systemati-cally vary with risk preferences, information, and demographic and socio-economic characteristics, here we estimate the conditional e¤ ect of the percentage chance of a positive nominal return on stockholdings for a representative sample by age and wealth.
1 3
Since we inquire about a longer investment horizon, we exploited monthly data on the CAC 40 stock market index between July 1987 and July 2011 (230 observations) to compute the standard deviation of …ve-year log returns to be 0:19. When inserted into the above expression, the sample average percentage chance of a positive nominal return of
46percent (reported in the appendix, Table 11) corresponds to a sample mean expected return of 0:019; about …ve
times smaller than the historical mean of 0:108. A respondent reporting a value of P N Ri= 72percent, would match
the rational expectations prediction of 0:108.
1 4
We exclude both government bonds and homeownership from the risky asset category, even if the latter are highly illiquid and indivisible (and therefore risky), because French households mostly buy houses for the ‡ow of services they provide rather than as a …nancial investment. Still, in the estimation we control for the level of total net worth (real plus …nancial) and include a dummy variable that takes value one when home-ownership status is observed.
1 5
For the 35-55 year-olds corresponding subsample in the Patrimoine 1998 INSEE survey, the proportion of house-holds holding risky assets ’directly’is 21.6 and either directly or through mutual funds, 32.4.
1 6
Table 11 (Table 12) in the appendix shows a similar qualitative pattern emerges for the elderly (all ages) in the TNS 2007, consistent with their …ndings and theoretical predictions.
0 .005 .01 .015 .02 .025 .03 .035 D e ns ity 18192021222324252627282930313233343536373839404142434445464748495051525354555657585960616263646566676869707172737475767778798081828384858687 Age
Figure 19: The probability of holding stocks and stock mutual funds, by age. Source: TNS 2007.
Conditioning on individual information is important for both theoretical and empirical reasons. Theoretically, households form their expectations conditioning upon their individual information
sets, Ii. Although in the rational expectations tradition Ii would be much larger, here we proxy
it by the individual degree of knowledge of only the most recent stock market return realization
over the relevant horizon, Ii = fRt(5)g.17 Empirically, Dominitz and Manski (2011) conjecture that
di¤erences in the way people use public information may explain much of the observed heterogeneity
in subjective expectations, i. They …nd that "A plurality, but not a majority, of persons revise
their expectations in the direction predicted by the persistence model of behavioral …nance." The persistence model maintains that recent stock market performance will persist into the near future.
Our information measure pP N Ri precisely measures the extent to which respondents know about
recent past stock market performance.
We estimate households’ probability of holding stocks Pr( sit= 1 pit+1; pit; xi) as a function of
the percentage chance of a positive nominal return (pi
t+1 P N Ri), conditioning on information
(pit pP N Ri), and a vector of observables xi; which contains measures of time and risk
prefer-ence (discount factor, risk aversion), endowments (income and total wealth), household constraints (liquidity constraint, access to online banking), demographics (age, gender and marital status) and inertial factors (who takes …nancial decisions, stocks in pay or cultural tasnmission, which records whether the respondent’s parents are stock owners) which have been found in the literature to matter at the extensive margin:
Pr( sit= 1 pit+1; pit; xi) = ( t+1pit+1+ tpit+ 0xi) (1)
where (:) denotes the standard normal cumulative distribution function, since we assume that
1 7In the rational expectations tradition, Ii includes knowledge of the data generating process of stock market
return realizations, as well as of the true economic model compatible with such data generating process. Typically, it
is assumed to be Ii
= fRt(5); Rt 1(5); :::g = I; 8i: But see Guesnerie (1992) for a thorough analysis of the necessary
there is and unobserved error term et normally distributed. Table 11 in the appendix reports descriptive statistics for the main variables, for the whole and the selected samples.
The results of the probit estimation are reported in Table 5, for all ages. The variables have the
expected signs with minor di¤erences across columns18, con…rming the robust e¤ect of subjective
expectations on the probability of holding stocks. A 1 percent increase in the percentage chance of a positive nominal return (corresponds to an 10 percent increase in the sample expected return,i.e. from 1:9% to 2:1%) increases the probability of holding stocks by 0.001%, which corresponds to an
increase of 0:1% in the unconditional probability (from 37:5% to 37:6%).19 Notice that the
posi-tive e¤ect of information remains statistically signi…cant once heterogeneity in either preferences, decision taking or constraints is taken into account, but that when omitted (column 6), it biases upwards the estimated e¤ect of expectations on stockownership.
If capital markets are imperfect (transaction or informational costs) households’ income and
wealth in‡uences portfolio choice.20 The empirical analysis reveals that their e¤ect is best captured
by a second order polynomial, which facilitates the comparison with existing results in the literature (Guiso et al. (2003) or King and Leape (1998)). Total wealth has a positive e¤ect on participation and is signi…cant at the 1% level. An increase in total wealth from the …rst decile (6,300 euros) to the ninth decile (450,000 euros) increases the probability of participation by 9%. Income also increases the probability of participation in the stock market: moving from the …rst to the ninth decile increases the probability of stockownership by 13%. The e¤ects are consistent with …xed transaction and information costs of accessing the stock market, as well as of decreasing aversion to …nancial risk taking, since both capture households’initial endowments other than housing.
Although previous empirical studies also …nd that education increases the probability of par-ticipation, most of them interpret its e¤ect as a proxy for information. Since we have a very good direct measure of how informed respondents are regarding the stock market, holding a college de-gree (or further) does not signi…cantly increase the probability of participation, relative to those who hold only a high school diploma or less.
Management variables also appear important: although those who take …nancial decisions by themselves are less likely to participate relative to those who totally or partially delegate in a …nancial advisor, the e¤ect is not statistically signi…cant (but see Table 9 below). But those who manage their accounts online (online banking) are around 11 percent more likely to participate, and if respondents’ parents are stock owners themselves (’cultural transmission’), they are 16 percent more likely to own stocks. Since Table 4 reports that neither signi…cantly increases the odds of being informed, we interpret these e¤ects as inertial factors.
Also, measures of preference heterogeneity are important and consistent with recent economic
1 8Results in Table 3 only refer to direct and indirect stockownership. But the sign and magnitude of the reported
estimates are robust to changes in the de…nition of stockownership (only direct stockholders). They are also robust to a semi-log speci…cation in income and …nancial wealth.
1 9Although the e¤ect appears quantitatively small, it is not. See Hurd et al. (2011), Kezdi and Willis (2009) or
Arrondel et al. (2011) who, instead of working with the subjective probability of a positive nominal return (P N Ri),
introduce as regressors the …rst and second moments ( i;
i) of the individually elicited distributions.
2 0
Table 5: Probability of Holding Stocks or Stock Mutual Funds (All Ages); TNS 2007 ( 1 ) (2 ) (3 ) (4 ) ( 5 ) ( 6 ) P o s it ive n o m in a l re t u rn ( P N R ) 0 .0 0 1 8 7 * * * 0 .0 0 1 4 6 * * * 0 .0 0 1 3 9 * * * 0 .0 0 1 1 1 * * * 0 .0 0 0 9 1 1 * * * 0 .0 0 1 1 3 * * * ( 0 .0 0 0 2 5 3 ) (0 .0 0 0 2 9 9 ) (0 .0 0 0 3 0 1 ) ( 0 .0 0 0 3 1 0 ) (0 .0 0 0 3 1 6 ) ( 0 .0 0 0 2 6 7 ) M a le -0 .0 1 6 7 0 .0 0 1 0 8 -0 .0 0 0 2 8 8 -0 .0 1 7 7 0 .0 2 4 7 0 .0 1 1 0 ( 0 .0 2 0 2 ) (0 .0 2 2 3 ) ( 0 .0 2 2 4 ) (0 .0 2 4 1 ) (0 .0 2 4 7 ) ( 0 .0 2 2 4 ) M a rrie d / liv in g w it h a p a rt n e r 0 .0 4 1 2 * 0 .0 5 8 5 * * 0 .0 6 8 8 * * * -0 .0 1 8 2 -0 .0 1 6 2 -0 .0 3 0 4 ( 0 .0 2 1 9 ) (0 .0 2 3 8 ) ( 0 .0 2 3 9 ) (0 .0 2 6 7 ) (0 .0 2 7 3 ) ( 0 .0 2 4 9 ) A g e 0 .0 1 0 9 * * * 0 .0 0 7 1 1 * 0 .0 0 6 0 3 -0 .0 0 5 8 5 0 .0 0 0 2 8 3 0 .0 0 3 0 4 ( 0 .0 0 3 8 9 ) (0 .0 0 4 2 6 ) ( 0 .0 0 4 3 3 ) ( 0 .0 0 4 6 1 ) ( 0 .0 0 4 7 2 ) ( 0 .0 0 4 3 0 ) A g e s q u a re d -6 .2 3 e -0 5 -2 .1 0 e -0 5 1 .3 4 e -0 6 8 .6 4 e -0 5 * 3 .8 8 e -0 5 9 .9 0 e -0 6 ( 3 .8 8 e -0 5 ) ( 4 .2 5 e -0 5 ) ( 4 .3 4 e -0 5 ) ( 4 .5 9 e -0 5 ) ( 4 .6 8 e -0 5 ) (4 .2 6 e -0 5 ) P a s t p o s itive n o m in a l re tu rn (p P N R ) 0 .0 0 1 1 5 * * * 0 .0 0 1 0 5 * * * 0 .0 0 0 8 5 3 * * 0 .0 0 0 7 7 6 * * (0 .0 0 0 3 2 1 ) (0 .0 0 0 3 2 3 ) (0 .0 0 0 3 3 3 ) (0 .0 0 0 3 3 8 ) E du cation
(Ref. category: H igh school or less)
L e s s t h a n c o lle g e 0 .1 1 5 * * * 0 .0 4 5 0 0 .0 3 7 3 0 .0 3 3 4 ( 0 .0 3 9 6 ) (0 .0 4 1 7 ) (0 .0 4 2 2 ) (0 .0 3 7 7 ) C o lle g e o r m o re 0 .2 5 6 * * * 0 .1 1 3 * * 0 .0 7 6 8 0 .0 8 4 5 * ( 0 .0 4 3 8 ) (0 .0 4 8 4 ) (0 .0 4 9 2 ) (0 .0 4 4 9 ) In c o m e (1 0 E -6 ) 7 .2 0 4 * * * 5 .1 7 3 * * 5 .9 3 3 * * * ( 2 .3 0 0 ) ( 2 .4 5 3 ) (2 .2 1 1 ) In c o m e s q u a re d ( 1 0 E -1 1 ) -6 .7 6 0 * * -5 .6 0 0 * -5 .4 1 4 * ( 2 .9 8 9 ) ( 3 .1 5 4 ) (2 .8 1 3 ) To t a l w e a lt h (1 0 E -7 ) 1 2 .9 4 * * * 9 .3 5 5 * * * 9 .1 6 0 * * * ( 2 .0 3 5 ) ( 2 .0 9 9 ) (1 .9 0 7 ) To t a l w e a lt h s q u a re d (1 0 E -1 3 ) -7 .9 7 5 * * -5 .1 2 2 -4 .7 5 7 ( 3 .2 6 2 ) ( 3 .3 3 0 ) (3 .0 7 1 ) S e lf a c c o u nt m a n a g e m e nt -0 .0 0 7 1 1 -7 .0 6 e -0 5 ( 0 .0 2 3 7 ) ( 0 .0 2 1 8 ) R is k ave rs io n ( C A R A ) -0 .1 6 0 -0 .0 4 8 9 ( 0 .1 4 6 ) ( 0 .1 2 3 )
L iq u d ity c o n s tra int -0 .1 3 2 * * * -0 .1 2 6 * * *
( 0 .0 2 4 3 ) ( 0 .0 2 2 2 ) F irm s h a re s in re m u n e ra t io n 0 .0 8 4 6 0 .0 7 5 4 ( 0 .0 5 2 1 ) ( 0 .0 4 8 2 ) Te m p o ra l p re fe re n c e 0 .0 1 3 9 * * * 0 .0 1 3 2 * * * ( 0 .0 0 5 2 4 ) ( 0 .0 0 4 7 1 ) O n lin e b a n k in g 0 .1 1 2 * * * 0 .1 1 6 * * * ( 0 .0 2 8 8 ) ( 0 .0 2 6 9 ) Irre g u la r in c o m e ris k -0 .0 1 0 8 -0 .0 0 2 4 0 ( 0 .0 4 2 4 ) ( 0 .0 3 8 8 ) C u ltu ra l t ra n s m is s io n 0 .1 6 2 * * * 0 .1 5 4 * * * ( 0 .0 2 6 5 ) ( 0 .0 2 4 7 ) P s e u d o R -s q u a re d 0 .0 4 0 8 0 .0 4 7 2 0 .0 6 3 9 0 .1 1 9 1 0 .1 5 9 4 0 .1 6 2 8 C h i-s q u a re d 1 3 0 1 3 1 .0 1 7 7 .3 3 2 0 .0 4 2 8 .2 5 0 2 .0 L o g -like lih o o d -1 5 2 7 -1 3 2 1 -1 2 9 8 -1 1 8 3 -1 1 2 9 -1 2 9 0 N o o f o b s e rva tio n s 2 ,4 0 6 2 ,0 6 6 2 ,0 1 6 2 ,0 1 6 2 ,0 1 6 2 ,3 4 9
theory. Individuals who have a long planning horizon (temporal preference) are 1.4 percent more likely to participate than those who are impatient, in line with empirical results by Donkers and van Soest (1999) for The Netherlands. More risk averse individuals also have a lower probability of
par-ticipation, although the e¤ect is not statistically signi…cant.21 Overall, these e¤ects are consistent
with Van Nieuwerburgh and Veldkamp (2010), who model optimal information acquisition within the static two risky asset model in an expected utility framework. They …nd that at the extensive margin, temporal preference matters, since it determines the optimal amount of information, while risk aversion does not, because subjective stock market return expectations are formed conditional on respondents’individual information sets.
Constraints are very signi…cant, in line with existing empirical results in the literature. House-holds who have been liquidity constrained or who think that they will be so in the future are less likely to participate (around 14%). Deaton (1992) explains how the expectation of being liquidity constrained in the future leads prudent households to save more (’bu¤er stock’), which results in an overall reduction in stock ownership for those households whose preferences display both decreasing
risk aversion (DARA) and prudence (DAP) –Elmendorf and Kimball (2000).22 Although income
risk has a negative e¤ect on stock ownership, in line with theoretical predictions (and simulations)
that treat it as exogenous, the e¤ect is not statistically signi…cant.23
Finally, the age variables indicate that the probability of owning risky assets is lower for younger households, although it has a hump-shaped e¤ect reaching its maximum at the age of 50. In Tables 6 and 7 below, we decompose the e¤ect of expectations on stock market participation by age groups.
3.1 Robustness
In Table 6 we report the results of the estimation for respondents in the same age bracket (50-80) as those exploited by Dominitz and Manski (2007) from the HRS 2004. Two main messages emerge: (i) Dominitz and Manski’s (2007) results are robust to the inclusion of previously identi…ed covariates in the empirical literature of household …nance, like transaction costs (proxied by wealth), liquidity constraints, income risk, access to the internet or preferences. (ii) Subjective stock market return expectations of the elderly determine their …nancial investment decisions at the extensive margin. However, information regarding past stock market performance does not because, as Figure 16 illustrates, they are overall very well informed.
In Table 7, we complete the life-cycle picture and report the estimation results only for the young
2 1
The results are robust to an alternative measure of risk aversion: the coe¢ cient of relative risk aversion for preferences in the constant relative risk aversion class (CRRA), advanced by Barsky et al. (1997) and available in the TNS 2007 survey wave. In addition, Kimball et al. (2008) show that the CRRA measure is robust to survey measurement error. The results are available from the authors upon request.
2 2See also Gollier (2001), who proves that the willigness to take risk is reduced in the presence of a liquidity
constraint if absolute risk tolerance is increasing and convex in wealth.
2 3Tables 6 and 7 in the next subsection reveal that there is an age-composition e¤ect of income risk on stock
ownership: it has a negative and signi…cant e¤ect amongst the elderly (for whom it is either diversi…able or non-existent), while a positive non-signi…cant one amongst the young (for whom it is endogenous while non-diversi…able). See Arrondel and Calvo-Pardo (2011) for further details.
Table 6: Probability of Holding Stocks or Stock Mutual Funds (50 Age 80); TNS 2007 ( 1 ) (2 ) ( 3 ) (4 ) ( 5 ) (6 ) P o s it ive n o m in a l re t u rn ( P N R ) 0 .0 0 1 9 9 * * * 0 .0 0 1 7 9 * * * 0 .0 0 1 7 9 * * * 0 .0 0 1 4 4 * * * 0 .0 0 1 3 4 * * * 0 .0 0 1 3 5 * * * ( 0 .0 0 0 3 8 9 ) (0 .0 0 0 4 5 7 ) ( 0 .0 0 0 4 5 9 ) ( 0 .0 0 0 4 8 1 ) ( 0 .0 0 0 4 9 4 ) ( 0 .0 0 0 4 1 9 ) M a le 0 .0 2 3 2 0 .0 1 4 4 -8 .1 6 E -0 5 -0 .0 3 2 8 -0 .0 4 0 6 -0 .0 2 2 5 ( 0 .0 3 2 7 ) (0 .0 3 6 3 ) (0 .0 3 6 6 ) (0 .0 4 0 4 ) ( 0 .0 4 1 8 ) ( 0 .0 3 7 2 ) M a rrie d / liv in g w it h a p a rt n e r 0 .0 3 3 3 0 .0 5 4 2 0 .0 6 8 5 * -0 .0 1 1 7 -0 .0 1 0 9 -0 .0 3 6 8 ( 0 .0 3 5 6 ) (0 .0 3 9 3 ) (0 .0 3 9 6 ) (0 .0 4 4 1 ) ( 0 .0 4 5 5 ) ( 0 .0 4 0 8 ) A g e 0 .0 9 4 8 * * * 0 .0 7 5 8 * * 0 .0 8 4 0 * * 0 .0 6 4 7 * 0 .0 7 1 8 * 0 .0 9 1 7 * * * ( 0 .0 3 2 5 ) (0 .0 3 5 3 ) (0 .0 3 5 6 ) ( 0 .0 3 7 ) ( 0 .0 3 8 0 ) ( 0 .0 3 4 8 ) A g e s q u a re d -0 .0 0 0 7 2 4 * * * -0 .0 0 0 5 6 4 * * -0 .0 0 0 6 2 0 * * -0 .0 0 0 4 7 2 -0 .0 0 0 5 2 9 * -0 .0 0 0 6 9 2 * * ( 0 .0 0 0 2 5 7 ) (0 .0 0 0 2 7 9 ) ( 0 .0 0 0 2 8 2 ) ( 0 .0 0 0 2 9 2 ) ( 0 .0 0 0 3 0 0 ) ( 0 .0 0 0 2 7 4 ) P a s t p o s itive n o m in a l re tu rn (p P N R ) 0 .0 0 0 5 0 .0 0 0 5 0 7 0 .0 0 0 2 0 4 0 .0 0 0 3 2 2 (0 .0 0 0 5 0 3 ) ( 0 .0 0 0 5 0 5 ) ( 0 .0 0 0 5 3 8 ) ( 0 .0 0 0 5 4 4 ) E du cation
(Ref. category: H igh school or less)
L e s s t h a n c o lle g e 0 .1 3 5 * * * 0 .0 7 9 9 0 .0 7 4 6 0 .0 6 1 7 ( 0 .0 4 8 6 ) (0 .0 5 1 3 ) (0 .0 5 2 5 ) ( 0 .0 4 6 8 ) C o lle g e o r m o re 0 .2 0 4 * * * 0 .0 5 6 8 0 .0 3 8 0 0 .0 4 7 0 ( 0 .0 5 4 8 ) (0 .0 6 4 5 ) (0 .0 6 7 3 ) ( 0 .0 6 1 6 ) In c o m e (1 0 E -6 ) 8 .7 3 9 * * 5 .4 7 2 5 .9 3 2 ( 3 .9 0 5 ) ( 4 .1 4 9 ) ( 3 .8 0 8 ) In c o m e s q u a re d ( 1 0 E -1 1 ) -8 .9 4 2 * -6 .3 8 6 -6 .7 2 2 ( 5 .4 2 6 ) ( 5 .6 7 8 ) ( 5 .2 8 1 ) To t a l w e a lt h (1 0 E -7 ) 1 4 .6 2 * * * 1 2 .4 2 * * * 1 2 .1 7 * * * ( 3 .3 7 ) (3 .4 8 6 ) (3 .1 2 6 ) To t a l w e a lt h s q u a re d (1 0 E -1 3 ) -1 0 .7 3 * * -9 .6 5 9 * -9 .0 0 9 * ( 5 .0 4 8 ) ( 5 .1 9 4 ) ( 4 .7 6 2 ) S e lf a c c o u nt m a n a g e m e nt -0 .0 5 7 8 -0 .0 3 9 6 ( 0 .0 3 8 8 ) ( 0 .0 3 5 4 ) R is k ave rs io n ( C A R A ) -0 .0 3 1 9 0 .0 3 1 1 ( 0 .2 0 9 ) (0 .1 8 0 )
L iq u id ity c o n s tra int -0 .1 4 7 * * * -0 .1 3 2 * * *
( 0 .0 4 1 5 ) ( 0 .0 3 7 4 ) F irm s h a re s in re m u n e ra t io n -0 .0 2 1 9 0 .0 1 2 8 ( 0 .0 9 8 8 ) ( 0 .0 9 5 7 ) Te m p o ra l p re fe re n c e 0 .0 1 5 6 * 0 .0 1 5 6 * ( 0 .0 0 9 0 4 ) ( 0 .0 0 8 0 2 ) O n lin e b a n k in g 0 .1 7 8 * * * 0 .1 8 1 * * * ( 0 .0 5 1 4 ) ( 0 .0 4 8 6 ) Irre g u la r in c o m e ris k -0 .1 5 4 * -0 .1 5 7 * * ( 0 .0 8 3 7 ) ( 0 .0 7 4 1 ) C u ltu ra l t ra n s m is s io n 0 .1 8 2 * * * 0 .1 7 8 * * * ( 0 .0 4 4 5 ) (0 .0 4 1 6 ) P s e u d o R -s q u a re d 0 .0 2 9 7 0 .0 3 0 6 0 .0 4 2 0 .0 9 8 9 0 .1 4 3 8 0 .1 4 6 3 C h i-s q u a re d 4 0 .8 4 3 5 .8 8 4 9 .2 3 1 1 0 .9 1 6 1 .2 1 9 2 .3 L o g -like lih o o d -6 6 6 .9 -5 6 8 .1 -5 6 1 .4 -5 0 5 .1 -4 8 0 .0 -5 6 1 .0 N o o f O b s e rva t io n s 1 ,0 0 0 8 4 7 8 1 3 8 1 3 8 1 3 9 6 2