Science Arts & Métiers (SAM)
is an open access repository that collects the work of Arts et Métiers Institute of Technology researchers and makes it freely available over the web where possible.
This is an author-deposited version published in: https://sam.ensam.eu
Handle ID: .http://hdl.handle.net/10985/19141
To cite this version :
Rachel HORTA ARDUIN, Guilhem GRIMAUD, Jorge MARTÍNEZ LEAL, Stéphane POMPIDOU, Carole CHARBUILLET, Bertrand LARATTE, Thecle ALIX, Nicolas PERRY - Influence of scope definition in recycling rate calculation for European ewaste extended producer responsibility -Waste Management - Vol. 84, p.256-268 - 2019
Any correspondence concerning this service should be sent to the repository Administrator : archiveouverte@ensam.eu
1
Influence of Scope Definition in Recycling Rate Calculation for
European E-Waste Extended Producer Responsibility
Rachel Horta Arduin a*; Guilhem Grimaud a, b*; Jorge Martínez Leal a*; Stéphane Pompidou c;
Carole Charbuillet d; Bertrand Laratte a, e; Thecle Alix f and Nicolas Perry a
a Arts et Métiers, Université de Bordeaux, CNRS, Bordeaux INP, I2M Bordeaux, F-33405 Talence,
France
b MTB Recycling, F-38460 Trept, France
c Université de Bordeaux, CNRS, I2M Bordeaux, F-33400 Talence, France
d Institut Arts et Métiers Chambéry, F-73375 Le Bourget du Lac, France
e APESA-Innovation, F-40220 Tarnos, France
f Université de Bordeaux, IMS, CNRS, F-33400 Talence, France
*Authors have contributed equally. Corresponding authors: rachel.horta_arduin@ensam.eu; guilhem.grimaud@ensam.eu; jorge.martinez@ensam.eu.
Abstract
Efficiency indicators have been frequently used to assess end-of-life chain performance, mostly. In terms of the percentage of mass sent to re-use, recycling, and/or energy recovery facilities. While legislation gives a standard definition for recycling and recovery rates, stakeholders sometimes redefine them to better fit their own scopes and objectives. Therefore, to accurately interpret the results of an efficiency indicator, during a decision-making process, it’s necessary to fully understand the scope
2
definition used to calculate it. This work discusses the influence of scope definition when establishing performance rates. It does this by introducing further alternative scope definitions and comparing them to those defined by legislation and stakeholders. As a case study, the proposed complementary scopes are applied to the recycling chain of flat panel displays in France.
Keywords
End-of-Life Chain, E-Waste, WEEE Directive, Performance Indicators, Recycling Rate
Highlights
• E-waste recycling chain is especially complex, and many assessment scopes are used. • Indicators’ scope must be clearly stated to avoid misinterpretations.
• Indicators are proposed for a more suitable assessment for different stakeholders. • Data availability must be considered when suggesting a performance indicator. • Depending on the defined scope, the resulting recycling rates vary from 7 to 87%.
1 INTRODUCTION 1.1 General Context
The increase in world population and the individual search for better living conditions and comfort go hand in hand with an expansion of energy and raw material consumption (Schandl et al., 2015). As consumption continues to grow, annual waste production increases (Eurostat, 2018; OECD, 2015) and its composition becomes more complex as the years pass by (Zepf et al., 2014).
Waste Electrical and Electronic Equipment (WEEE), also known as e-waste, is one of the fastest growing waste streams and is a particularly complex one due to its material composition (Vadoudi et al., 2015). While it contains some high value materials such as gold, copper, nickel, rare earth elements, indium, palladium, etc. (Baxter et al., 2016; Tansel, 2017; Wang and Xu, 2014), it also includes some toxic
3
materials (mercury, lead, brominated flame retardants, etc.) which can cause environmental and health issues if not properly treated (Kiddee et al., 2013; Perkins et al., 2014; Rucevska et al., 2015).
In 2016, 44.7 million tons (Mt) of e-waste were generated in the world (Baldé et al., 2017). As presented in table 1, Europe is the second continent in e-waste generation, and accounts for the highest collection rate. Among other reasons, it can be explained by the directives, decisions and regulations developed for e-waste since 1990 (Román, 2012). Nonetheless, large amounts of WEEE are improperly or illegally collected and treated, and overall the level of collection is well below the amount of EEE exiting the market (Vidal-Legaz et al., 2016).
Table 1. E-waste generation and collection in 2016
Continents E-waste generation E-waste collection (%) Million tons (Mt) Percentage (%) Kg/inhabitant Africa 2.2 5 1.9 0 Americas 11.3 25.3 11.6 17 Asia 18.2 40.7 4.2 15 Europe 12.3 27.5 16.6 35 Oceania 0.7 1.6 17.3 6
Source: Baldé et al., 2017
Asia accounts for the highest e-waste generation (18.2 Mt), of which 40% were generated in China, followed by Japan (11.5%) and India (11%) (Baldé et al., 2017). Differently than the EU, in China and India, informal structures dominate WEEE collection. Japan has a legal situation analogous to the conditions in the EU to a certain extent, and after the EU it accounts for higher absolute volumes of e-waste
4
recycled. (Borthakur and Govind, 2017; Salhofer et al., 2016)
Africa generates the least amount of e-waste per inhabitant (1.9 kg/inh and 5% of world generation), and little information is available on its collection rate (Baldé et al., 2017). Together with cases in Asia, Africa was detected as one of the most common routes of illegal WEEE trade (Huisman et al., 2015).
Taking a closer look at the European context, it can be observed that the collection rates obtained vary considerably from one country to another (cf. figure 1). These disparities are also observed for the collected quantities: they range from 2.0 kg/inh/yr in Latvia, to 17.5 kg/inh/year in Sweden (Monier et al., 2014). These variations are explained by the wealth, the development stage of the collection schemes as well as the type of waste management system organization (Salhofer et al., 2016). It should also be noted that the denominator of the collection rate is based on estimations, and due to lack of harmonization across the Member States (MS), that entails high uncertainties for some countries (Baldé et al., 2017; Huisman et al., 2017).
5
The data gap shown on figure 1 includes both the informal sector and the illegal trade of e-waste. The significant concentration of the informal sector in some regions (e.g., Agbogbloshie, in Ghana), as well as little information available on WEEE collection rates, entails low global results on collection and proper treatment (20%) (Baldé et al., 2017). As previously mentioned, the results change significantly among EU countries – for example, the data gap represented 10% of WEEE generated in Sweden and 92% in Cyprus in 2012 (Huisman et al., 2015). There is an absence of more recent data estimating the percentage of non-compliant schemes in Europe.
WEEE has been identified as a lucrative business in both developed and developing countries due to its resource potential value (Sinha et al., 2016; Van Eygen et al., 2016). However, e-waste complexity, combined with the low concentration of the high value materials induces a high End-of-Life (EoL) treatment cost when carried out in compliance with all environmental and health standards (Schluep, 2014a). The e-waste EoL treatment chain is not taking off as the e-e-waste collection rate remains low (Huisman et al., 2015). As a consequence, recycled materials, in particular polymer resins, may be more expensive to treat than the equivalent raw materials (IEA, 2014).
1.2 European E-Waste Regulation Framework
As the paradigm shift towards a circular economy1 is primarily motivated by economic
considerations (Butterworth et al., 2013), authorities are willing to help with the transition. In the seventies, Europe launched the development of waste policies with the first Waste Framework Directive 75/442/EEC (European Commission, 1975). The
1 Global economic model that decouples economic growth and development from the consumption of finite
resources. It is restorative by design, and aims to keep products, components and materials at their highest utility and value, at all times (Ellen MacArthur Foundation, 2015).
6
process went on further and unfolded into several waste stream specific directives. In 1990, WEEE was selected as a Priority Waste Streams and in 2002, the European Parliament published the first WEEE specific directive (European Commission, 2003). It sets the Extended Producer Responsibility (EPR) system that imposes strict obligations for producers regarding waste management. Most Producer Responsibility Organization (PRO) schemes were introduced in 2005, following the European Directive (Monier et al., 2014). It aims to prevent the generation of e-waste and it promotes reuse, recycling, and other forms of recovery as a means:
i. to reduce the amount of e-waste that cannot be recovered ii. to improve circular economy
Further clarification on waste management policy and new regulations were implemented with the European Directive 2008/98/EC (European Commission, 2008). It defines the regulatory framework for the EPR system organization in Europe. Moreover, it specifies that recycling consists of “any recovery operation by which waste materials are reprocessed into products, materials or substances whether for the original or other purposes. It includes the reprocessing of organic material but does not include energy recovery and the reprocessing into materials that are to be used as fuels or for backfilling operations” (European Commission, 2012).
In 2012, the WEEE Directive was revised (European Commission, 2012) and several obligations and objectives for the MS were introduced. Among others, they had to report to the European Commission the achieved collection, reuse and recycling and recovery rates for all WEEE categories (European Commission, 2005). Table 2 presents the correlation between WEEE categories that came into force in August 2018 and the categories valid during the transitional period between August 2012 and August 2018. For each WEEE category, recovery and a recycling rate targets have
7
been set. These goals are valid for specific periods of time. In the case of screens, the target is 65% for the old categories III and IV and will be 70% for the new category II from 2019. The new collection and recycling targets set by the recast Directive represent a challenge for most MS (Monier et al., 2014). Even if collection and recycling rates are used to illustrate the EoL chain technical performance, key definitions regarding calculation scopes, as well as reporting modalities are not harmonized within the European countries. It is therefore important to properly define the recycling rate calculation method.
Table 2. E-waste categories according to WEEE Directive
WEEE categories
From August 12, 2012 to August 14, 2018
WEEE categories From August 15, 2018
Ia. Large household appliances cold I. Temperature exchange equipment
IIIa. IT Equipment and telecommunications IVa. Consumer equipment
II. Screens, monitors, and equipment containing screens having a surface greater than 100 cm2
V. Lighting equipment III. Lamps
Ib. Large household appliances non-cold IV. Large equipment (any external dimension
more than 50 cm) II. Small household appliances
IVb. Consumer equipment VI. Electrical and electronic tools VII. Toys, leisure and sports VIII. Medical devices
IX. Monitoring instruments and control X. Automatic dispensers
V. Small equipment (no external dimension more than 50 cm)
IIIb. IT and telecommunications equipment VII. Toys, leisure and sports
VI. Small IT and telecommunication equipment (no external dimension more than 50 cm) Source: Adapted from European Parliament, 2012
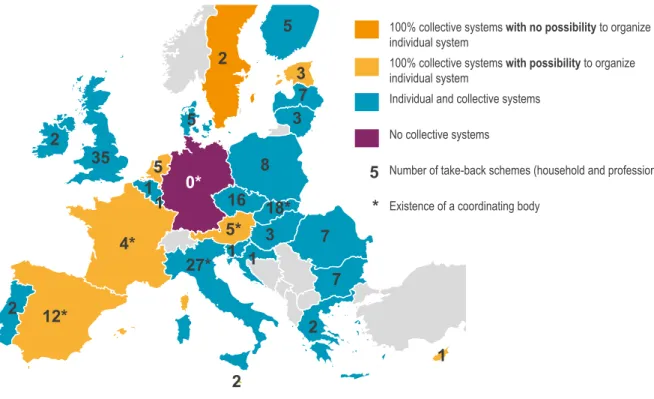
8 1.3 European WEEE Producer Responsibility Organization
Most of the European countries have chosen to transpose the WEEE Directive using a collective e-waste collection organization (cf. figure 2). For the PRO countries such as Denmark (household waste), Ireland, Sweden and United Kingdom have chosen financial responsibility with partial organizational responsibility. Whereas other countries such as Denmark (commercial and industrial wastes), Finland, France (household wastes), Latvia have chosen financial responsibility with full organizational responsibility.
Figure 2 Overview of the European household WEEE organization (Hestin et al., 2016)
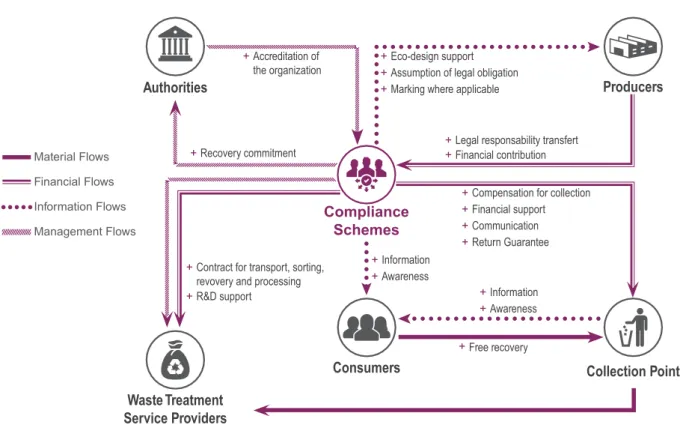
Indeed, the responsibilities assigned to producers of EEE led to the creation of compliance schemes, also known as take-back schemes (Monier et al., 2014). Compliance schemes, on behalf of their members, are the management bodies in charge of organizing the collection, recovery treatment and disposal of e-waste. Figure 3 illustrates the WEEE treatment system, which involves several stakeholders such as producers, distributors, compliance schemes, recyclers and local authorities.
9
Some countries, like France and Norway, differentiate between household and professional WEEE collection and treatment, while others, like Switzerland, report data without differentiation. (Román, 2012)
Figure 3. Representation of the compliance schemes system in collective WEEE treatment systems – (Adapted from ADEME, 2010)
WEEE Directive divides the different type of electric and electronic equipment that should be collected and treated in categories (see table 1). Nonetheless, WEEE collection and treatment is usually organized by the MS in waste streams. This organization may differ from one country to another, for example, in France it is organized in six waste streams: large household cooling appliances, large household appliances non-cold (except for cooling appliances), screens, other small appliances, lamps and photovoltaic panels (included in 2015) (Movilla, 2016). In Sweden, the organization is based on four waste streams: fridges and freezers, electrical and electronic goods, large white goods and straight fluorescent tubes (Román, 2012). Briefly, the countries exemplified, as well as other MS, cover the collection and
10
treatment of all WEEE categories listed in the Directive, but they aggregate the categories in different waste streams. It is relevant to note that the new WEEE categories in force since August 2018 (see table 2) are closer to waste streams adopted for WEEE collection and treatment.
In Europe the compliance schemes have setup various collection channels for e-waste, based on volumes, logistic costs and location of pre-processing. Municipal waste collection centers are the main collection channel for household WEEE in Europe. After collection, WEEE is transported to regrouping centers and then distributed to different waste treatment facilities, where it undergoes different operational steps (waste stream specific). Usually, operators are selected by a call for tenders. (Román, 2012; Vadoudi et al., 2015)
Currently, e-waste EoL chain performance assessment is limited to technical indicators that aim to ensure system compliance with collection and recovery targets set by legislation. In addition to collection and recovery rates, recycling rate is one of the main indicators for assessing the e-waste chain performance in Europe. (Eurostat, 2017)
1.4 WEEE Directive Recycling Rate Calculation Methodology
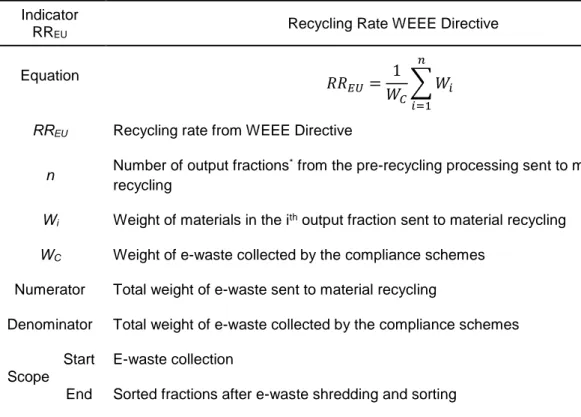
The second directive published in 2012 includes the concept of monitoring the EoL chain performances to tackle material efficiency objectives (Schluep, 2014b). Material efficiency is often understood as the technical ability to regenerate the material contained in waste. WEEE directive presents three technical indicators to monitor material efficiency objectives: collection rate, recycling rate and recovery rate. The Directive 2012/19/EU establishes that “the achievement of the recycling target (recycling rate) should be calculated, for each WEEE category, by dividing the e-waste
11
weight that enters the recycling facilities by the weight of all separately collected e-waste for each category, expressed as a percentage.” The related scope is named
RREU on figure 4. The WEEE Directive recycling rate is presented in table 3. It is important to note that since 2015 WEEE Directive targets have included recycling and reuse, so the rate reported by the Member States includes reuse. However, this work does not consider reuse share.
Table 3. Recycling Rate according to the WEEE Directive (RREU) Indicator
RREU Recycling Rate WEEE Directive
Equation 𝑅𝑅 𝐸𝑈= 1 𝑊𝐶 ∑ 𝑊𝑖 𝑛 𝑖=1
RREU Recycling rate from WEEE Directive
n Number of output fractions
* from the pre-recycling processing sent to material
recycling
Wi Weight of materials in the ith output fraction sent to material recycling
WC Weight of e-waste collected by the compliance schemes
Numerator Total weight of e-waste sent to material recycling
Denominator Total weight of e-waste collected by the compliance schemes
Scope
Start E-waste collection
End Sorted fractions after e-waste shredding and sorting
* The term output fractions refers to the different output flux generated during the material sorting process (e.g.,
metallic fractions, plastic fractions, etc.).
The scope defined by the Directive is focused on the treatment performance of the e-waste collected by the compliance schemes. Nonetheless, this method does not take into account the flows diverging from e-waste compliance schemes nor the losses occurring during recycling (Van Eygen et al., 2016). Moreover, the Directive sets recycling targets based on the overall weight of collected materials (Haupt et al., 2016).
12
It does not allow to assess the benefits achieved through recycling for the different materials: ferrous and non-ferrous metals, plastics, critical materials, etc.
According to the last report published by the French Environment and Energy Management Agency (ADEME), the recycling and recovery rate for all categories reached 88% in 2017. In France, all categories meet the recycling and recovery targets set by the Directive 2012. The compliance with the WEEE Directive’s recycling rate is achieved using RREU scope. (Deprouw et al., 2018, 2017; Monier et al., 2015)
Throughout the article, comparisons are made between the values obtained by this recycling rate and those obtained by the proposed auxiliary recycling rates. A comparison is therefore made as whether the proposed scopes comply with the WEEE Directive recycling rate or not.
1.5 Recycling Rate: Different Understanding Throughout the EoL Chain
This work discusses the importance of scope definition on EoL chain performance assessment and proposes additional scopes of evaluation. Indeed, today there is no consensus among the practitioners, neither on the limits of the EoL chain, nor on the scope and data to be used to calculate performance indicators. While definitions of the EoL treatment options (i.e., reuse and recycling) are clearly detailed in the waste framework directive 2008/98/EC (European Commission, 2008), none of the respective rates are properly set. The main problem is that the calculation scope is frequently adapted to fit the user needs. In other words, EoL chain stakeholders tend to choose a scope similar to their field of action when assessing performance indicators (EUROMETAUX and EUROFER, 2012).
Hence, communicating the calculation scope used in a study becomes essential as it directly affects the validity of the results. Indeed, misinterpreting the boundaries
13
can lead decision makers (e.g., EoL chain stakeholders, environmental agencies, product designers, etc.) to implement wrong strategies.
It is therefore essential to address this problem and to try to find a consensus and an understanding among practitioners. Indeed, product EoL chain performance indicators are very useful and powerful tools which enable the assessment of waste treatment scenarios during the development of new and more sustainable waste management strategies (Cifrian et al., 2015). They can also help translate information, or allow non-technical specialists the use of complex datasets (Bell and Morse, 2013). It is also possible to quantify and monitor the potential impacts of a selected waste stream, as well as the benefits of a specific EoL scenario (Manfredi and Goralczyk, 2013). In this context, several studies focusing on the development and/or use of indicators for analyzing EoL chain performance, have been published (Franklin-Johnson et al., 2016; Haupt et al., 2016; Nelen et al., 2014; Rigamonti et al., 2016; Van Eygen et al., 2016).
Performance indicators are already widely used in many fields to assess and compare products, companies, scenarios, etc. Authors of different fields have therefore studied performance indicators from a theoretical perspective, as well as proposed new indicators or frameworks to integrate a set of indicators (Del-Río-Ortega et al., 2013). In industrial accounting and management control for instance, performance indicators appear as a means of monitoring the complexity of organizations and mobilizing skills (Bouquin, 2011). In management sciences, performance is a multidimensional concept that may take in one of the following connotations: results, processes, and success (Diamantini et al., 2014). Regarding the results dimension, performance can be interpreted as the ex-post evaluation of the results (Bouquin, 2001) or of the achievement of organizational objectives (Bourguignon, 1995). In
14
practice, performance is often defined as the ratio of two or more significant measures of a process or a sector directly related to the system’s performance (Baird, 1986). In this article we only address the result dimension as we compare the different tools implemented to measure results; i.e., the technical evaluation of the EoL chain.
The Recycling Rate (RR) and the French e-waste chain are chosen to illustrate our study. It is important to note that the presented scopes and indicators are valid for any WEEE EPR in any other European country with individual and collective system (cf. figure 2). It is important to mention that while the proposed RRs could potentially be used by any treatment chain, the authors limit the range of applicability to the EPR compliance schemes as they are more organized than the informal systems and because it is mandatory for them to declare their performances (data availability). In addition, the proposed scopes could even be used in other waste streams governed by an EPR system such as lubricants, batteries and EoL vehicles (Monier et al., 2014).
The second section introduces complementary RR indicators, suggested by the authors, which seek to adjust to the needs of the different EoL chain players. To illustrate the variation of the proposed indicators, a case study on the Flat Panel Display (FPD) EoL treatment chain in France is presented in the third section. Conclusions and research limitations are addressed in the last section.
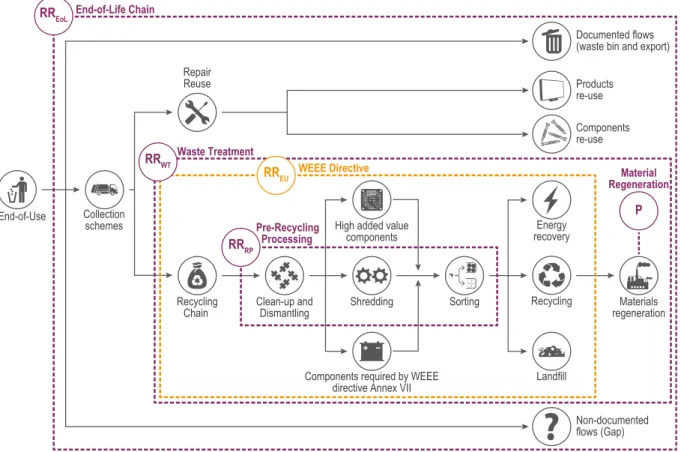
2 AUXILIARY RR SCOPES PROPOSITION
In addition to the RR indicator defined by the WEEE Directive, this paper presents four auxiliary recycling rate indicators. The first was found on the literature and the following three consist on mathematical formulations of measures already made by different EoL chain stakeholders. All these indicators were developed to calculate the performance of e-waste EoL chain from different assessment scopes. The associated outlines are
15
shown on figure 4. To better understand the auxiliary RR indicators and to be able to compare them, the calculation terms will be based on the ones used by the directive (cf. section 1.4). In other words, the output fractions Wi will be used as a reference
value for all auxiliary RR.
Figure 4. Representation of the WEEE end-of-life chain and the various recycling rate calculation scopes (Adapted from Horta Arduin et al., 2016)
2.1 Material Regeneration Rate
Recycling companies, such as UMICORE (Hagelüken, 2007), quite frequently have two main activities: the production of secondary raw materials and the preparation of these materials to be used in the industry. It is named material regeneration on figure 4. These stakeholders use an additional material efficiency rate to calculate the recovery performance of the materials obtained from e-waste, here named as “Material
16
Regeneration Rate (P)”. This assessment is important because it allows to link the EoL treatment to the production of new goods using recycled materials.
Since it is rather a material efficiency rate than a RR, this indicator is named differently than others discussed in this work. The P indicator is calculated internally on a gate-to-gate approach. The corresponding scope is named P (cf. figure 4). It is calculated by dividing the quantity of materials produced by the regeneration processes (excluding raw materials added during the recovery process), by the weight of the sorted fractions produced by the pre-recycling processes (cf. table 4).
Table 4. Material Regeneration Rate (P) (Hagelüken, 2007) Indicator
P Material Regeneration Rate
Equation 𝑃
𝑖=
𝑊𝑅𝑀− 𝑊𝑟𝑎𝑤 𝑊𝑖
i ith output fraction from the pre-recycling processing sent to material recycling
WRM Weight of materials in output fraction after material recovery
Wraw Weight of raw materials added during the material recovery processes
Wi Weight of materials in the ith output fraction sent to material recycling Numerator Total weight of materials recovered by the regeneration processes Denominator Weight of sorted fractions from pre-recycling processes
Scope
Start Pre-recycling processes sorted fractions supplying the regeneration plant End Regenerated materials
The material regeneration rate seeks to quantify the recovery process material efficiency (Cui and Zhang, 2008; Kaya, 2016). It is usually correlated with a raw material incorporation rate. This indicator helps the material regeneration companies by both quantifying material impurities in sorted fractions and determining the losses associated with the regeneration processes. Knowing the e-waste material
17
regeneration performance is essential for calculating EoL chain performance and e-waste treatment RRs. This information can be used to support policies seeking to optimize the recovery chain.
2.2 Pre-Recycling Pathway Recycling Rate
For recycling companies within the e-waste recycling chain, the RR calculation is based on a gate-to-gate approach. It is an internal performance indicator that helps quantify the pre-recycling processing performance. It is usually calculated concurrently with the purity rate indicator. Both are used by recycling companies to evaluate the financial gains of the recycling pathway (Grimaud et al., 2017). In this context, to calculate the recycling performance of the pre-recycling process, we suggest an indicator named “Pre-recycling Pathway Recycling Rate (RRRP)”. The corresponding
scope is named RRRP (cf. figure 4). This indicator is calculated by dividing the weight
of materials sorted from the pre-recycling pathway by the weight of e-waste entering the recycling plant (cf. table 5). RRRP is calculated for each material within a waste
stream.
The input weight of e-waste (Wupstream) used for the calculation of the pre-recycling
processing recycling rate (RRRP) differs from the one used for the RREU (according to
the WEEE Directive). In the case of RRRP, the Wupstream value is limited to a single
pre-recycling facility, whereas for the RREU, the value is given for all the recycling facilities
involved in the e-waste recycling chain. When calculating the RRRP, the downstream
performance of material recycling and regeneration is not considered. That is why no material efficiency rate (i.e., Pi) is used in the equation.
18
Table 5. Pre-Recycling Pathway Recycling Rate (RRRP) Indicator
RRRP Pre-Recycling Pathway Recycling Rate
Equation 𝑅𝑅 𝑅𝑃= 1 𝑊𝑢𝑝𝑠𝑡𝑟𝑒𝑎𝑚 ∑ 𝑊𝑖 𝑛 𝑖=1
n Number of output fractions from the pre-recycling processing sent to material
recovery
Wi Weight of materials in the ith output fraction sent to material recycling
Wupstream Input weight of the e-waste upstream flow at the pre-recycling facility
Numerator Total weight of materials sorted by the pre-recycling processing pathway Denominator Incoming e-waste to the recycling plant
Scope
Start E-waste supply to the waste treatment plant after the clean-up and the dismantling End Material recovery after sorting processes
The RRRP is specially adapted for assessing recycling processes to determine the
most efficient means to recycle a given product. Knowing the e-waste pre-recycling processing performance is very useful for recycling companies. For example, it can help to design a recycling pathway based on this performance (Grimaud et al., 2018).
2.3 Waste Treatment Recycling Rate
For some stakeholders, assessing treatment chain performance is very important. Indeed, this information is essential for product designers for example, when calculating the recyclability of their products, either as a part of an eco-design strategy or when verifying if they comply with legislation (Ardente and Mathieux, 2014; IEC, 2012; ISO, 2002; Martínez Leal et al., 2018). The “Waste Treatment Recycling Rate (RRWT)” calculates the aforementioned performance. The corresponding scope is
named RRWT on figure 4. The details of this indicator are shown in table 6.
The recycling rate is calculated by dividing the total weight of all recycled materials by the total weight of e-waste treated by the chain. In this scope, the amount
19
of recycled material is understood as the recycled material after regeneration. To obtain this value, the material regeneration rate P is used. This indicator is presented in the section 2.1 and some values are given in table 11. P mainly seeks to assess the degree by which e-waste materials are being recovered. Thus, the RRWT scope begins
with the e-waste that is going to be treated by the EoL chain (i.e., after collection), like the WEEE Directive recycling rate (RREU). In comparison, RREOL includes the whole
e-waste generated (obtained from the EEE placed on the market and the product lifespan). The RRWT scope considers material regeneration (also considered in RREOL),
unlike RREU scope which ends up just before the regeneration process.
Table 6. Waste Treatment Recycling Rate (RRWT) Indicator
RRWT Waste Treatment Recycling Rate
Equation 𝑅𝑅 𝑊𝑇 = 1 𝑊𝑇 ∑ 𝑊𝑖× 𝑃𝑖 𝑛 𝑖=1
n Number of output fractions from the pre-recycling processing sent to material
recycling
Wi Weight of materials in the ith output fraction sent to material recycling
Pi Material regeneration rate of the recycling facilities treating the ith output fraction
WT Weight of the total e-waste treated* by the EoL chain
Numerator Total weight of materials recycled by the EoL chain (considering the losses in material recycling)
Denominator Total weight of e-waste treated by the EoL chain
Scope
Start Collected e-waste that is going to be processed by the treatment chain End Recycled materials (output of material recycling)
* The quantity of e-waste treated is not the same as the quantity of e-waste collected as quite often these values
20 2.4 End-of-Life Chain Recycling Rate
Even though EoL chain recycling rates have been defined in many ways and for many life-cycle stages, this term remains somewhat non-specific (Haupt et al., 2016). According to the Eurostat database (Eurostat, 2017), e-waste recycling rate is the collection rate multiplied by the rate of recycling at the treatment facility. It is assumed that all the collected e-waste is in fact sent to the treatment/recycling facilities.
For Nelen et al. (2014), recycling performance must be calculated as the ratio of the amount of materials effectively recycled (excluding process losses) to the weight of the waste entering the recycling process.
Haupt et al. (2016) define the recycling rate as the ratio of recycled materials to the waste generated. They also specify that recycling rates should be calculated according to the type of recycling: open loop (materials are recycled into other types of products; it may result in producing new materials of lesser quality and reduced functionality) or closed loop (components or materials are used again to produce new products of the same type).
Data available to calculate the e-waste treatment performance must be considered when proposing indicators to assess EoL chain performance. Some approaches in scientific literature aiming to improve general knowledge of the EoL chain performance cannot be applied due to a lack of data to calculate the indicators (e.g., the specific composition of the input of the recycling process is unknown). In this context, to calculate the global recycling performance of the WEEE EoL chain, we suggest an indicator named “End-of-Life Chain Recycling Rate (RREOL)”. The
corresponding scope is named RREOL on figure 4. This indicator is the weight ratio of
materials effectively recycled and the total e-waste generated per WEEE category (cf. table 7).
21
Table 7. End-of-Life Chain Recycling Rate (RREOL) Indicator
RREOL End-of-Life Chain Recycling Rate
Equation 𝑅𝑅 𝐸𝑂𝐿= 1 𝑊𝐺∑ 𝑊𝑖× 𝑃𝑖 𝑛 𝑖=1
n Number of output fractions from the pre-recycling processing sent to material
recycling
Wi Weight of materials in the ith output fraction sent to material recycling
Pi Material regeneration rate of the recycling facilities treating the ith output fraction
WG Waste generated per WEEE category
Numerator Total weight of materials recycled by the EoL chain (considering the losses in material recycling)
Denominator Total weight of e-waste generated
Scope
Start E-waste generation
End Recycled materials (output of material recycling)
Waste generated is defined as the estimated amount of waste leaving the stock once discarded, taking into account the lifespan of electronic equipment (Huisman et al., 2017). It includes waste collected by the official compliance schemes, as well as those captured by complementary flows. The amount of waste generated in all European countries per WEEE category can be assessed in the Urban Mine Platform2
developed by the ProSUM project, as well as in the WEEE Tool3 published by the
European Commission. This data is closer to the reality as it considers equipment lifespan and not only the amount of WEEE placed on the market in the three previous years, which is the current approach to calculate collection and recycling rate.
Material regeneration rate data comes from recycling companies’ feedback
2 Urban Mine Platform: www.urbanmineplatform.eu
22
provided to compliance schemes. The reliability of this data is regularly questioned (Huisman et al., 2017), and its access is sometimes difficult due to confidentiality issues. Knowledge of the global performance of the WEEE EoL chain is useful mainly to compliance schemes and environmental agencies at a national level and can also be used to compare the performance of different countries.
3 FLAT PANEL DISPLAY TREATMENT CHAIN CASE STUDY 3.1 Presentation of the Case Study
In the previous sections, different definitions of recycling rates and the associated calculation methods were proposed. In this section, a case study is presented to illustrate the influence of scope definition in recycling rate assessment. The Flat Panel Displays (FPD) was selected as a case study. Since August 2018 this type of equipment belongs to new WEEE category II (cf. table 2). The FPD screens concentrate many materials: various plastics (ABS, PC, PS, HIPS, PMMA, etc.), ferrous and non-ferrous metals (aluminum, copper, etc.), Printed Circuit Boards (PCB) which contain various elements (lead, copper, silver, gold, etc.) and LED or neon backlights (glass, mercury and electric components).
To determine the average composition of an FPD show in table 8, study from the European Joint Research Center was used. More details for each subset element are given in table A.1 in appendix A, both the mass (expressed in grams and in the percentage of the product total mass) and the material composition are specified. This composition is highly variable depending on the manufacturer and the screen type. Moreover, this study does not identify the amount of Brominated Flame Retardants (BFR) contained in FPD plastics. That is why, these values are only used as a rough estimation of the before shredding material flow of the case study. (Talens Peiró et al.,
23
2016)
With exception of the material regeneration rate P, all the calculations are based on primary and secondary data. Considering that P is a material recovery efficiency measure in a gate-to-gate approach, we did not have access to the necessary information, instead data published in literature were used (Ardente et al., 2014; Graedel et al., 2011).
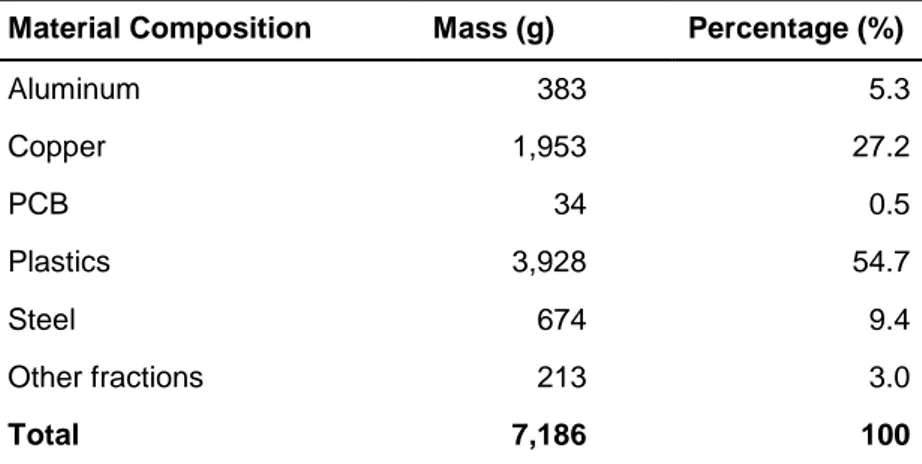
Table 8. Average composition of a flat panel display
Material Composition Mass (g) Percentage (%)
Aluminum 383 5.3 Copper 1,953 27.2 PCB 34 0.5 Plastics 3,928 54.7 Steel 674 9.4 Other fractions 213 3.0 Total 7,186 100
3.2 Flat Panel Display Screen’s Collection
The French e-waste EoL chain has been operational since 2005 for professional WEEE, and since 2006 for households WEEE. In France, the annual generation of WEEE is approximately 17 to 23 kg per inhabitant. In 2015, 158,739 tons of WEEE category II were generated in France approximately 2.4 kg/inh/yr. (Monier et al., 2016; Van Straalen et al., 2016)
Data related to collection and treatment used for the case study are specific to the French e-waste EoL chain for the year 2015 and are assumed to be representative for other collective WEEE collection systems (Monier et al., 2016). FPDs have their own recycling stream, so they are treated separately from other types of e-waste. The EoL chain starts from the e-waste generation (i.e. when the FPD screen is discarded
24
by its owner). Then, the e-waste may either be collected by compliance schemes, or follow an alternative flow as presented in figure 1.
As mentioned in Section 2.4, to calculate RREOL, the total waste generated in
2015 (158,739 t) and not just the amount collected by compliance schemes was considered (Van Straalen et al., 2016). In France WEEE are collected and treated by waste streams, and not by categories. Annually, the French compliance schemes perform characterization campaigns to estimate the amount of equipment per category collected through each waste stream. This data was used to calculate the amount of e-waste from category II collected (94,230 t, considering both household and professional WEEE). Nowadays, screen collection stream is mainly composed of Cathode Ray Tube (CRT) screens. The FPD screens are much lighter and still quite rare in the screens collection stream, even if they only represent about 40% of WEEE generated category II. According to the discussions with specialists in the field, we considered that FPD screens represent 10% of screens collected in 2015. Using this estimation, the FPD screen mass collected in 2015 was around 9,423 tons. Following the collection step by the compliance schemes, most of the e-waste is oriented towards the recycling chain. (Monier et al., 2016)
3.3 Flat Panel Display Recycling Chain
To calculate the RRRP and RRWT values, primary data from the dismantling, shredding
and fractions sorting from MTB Recycling company were used. MTB Recycling operates a pre-recycling pathway for FPD in France. The shredding and the mercury removal are made with the BLUBOX4 system. After the shredding, the mixed fraction
is sorted through various mechanical solutions such as magnetic separators, optical
25
sorting technologies, inductive sorting technologies, eddy current separators, magnetic ballistic separators, etc. The sorted material fractions are entitled “after sorting without
transfer coefficient” on figure 6. For the pre-recycling processing steps, we considered
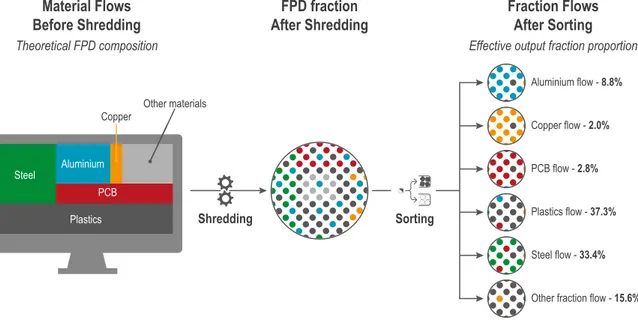
data from the FPD treatment chain of MTB Recycling in France. The composition is calculated based on a representative 80 tons batch of FPD recycled in 2015. The table 9 presents the mass balance of the sorted fractions after shredding and mechanical sorting. Their composition considers neither cross-contamination nor material mixtures that occur during the pre-recycling treatment. This means that each output fraction flow is pure even though there is contamination as shown on figure 5.
Table 9. Shredding and sorting performance – Mass Balance for one-year treatment (MTB, 2015)
Material Flows Mass (t) Percentage (%) Downstream operations
Aluminum 7.05 8.8 Material regeneration
Copper 1.57 2.0 Material regeneration
PCB 2.25 2.8 Material recovery
Plastics 29.77 37.3 Plastics sorting and recycling
Steel 26.65 33.4 Material regeneration
Other fractions 12.44 15.6 Landfill and energy recovery
Total 79.73 100
Scopes RRWT and RREOL, on the other hand, consider the losses in material
recycling and use the actual composition of the sorted fractions. To calculate the composition of the fraction, transfer coefficients are applied based on characterization assessment performed by MTB. Indeed, the mechanical separation is never perfect, and materials are found in mixture at the output streams of the pre-recycling processes. For example, aluminum-laminated plastics are mostly found in aluminum flow. Another example, metal screws are regularly embedded in plastic elements that pollute the ferrous metals output fraction flow. Figure 5 illustrates the sorting limitations and the mixture of the sorted fractions.
26
Figure 5. Visualization of the transfer coefficient matrix applies to the FPD recycling treatment chain
Using the data from the transfer coefficient matrix (table 10), it is possible to extrapolate on the flow composition of the shredded FPD so as to know the actual composition of the separate streams. The matrix of table 10 was carried out by the MTB team based on a manual sampling of each output fraction flow. Each line of the table shows the real composition of each sorted flow. For example, the aluminum output flow is composed of 88.09% of aluminum and 11.91% of other materials (mainly plastics, PCB and copper). There is therefore no creation of material but only the transfer of certain materials into another stream, which subsequently increases or decreases the proportion of a material during the recycling process.
Table 10. Transfer coefficient matrix – FPD shredding and sorting (MTB, 2015)
Material Flows Al Cu PCB Plastics Fe Other
Aluminum 88.09% 0.45% 3.54% 7.29% 0.00% 0.63% Copper 0.00% 85.00% 0.00% 10.00% 0.00% 5.00% PCB 0.22% 0.11% 93.10% 6.57% 0.00% 0.00% Plastics 12.09% 2.83% 3.41% 77.17% 1.23% 3.27% Steel 0.00% 1.39% 13.76% 16.78% 65.89% 2.18% Other fractions 0.00% 6.26% 2.87% 90.87% 0.00% 0.00%
27
Lastly, both RRWT and RREOL, consider the material regeneration rate of each
material Pi using the data presented in table 11. It is important to note that the data in
the different columns of figure 6 do not come from the exact same batch of FPD screens. However, this is to show a trend to explain the variations in recycling rate values.
Table 11. Material regeneration rates and associated reference
Material Regeneration rate Reference
Aluminum 98% Chancerel and Marwede, 2016
Copper 70% Chancerel and Marwede, 2016
PCB Average 87% Ardente and Mathieux, 2012
Plastics 98% Chancerel and Marwede, 2016
Steel 82% Chancerel and Marwede, 2016
3.4 Case Study Results
Material flow data at different steps of the recycling process are presented in table 12. The proposed recycling rates can be calculated from these values. The EoL screen flow represents a broad period sample, so the concentration of BFR plastics is extremely variable. The sorting strategy implemented at MTB plant is based on a flotation technology for plastics. This strategy has the effect of excluding around half of the total flow of plastics from the regeneration step. This proportion is largely overstated because it includes plastics with high densities but not necessarily contaminated by BFRs. Brominated plastics are incinerated as hazardous waste with energy recovery. It is also important to note that the PCB regeneration rate, which averages 87%, only concern the metals contained in PCB. However, they only represent about 35% of the total mass of PCB, the remaining fractions (that includes polymers and glass) is partially recovered in energy generation. (Cayumil et al., 2016)
28
Table 12. Material output fraction flows at each step of the recycling treatment chain for flat panel displays (in tons)
After sorting without transfer coefficient
After sorting with
transfer coefficient After regeneration
Aluminum 833.40 734.14 719.46 Copper 185.78 122.41 85.69 PCB 265.68 247.35 75.32 Plastics 3,518.40 2,715.15 1,330.42 Steel 3,149.72 2,677.26 2,195.36 Other fractions 1,470.08 2,926.75 Total 9,423.06 9,423.06 4,406.25
Table 13 presents the results for the different RR assessment scopes. As it can be noticed, scope definition greatly influences the calculation of the recycling rate, which varies from 6.8% (End-of-Life Chain Recycling Rate) to 87% (Material Regeneration Rate). The low RREOL can be explained by the fact that it comprises just
the FPD screens, which as previously mentioned, represent 41% of WEEE category II generated, but just 10% of WEEE category II collected. RREOL for both CRT and FPD
screens in 2015 entails higher results (49%).
Table 13. Recycling rates for EoL flat panel display (included in category II) in France for the year 2015
Indicator Equation Calculation syntax
RREU 𝑅𝑅𝐸𝑈= 1 𝑊𝐶 ∑ 𝑊𝑖 𝑛 𝑖=1 𝑅𝑅𝐸𝑈= 𝑊𝑎𝑓𝑡𝑒𝑟 𝑠𝑜𝑟𝑡𝑖𝑛𝑔𝑒 𝑊𝑐𝑜𝑙𝑙𝑒𝑐𝑡𝑒𝑑 =7,952 9,423= 84.4% P 𝑃𝑖= 𝑊𝑅𝑀− 𝑊𝑟𝑎𝑤 𝑊𝑖
Average 87% – more detailed in Table 11
RRRP 𝑅𝑅𝑅𝑃= 1 𝑊𝑢𝑝𝑠𝑡𝑟𝑒𝑎𝑚 ∑ 𝑊𝑖 𝑛 𝑖=1 𝑅𝑅𝑅𝑃= 𝑊𝑎𝑓𝑡𝑒𝑟 𝑠𝑜𝑟𝑡𝑖𝑛𝑔 𝑤/𝑡 𝑡𝑟𝑎𝑛𝑠𝑓𝑒𝑟 𝑐𝑜𝑒𝑓𝑓𝑖𝑐𝑖𝑒𝑛𝑡 𝑊𝑏𝑒𝑓𝑜𝑟𝑒 𝑠ℎ𝑟𝑒𝑑𝑑𝑖𝑛𝑔 =61.68 74.87= 85.5% RRWT 𝑅𝑅𝑊𝑇= 1 𝑊𝑇 ∑ 𝑊𝑖× 𝑃𝑖 𝑛 𝑖=1 𝑅𝑅𝑊𝑇= 𝑊𝑎𝑓𝑡𝑒𝑟 𝑟𝑒𝑔𝑒𝑛𝑒𝑟𝑎𝑡𝑖𝑜𝑛 𝑊𝑏𝑒𝑓𝑜𝑟𝑒 𝑠ℎ𝑟𝑒𝑑𝑑𝑖𝑛𝑔 = 4,406 10,718= 41.1% RREOL 𝑅𝑅𝐸𝑂𝐿= 1 𝑊𝐺∑ 𝑊𝑖× 𝑃𝑖 𝑛 𝑖=1 𝑅𝑅𝐸𝑂𝐿= 𝑊𝑎𝑓𝑡𝑒𝑟 𝑟𝑒𝑔𝑒𝑛𝑒𝑟𝑎𝑡𝑖𝑜𝑛 𝑊𝑔𝑒𝑛𝑒𝑟𝑎𝑡𝑒𝑑 = 4,406 64,409= 6.8%
29
As it can be concluded, depending on the assessment scopes, the results may not achieve the recycling rate target fixed by the WEEE Directive: 70% for category II (European Commission, 2012). As a result, a graphical representation of the case study is provided on figure 6. It presents the material flow evolution associated with each step of the EoL chain. Data from table 8 are used to calculate the material flows
before shredding on figure 6.
Figure 6. Mass balance at each step of the recycling treatment chain for flat panel displays
4 DISCUSSION AND CONCLUSION 4.1 Discussion and Perspectives
There are as many calculation scope interpretations as there are uses of the indicators. Indeed, process performances need to be assessed at different stages and for different purposes throughout the end-of-life chain. Hence, stakeholders frequently adopt boundaries that better suit their own needs. The notion of scale of analysis can be
30
observed with the indicators presented in this work. The end-of-life chain recycling rate (RREOL) provides a global vision of the end-of-life chain performance which is mainly
useful for compliance schemes and for environmental agencies, as well as to compare different countries performances. Then, the waste treatment recycling rate (RRWT)
provides information about compliance scheme treatment efficiency (including process losses) which can be easily used by designers when developing new products or at least be available in material datasets. Lastly, the pre-recycling pathway recycling rate (RRRP) and the material regeneration rate (P) are better suited for calculating the
pre-recycling, recycling and regeneration performances of a specific process based on a gate-to-gate approach.
The WEEE Directive seeks to provide useful and clear information to the stakeholders involved in the e-waste end-of-life chain. Since 2015, it imposes reuse and recycling targets with a single indicator. Nonetheless, as previously said, our indicators do not consider reuse. Indeed, a separate index for reuse and recycling is necessary to be coherent to the principles of the waste hierarchy, and to optimize each recovery strategy (Ardente and Mathieux, 2014). Moreover, even if the Directive suggests a calculation method, it cannot be the only one as this method implies a multi-stakeholder scope and the data collection of occasionally inaccessible information. That is why stakeholders currently calculate the recycling rate with their own specific scope. A single recycling rate seems therefore unfeasible and the creation of tools to enable all stakeholders to understand each other seems necessary. The proposed rates try to answer this need as they are stakeholder-specific. In addition, the adoption of standardized indicators could help improve the understanding and the conversion between indicators. It also becomes essential to always specify the calculation scope when communicating performance assessment results, so they can be
31
understandable.
Our proposal on recycling rate scopes could be expanded to other end-of-life indicators such as the recovery rate, reuse rate, energy recovery rate, landfill rate, etc. These indicators allow value chain assessment among the different end-of-life chain stakeholders and they provide elements to be considered when improving or setting up either a product recycling chain or a specific treatment operation. It is also important to give feedback to every stakeholder involved in the product’s life-cycle (such as product designers) and not only to recycling chain stakeholders. The present study is focused on the European context where the extended producer responsibility systems are the oldest and best developed. However, the OECD lists 384 systems worldwide in 2014 (OECD, 2014). The questions addressed by this article may therefore find echoes for these systems. From a global perspective, Asian countries receiving illegal trade of e-waste campaign for implementing extended producer responsibility systems across developed and developing countries to help reshape and rebalance the global circular economy (Liu et al., 2018). The deployment of these systems is very uneven, and the experience from the European countries is interesting to limit pitfalls, for the deployment of end-of-life evaluation indicators.
4.2 Conclusion
This work discusses the importance of better understanding and properly defining the analysis scope when calculating the recycling rate. It is one of the main indicators for assessing e-waste end-of-life chain performances. As previously mentioned, WEEE Directive focuses on assessing compliance schemes performance. Besides excluding the flows treated outside the official channels, it does not consider process losses occurring during e-waste treatment. Those limitations were also discussed by other
32
authors and complementary approaches are suggested in the literature. In that regard, this article proposes complementary evaluation scopes that seek to better fit the needs of the different end-of-life chain stakeholders. The level of information available was considered to ensure indicators’ implementation feasibility.
Having different and complementary end-of-life indicators allows performance assessment at different levels, from a single operator, to the whole end-of-life chain; it can also give inputs for designers regarding materials recycling performances. An efficient management needs to be able to go from one evaluation and decision level to another, to link the constraints and regulations on product design to the actual performances and possibilities on products recycling. This allows seeing the global value chain and actors of the today’s recycling solutions and tomorrow’s possibilities. Furthermore, in the case of e-waste management, the member states and the producers should be co-responsible for the monitoring and surveillance of extended producer responsibility schemes and should ensure that adequate means for enforcement are deployed.
Understanding end-of-life indicators also helps build circular economy strategies with better material recovery efficiency. Indeed, performance indicators are useful for screening different end-of-life scenarios and that contributes to the performance of e-waste collection and recycling. Besides, it helps moving recycling platforms towards waste treatment service proposals.
Acknowledgements
The authors acknowledge the financial support from the French Environment and Energy Management Agency (ADEME), Ecologic (a French compliance scheme) and MTB Recycling (a recycling operator and manufacturer). We would like to also thank the reviewers for their useful remarks and contributions on this article.
33 References
ADEME, 2010. La Responsabilité élargie du Producteur - Panorama 2010. Collect. Reprères ADEME 1, 28.
Ardente, F., Mathieux, F., 2014. Identification and assessment of product’s measures to improve resource efficiency: the case-study of an Energy using Product. J. Clean. Prod. 83, 126–141. https://doi.org/10.1016/j.jclepro.2014.07.058
Ardente, F., Mathieux, F., 2012. Integration of resource efficiency and waste management criteria in European product policies - Second phase - Report 3, JRC Technical Reports. https://doi.org/10.2788/72577
Ardente, F., Mathieux, F., Recchioni, M., 2014. Recycling of electronic displays: Analysis of pre-processing and potential ecodesign improvements. Resour. Conserv. Recycl. 92, 158–171. https://doi.org/10.1016/j.resconrec.2014.09.005
Baird, L., 1986. Managing Performance. New York.
Baldé, C.P., Forti, V., Gray, V., Kuehr, R., Stegmann, P., 2017. The Global E-waste Monitor - 2017. United Nations University (UNU), International Telecommunication Union (ITU) & International Solid Waste Association (ISWA), Bonn/Geneva/Vienna.
Baxter, J., Lyng, K.A., Askham, C., Hanssen, O.J., 2016. High-quality collection and disposal of WEEE:
Environmental impacts and resultant issues. Waste Manag. 57, 17–26.
https://doi.org/10.1016/j.wasman.2016.02.005
Bell, S., Morse, S., 2013. Towards an understanding of how policy making groups use indicators. Ecol. Indic. 35, 13–23. https://doi.org/10.1016/j.ecolind.2012.12.023
Borthakur, A., Govind, M., 2017. Emerging trends in consumers’ E-waste disposal behaviour and awareness: A worldwide overview with special focus on India. Resour. Conserv. Recycl. 117, 102– 113. https://doi.org/10.1016/j.resconrec.2016.11.011
Bouquin, H., 2011. Les fondements du contrôle de gestion, 4e Ed. ed, Que sais-je ? Presses Universitaires de France, Paris cedex 14.
Bouquin, H., 2001. Le contrôle de gestion: contrôle de gestion, contrôle d’entreprise, 6e Ed. ed, Collection Gestion. Presses universitaires de France.
Bourguignon, A., 1995. Peut-on définir la performance ? Rev. Française Comptab. Juillet-Ao, 61–66. Butterworth, J., Morlet, A., Nguyen, H.P., Oppenheim, J., Stuchtey, M., 2013. Towards the Circular
Economy: Economic and Business Rationale for an Accelerated Transition. Ellen MacArthur Found. Vol. 1, 98. https://doi.org/10.1162/108819806775545321
Cayumil, R., Khanna, R., Rajarao, R., Mukherjee, P.S., Sahajwalla, V., 2016. Concentration of precious metals during their recovery from electronic waste. Waste Manag. 57, 121–130. https://doi.org/10.1016/j.wasman.2015.12.004
Chancerel, P., Marwede, M., 2016. Feasibility study for setting-up reference values to support the
calculation of recyclability / recoverability rates of electr(on)ic products.
https://doi.org/10.2788/901715
Cifrian, E., Andres, A., Viguri, J.R., 2015. Developing a regional environmental information system
based on macro-level waste indicators. Ecol. Indic. 53, 258–270.
https://doi.org/10.1016/j.ecolind.2015.02.010
Cui, J., Zhang, L., 2008. Metallurgical recovery of metals from electronic waste: A review 158, 228–256. https://doi.org/10.1016/j.jhazmat.2008.02.001
Del-Río-Ortega, A., Resinas, M., Cabanillas, C., Ruiz-Cortés, A., 2013. On the definition and
design-time analysis of process performance indicators. Inf. Syst. 38, 470–490.
https://doi.org/10.1016/j.is.2012.11.004
Deprouw, A., Jover, M., Chouvenc, S., Fangeat, E., 2017. Rapport Annuel du Registre des Déchets d’Équipements Électriques et Électroniques – Données 2016, Collection. ed. ADEME, Angers.
34
Deprouw, A., Jover, M., Chouvenc, S., Pensec, A., Fangeat, E., 2018. Rapport Annuel du Registre des Déchets d’Équipements Électriques et Électroniques – Données 2017. ADEME, Angers.
Diamantini, C., Genga, L., Potena, D., Storti, E., 2014. Collaborative Building of an Ontology of Key Performance Indicators, in: Springer (Ed.), On the Move to Meaningful Internet Systems: OTM
2014 Conferences. Meersman R., et al., Berlin, Heidelberg, pp. 148–165.
https://doi.org/https://doi.org/10.1007/978-3-662-45563-0_9
Ellen MacArthur Foundation, 2015. Growth within: a circular economy vision for a competitive Europe, Ellen MacArthur Foundation.
EUROMETAUX, EUROFER, 2012. Recycling Rates for Metals. Brussels.
European Commission, 2012. Directive 2012/19/EU of the European Parliament and of the Council on waste electrical and electronic equipment (WEEE). Off. J. Eur. Union 13, 1–24. https://doi.org/10.3000/19770677.L_2012.197.eng
European Commission, 2008. Directive 2008/98/EC of the European Parliament and of the Council of 19 November 2008 on waste and repealing certain directives. Off. J. Eur. Union 3–30. https://doi.org/2008/98/EC.; 32008L0098
European Commission, 2005. Commission Decision of 3 May 2005 - laying down rules for monitoring compliance of Member States and establishing data formats for the purposes of Directive 2002/96/EC of the European Parliament and of the Council on waste electrical and electronic equipm. Off. J. Eur. Union 48, 13–16.
European Commission, 2003. Directive 2002/96/EC of the European Parliament and of the Council on waste electrical and electronic equipment (WEEE). Off. J. Eur. Union L 37, 24–38. https://doi.org/10.3000/19770677.L_2012.197.eng
European Commission, 1975. Council Directive of 15 December 1975 on waste (75/442/EEC). Off. J. Eur. Union 1975, 39–41.
Eurostat, 2018. Waste generated by households by year and waste category. Key to Eur. Stat. Environmen, 4.
Eurostat, 2017. Waste statistics: Electrical and electronic equipment. Stat. Explain. April, 4.
Franklin-Johnson, E., Figge, F., Canning, L., 2016. Resource duration as a managerial indicator for
Circular Economy performance. J. Clean. Prod. 133, 589–598.
https://doi.org/10.1016/j.jclepro.2016.05.023
Graedel, T.E., Allwood, J.M., Birat, J.P., Buchert, M., Hagelüken, C., Reck, B.K., Sibley, S.F., Sonnemann, G., 2011. What do we know about metal recycling rates? J. Ind. Ecol. 15, 355–366. https://doi.org/10.1111/j.1530-9290.2011.00342.x
Grimaud, G., Perry, N., Laratte, B., 2018. Sustainable Performance Evaluation of Recycling Pathways During the Design Phase. 24th CIRP Conf. Life Cycle Eng. 6.
Grimaud, G., Perry, N., Laratte, B., 2017. Aluminium cables recycling process: Environmental impacts
identification and reduction. Resour. Conserv. Recycl.
https://doi.org/10.1016/j.resconrec.2017.11.010
Hagelüken, C., 2007. Metals Recovery from e-scrap in a global environment, in: OEWG Basel Convention. UMICORE Precious Metals Refining, Geneva, p. 51.
Haupt, M., Vadenbo, C., Hellweg, S., 2016. Do We Have the Right Performance Indicators for the Circular Economy? Insight into the Swiss Waste Management System. J. Ind. Ecol. 00, 1–13. https://doi.org/10.1111/jiec.12506
Hestin, M., Pernot, D., Huranova, D., Lecerf, L., 2016. Partie 1 : Analyses transversales, in: Etude Sur La Transposition de La Directive DEEE En Europe. Angers, pp. 1–142.
Horta Arduin, R., Charbuillet, C., Berthoud, F., Perry, N., 2016. W hat are the environmental benefits of increasing the WEEE treatment in France?, in: 2016 Electronics Goes Green 2016+. Fraunhofer IZM, Berlin, pp. 1–7. https://doi.org/10.1109/EGG.2016.7829872
Huisman, J., Botezatu, I., Herreras, L., Liddane, M., Hintsa, J., Luda di Cortemiglia, V., Leroy, P., Vermeersch, E., Mohanty, S., Van den Brink, S., Ghenciu, B., Dimitrova, D., Nash, E., Shryane,
35
T., Wieting, M., Kehoe, J., Baldé, C.P., Magalini, F., Zanasi, A., Ruini, F., Männistö, T., Bonzio, A., Zan, A., 2015. Countering WEEE Illegal Trade (CWIT) Summary Report, Market Assessment, Legal Analysis, Crime Analysis and Recommendations Roadmap, United Nations University, INTERPOL, and Partners. https://doi.org/978-92-808-4560-0
Huisman, J., Leroy, P., Tertre, F., Söderman, M.L., Chancerel, P., Cassard, D., Amund, N., Wäger, P.A., Kushnir, D., Rotter, V.S., Mählitz, P., Herreras, L., Emmerich, J., 2017. ProSUM Project Urban mine and Mining wastes - Final report.
IEA, 2014. World Energy Outlook 2014, International Energy Agency. https://doi.org/10.1787/weo-2014-en
IEC, 2012. Technical Report IEC/TR 62635: Guidelines for End of Life Information Provision from Manufacturers and Recyclers, and for Recyclability Rate Calculation of Electrical and Electronic Equipment.
ISO, 2002. ISO 22628:2002 - Road vehicles - Recyclability and recoverability - Calculation method. Kaya, M., 2016. Recovery of metals and nonmetals from electronic waste by physical and chemical
recycling processes. Waste Manag. 57, 64–90. https://doi.org/10.1016/j.wasman.2016.08.004 Kiddee, P., Naidu, R., Wong, M.H., 2013. Electronic waste management approaches: An overview.
Waste Manag. 33, 1237–1250. https://doi.org/10.1016/j.wasman.2013.01.006
Liu, Z., Adams, M., Walker, T.R., 2018. Are exports of recyclables from developed to developing countries waste pollution transfer or part of the global circular economy? Resour. Conserv. Recycl. 136, 22–23. https://doi.org/10.1016/j.resconrec.2018.04.005
Manfredi, S., Goralczyk, M., 2013. Life cycle indicators for monitoring the environmental performance
of European waste management. Resour. Conserv. Recycl. 81, 8–16.
https://doi.org/10.1016/j.resconrec.2013.09.004
Martínez Leal, J., Pompidou, S., Charbuillet, C., Perry, N., 2018. Product Recoverability: A Review of Assessment Methods. Procedia CIRP 69, 710–715. https://doi.org/10.1016/j.procir.2017.11.061 Monier, V., Deprouw, A., Jover, M., Chouvenc, S., Fangeat, E., 2016. Rapport Annuel du Registre des
Déchets d’Équipements Électriques et Électroniques – Données 2015, Collection. ed. ADEME, Angers.
Monier, V., Deprouw, A., Jover, M., Litaudon, V., Fangeat, E., 2015. Rapport Annuel du Registre des Déchets d’Équipements Électriques et Électroniques – Données 2014, Collection. ed. ADEME, Angers.
Monier, V., Mudgal, S., Hestin, M., Cavé, J., Gheoldus, M., Acoleyen, M. Van, Laureysens, I., Watkins, E., Fedrigo-Fazio, D., Reisinger, H., Weissenbach, T., Oliva, J., Porsch, L., 2014. Development of Guidance on Extended Producer Responsibility (EPR). Eur. Comm. – DG Environ. 1–227. Movilla, N.A., 2016. Contribution aux méthodes de conception pour la fin de vie : prise en compte des
pratiques de prétraitement de la filière DEEE.
Nelen, D., Manshoven, S., Peeters, J.R., Vanegas, P., D’Haese, N., Vrancken, K., 2014. A multidimensional indicator set to assess the benefits of WEEE material recycling. J. Clean. Prod. 83, 305–316. https://doi.org/10.1016/j.jclepro.2014.06.094
OECD, 2015. Environment at a Glance 2015.
https://doi.org/https://doi.org/http://dx.doi.org/10.1787/9789264235199-en
OECD, 2014. The State of Play on Extended Producer Responsibility (EPR): Opportunities and Challenges, in: Global Forum on Environment: Promoting Sustainable Materials Management through Extended Producer Responsibility (EPR). p. 17. https://doi.org/10.1787/9789264189867-en
Perkins, D.N., Brune Drisse, M.N., Nxele, T., Sly, P.D., 2014. E-waste: A global hazard. Ann. Glob. Heal. 80, 286–295. https://doi.org/10.1016/j.aogh.2014.10.001
Rigamonti, L., Sterpi, I., Grosso, M., 2016. Integrated municipal waste management systems: An indicator to assess their environmental and economic sustainability. Ecol. Indic. 60, 1–7. https://doi.org/10.1016/j.ecolind.2015.06.022