is an open access repository that collects the work of Arts et Métiers Institute of
Technology researchers and makes it freely available over the web where possible.
This is an author-deposited version published in: https://sam.ensam.eu
Handle ID: .http://hdl.handle.net/10985/16579
To cite this version :
Foued ABROUG, Etienne PESSARD, Guénaël GERMAIN, Franck MOREL, Etienne CHOVE -The influence of machined topography on the HCF behaviour of the Al7050 alloy - In: 7th International Conference on Fatigue Design, France, 2017-11 - 7th International Conference on Fatigue Design - 2018
Any correspondence concerning this service should be sent to the repository Administrator : archiveouverte@ensam.eu
10.1016/j.proeng.2018.02.057
10.1016/j.proeng.2018.02.057 © 2018 The Authors.
1877-7058 Available online atwww.sciencedirect.com
ScienceDirect
Procedia Engineering 00 (2017) 000–000www.elsevier.com/locate/procedia
1877-7058 © 2017 The Authors. Published by Elsevier Ltd.
Peer-review under responsibility of the scientific committee of the 7th International Conference on Fatigue Design.
7
thInternational Conference on Fatigue Design, Fatigue Design 2017, 29-30 November 2017,
Senlis, France
THE INFLUENCE OF MACHINED TOPOGRAPHY ON THE
HCF BEHAVIOUR OF THE Al7050 ALLOY
F. Abroug
a, E. Pessard
a*, G. Germain
a, F. Morel
a, E. Chové
b,
a LAMPA– Arts et métiers ParisTech, 49035, Angers Cedex – France.
bEurope Technologies – 2, rue de la Fonderie – B.P. 20536, 44475 Cardquefou Cedex – France
Abstract
The aim of this study is to identify the impact of High Speed Machining defects on the fatigue behaviour
of the Al7050 aluminium alloy. A vast experimental campaign under fully reversed plane bending loads
containing different surface states has been undertaken to characterize the effect of the surface
topography on the fatigue behaviour. The results show that the fatigue strength decreases only when the
surface roughness is significantly degraded. It is also pointed out that manual grinding eliminates the
effect of the machining defects on the fatigue behaviour.
In order to predict the influence of the surface condition on the fatigue behaviour, a numerical approach
based on the real surface topology has been developed. It is shown that the numerically identified crack
initiation sites are in agreement with the experimental results. A probabilistic approach based on the
weakest link concept, associated with the definition of a stress based crack initiation threshold has been
integrated in a FE model. This approach leads naturally to a probabilistic Kitagawa type diagram, which
in this case explains the relationship between the size defect and the scale effect on the fatigue strength.
© 2017 The Authors. Published by Elsevier Ltd.Peer-review under responsibility of the scientific committee of the 7th International Conference on Fatigue Design.
* Corresponding author. Tel.: +33 (0)2 41 20 73 79
E-mail address: Etienne.pessard@ensam.eu
Available online atwww.sciencedirect.com
ScienceDirect
Procedia Engineering 00 (2017) 000–000www.elsevier.com/locate/procedia
1877-7058 © 2017 The Authors. Published by Elsevier Ltd.
Peer-review under responsibility of the scientific committee of the 7th International Conference on Fatigue Design.
THE INFLUENCE OF MACHINED TOPOGRAPHY ON THE
HCF BEHAVIOUR OF THE Al7050 ALLOY
F. Abroug
a, E. Pessard
a*, G. Germain
a, F. Morel
a, E. Chové
b,
a LAMPA– Arts et métiers ParisTech, 49035, Angers Cedex – France.
b Europe Technologies – 2, rue de la Fonderie – B.P. 20536, 44475 Cardquefou Cedex – France
Abstract
The aim of this study is to identify the impact of High Speed Machining defects on the fatigue behaviour
of the Al7050 aluminium alloy. A vast experimental campaign under fully reversed plane bending loads
containing different surface states has been undertaken to characterize the effect of the surface
topography on the fatigue behaviour. The results show that the fatigue strength decreases only when the
surface roughness is significantly degraded. It is also pointed out that manual grinding eliminates the
effect of the machining defects on the fatigue behaviour.
In order to predict the influence of the surface condition on the fatigue behaviour, a numerical approach
based on the real surface topology has been developed. It is shown that the numerically identified crack
initiation sites are in agreement with the experimental results. A probabilistic approach based on the
weakest link concept, associated with the definition of a stress based crack initiation threshold has been
integrated in a FE model. This approach leads naturally to a probabilistic Kitagawa type diagram, which
in this case explains the relationship between the size defect and the scale effect on the fatigue strength.
© 2017 The Authors. Published by Elsevier Ltd.Peer-review under responsibility of the scientific committee of the 7th International Conference on Fatigue Design.
* Corresponding author. Tel.: +33 (0)2 41 20 73 79
Keywords: Defects, machining, fatigue behaviour, aluminium alloys
1. INTRODUCTION
This study is part of a French research project that deals with the control of the machining and grinding of large structural aeronautical components.
The material under investigation is the 7050-T7451 aluminium alloy. During HSM (High Speed Machining) of aircraft parts, macro-geometrical defects can be created. Mismatch may appear due to the gap left between two consecutive passes of the machining tool. Chatter can also be created due to the tool/part vibrations which may occur during different types of machining.
In order to respect the strict specifications imposed by the aeronautical industry, expensive manual grinding is often performed to remove the machining defects.
By the local thermomechanical effects induced, machining can change the surface integrity of manufactured parts and therefore change their fatigue strength. Shahzad [1] and Guillemot [2] showed that changing the cutting conditions can generate a change in surface topology and therefore a change in the fatigue life. Furthermore, Shahzad pointed out that the fatigue resistance shows a significant decrease when surface roughness increases. Even if HSM is known to introduce residual stresses in the machined parts, Tang [3] and Rao [4] showed that these residual stresses are mainly located in the first 50 micrometers below the surface. A variation of the microstructure in the upper surface (hardness variation, grain recrystallization) can also be detected after HSM. Campbell [5] showed that for the Al7000, these changes are located in the first 30 micrometers below the surface.
Different prediction models have been proposed in the literature to take into account the effect of the surface topography on the fatigue strength of machined parts. Analytical models such as [6][7][8] are based on the calculation of the stress concentration factor which is the ratio between the generated and the applied stress in a part. Most of them take into account the sole geometrical aspect of the surface. Numerical approaches also exist and make use of the real surface roughness profile [9][10]. These approaches aim at determining the stress concentration factors at every point of the profile and use them to predict the fatigue behaviour.
The aim of this study is hence to identify the effect of machining defects on the fatigue resistance of a wrought aluminium alloy and to develop a robust prediction method to predict the high cycle fatigue behaviour of a wide range of defects and surface conditions of machined components.
2. MATERIAL AND EXPERIMENTAL METHOD
2.1. Material properties
The specimens were machined out of a 30 mm thick 7050-T7451 aluminum alloy sheet. For this range of thickness, the material shows a high recrystallization rate. Areas of consolidation of recrystallized and non-recrystallized grains can be up to a few millimeters in length. The grains have dimensions ranging from 5 to 300 µm in the L and the TL directions, and 5-50 µm in the TC direction (Figure 1). Different types of intermetallic inclusions are present at the grain boundaries and in the recrystallized grains (Mg2Si, Al7Cu2Fe, MgZn2, AlCuZn, etc …). These inclusions are brittle and can be at the origin of crack initiation under fatigue loading [1].
Fig.1: Microstructure of the Al7050-T7451 (L= rolling direction; TL= long transverse; TC= short transverse)
Monotonic tensile tests were conducted to determine the mechanical properties of the material at 0 °, 45 ° and 90 ° to the rolling direction (Table 1). The anisotropy of the mechanical behaviour of the studied material is only slight and its ductility is limited with a maximum elongation of 13.9%.
Table 1: Mechanical properties of the Al7050-T7451 Rolling direction σy [MPa] UTS [MPa] Elongation %
0° 475 536 12.3
45° 428 496 13.9
90° 475 538 11.9
2.2. Experimental conditions
Fatigue tests were conducted under fully reversed plane bending loads (R=-1). This type of test, via the bending gradient, applies a maximum stress at the top and bottom of the gauge length and thus tends to concentrate the stress on the surface. The specific specimen geometry developed for this study is shown in Table 2. The tests were run on a resonant fatigue testing machine, at a frequency of 75 Hz in plane bending using a Rumul Cracktonic type machine at room temperature and in a ambient air environment. The fatigue tests were conducted using the Stair Case method [11]. 15 samples per batch were used except for the grinded and Ra 4.9µm surface state batches, where 10 specimens were tested. The stopping criterion is the occurrence of a sufficiently long crack (of size greater than 5 mm) detected by a frequency drop of 0.75Hz, or a maximum number of 2.106 cycles.
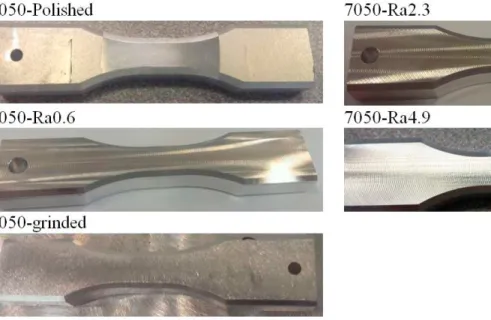
In this project a preliminary study on aircraft components machined by HSM milling was conducted to define different categories of local defects (mismatch, chatter) and degraded surface conditions that may appear by industrial machining. The present work focuses on end milling surface conditions going from the polished state to Ra 4.9µm roughness state and the manually grinded state (Table 2).
2 Author name / Procedia Engineering 00 (2017) 000–000 Keywords: Defects, machining, fatigue behaviour, aluminium alloys
1. INTRODUCTION
This study is part of a French research project that deals with the control of the machining and grinding of large structural aeronautical components.
The material under investigation is the 7050-T7451 aluminium alloy. During HSM (High Speed Machining) of aircraft parts, macro-geometrical defects can be created. Mismatch may appear due to the gap left between two consecutive passes of the machining tool. Chatter can also be created due to the tool/part vibrations which may occur during different types of machining.
In order to respect the strict specifications imposed by the aeronautical industry, expensive manual grinding is often performed to remove the machining defects.
By the local thermomechanical effects induced, machining can change the surface integrity of manufactured parts and therefore change their fatigue strength. Shahzad [1] and Guillemot [2] showed that changing the cutting conditions can generate a change in surface topology and therefore a change in the fatigue life. Furthermore, Shahzad pointed out that the fatigue resistance shows a significant decrease when surface roughness increases. Even if HSM is known to introduce residual stresses in the machined parts, Tang [3] and Rao [4] showed that these residual stresses are mainly located in the first 50 micrometers below the surface. A variation of the microstructure in the upper surface (hardness variation, grain recrystallization) can also be detected after HSM. Campbell [5] showed that for the Al7000, these changes are located in the first 30 micrometers below the surface.
Different prediction models have been proposed in the literature to take into account the effect of the surface topography on the fatigue strength of machined parts. Analytical models such as [6][7][8] are based on the calculation of the stress concentration factor which is the ratio between the generated and the applied stress in a part. Most of them take into account the sole geometrical aspect of the surface. Numerical approaches also exist and make use of the real surface roughness profile [9][10]. These approaches aim at determining the stress concentration factors at every point of the profile and use them to predict the fatigue behaviour.
The aim of this study is hence to identify the effect of machining defects on the fatigue resistance of a wrought aluminium alloy and to develop a robust prediction method to predict the high cycle fatigue behaviour of a wide range of defects and surface conditions of machined components.
2. MATERIAL AND EXPERIMENTAL METHOD
2.1. Material properties
The specimens were machined out of a 30 mm thick 7050-T7451 aluminum alloy sheet. For this range of thickness, the material shows a high recrystallization rate. Areas of consolidation of recrystallized and non-recrystallized grains can be up to a few millimeters in length. The grains have dimensions ranging from 5 to 300 µm in the L and the TL directions, and 5-50 µm in the TC direction (Figure 1). Different types of intermetallic inclusions are present at the grain boundaries and in the recrystallized grains (Mg2Si, Al7Cu2Fe, MgZn2, AlCuZn, etc …). These inclusions are brittle and can be at the origin of crack initiation under fatigue loading [1].
Author name / Procedia Engineering 00 (2017) 000–000 3
Fig.1: Microstructure of the Al7050-T7451 (L= rolling direction; TL= long transverse; TC= short transverse)
Monotonic tensile tests were conducted to determine the mechanical properties of the material at 0 °, 45 ° and 90 ° to the rolling direction (Table 1). The anisotropy of the mechanical behaviour of the studied material is only slight and its ductility is limited with a maximum elongation of 13.9%.
Table 1: Mechanical properties of the Al7050-T7451 Rolling direction σy [MPa] UTS [MPa] Elongation %
0° 475 536 12.3
45° 428 496 13.9
90° 475 538 11.9
2.2. Experimental conditions
Fatigue tests were conducted under fully reversed plane bending loads (R=-1). This type of test, via the bending gradient, applies a maximum stress at the top and bottom of the gauge length and thus tends to concentrate the stress on the surface. The specific specimen geometry developed for this study is shown in Table 2. The tests were run on a resonant fatigue testing machine, at a frequency of 75 Hz in plane bending using a Rumul Cracktonic type machine at room temperature and in a ambient air environment. The fatigue tests were conducted using the Stair Case method [11]. 15 samples per batch were used except for the grinded and Ra 4.9µm surface state batches, where 10 specimens were tested. The stopping criterion is the occurrence of a sufficiently long crack (of size greater than 5 mm) detected by a frequency drop of 0.75Hz, or a maximum number of 2.106 cycles.
In this project a preliminary study on aircraft components machined by HSM milling was conducted to define different categories of local defects (mismatch, chatter) and degraded surface conditions that may appear by industrial machining. The present work focuses on end milling surface conditions going from the polished state to Ra 4.9µm roughness state and the manually grinded state (Table 2).
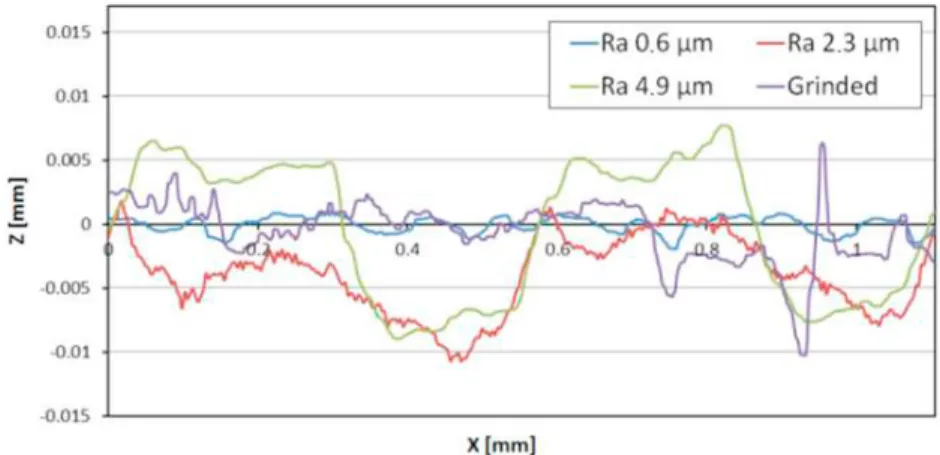
Polished specimens have been manually polished using abrasive papers ranging from grade 800 to grade 2400. Machining of specimens with a "machined" surface roughness was carried out by end milling (Figure 2). Cutting conditions have been modified in order to obtain different roughness states (Table 3). Grinded specimens were prepared by an industrial project partner “Mecachrome” in industrial conditions. The profiles of these surface roughness states are shown in Figure 3.
Fig.3: Profiles from different test specimen batches
The studied material has a marked rolling texture and contains a large grain size. Hence, residual stresses characterization by X-ray diffraction analyses is not simple. X-ray analyses were performed on the various surface states. Residual stress analysis provided conclusive results only for the polished and Ra 2.3 µm surface states. The results showed, for these two batches, a small residual tensile stress on the surface that can be neglected.
Regarding the surface topology, both height and functional parameters [12] were characterized (Table 3). These parameters are: = ∬ |, | (1) = ∬ , (2) = ∬ , (3) = . (4)
where: Sa = arithmetic mean height; Sq = Root mean squared height; Sku = Kurtosis; Svi = groove’s fluid retention
index and Vv(h0.8) = The void volume of the valley section that represents 80% of the material ratio curve [13].
Table 2: surface states tested in fatigue.
3. Results and discussions
Fatigue tests highlight the effect of each surface condition on the fatigue strength (
σ
D) estimated at 2.106 cycles.The results are shown in Table 3. Unbroken specimens from the staircase fatigue test have been tested at a higher load in order to characterize the S-N curve trend (Figure 4).
4 Author name / Procedia Engineering 00 (2017) 000–000
Polished specimens have been manually polished using abrasive papers ranging from grade 800 to grade 2400. Machining of specimens with a "machined" surface roughness was carried out by end milling (Figure 2). Cutting conditions have been modified in order to obtain different roughness states (Table 3). Grinded specimens were prepared by an industrial project partner “Mecachrome” in industrial conditions. The profiles of these surface roughness states are shown in Figure 3.
Fig.3: Profiles from different test specimen batches
The studied material has a marked rolling texture and contains a large grain size. Hence, residual stresses characterization by X-ray diffraction analyses is not simple. X-ray analyses were performed on the various surface states. Residual stress analysis provided conclusive results only for the polished and Ra 2.3 µm surface states. The results showed, for these two batches, a small residual tensile stress on the surface that can be neglected.
Regarding the surface topology, both height and functional parameters [12] were characterized (Table 3). These parameters are: =∬ |, | (1) = ∬ , (2) = ∬ , (3) = . (4)
where: Sa = arithmetic mean height; Sq = Root mean squared height; Sku = Kurtosis; Svi = groove’s fluid retention
index and Vv(h0.8) = The void volume of the valley section that represents 80% of the material ratio curve [13].
Author name / Procedia Engineering 00 (2017) 000–000 5 Table 2: surface states tested in fatigue.
3. Results and discussions
Fatigue tests highlight the effect of each surface condition on the fatigue strength (
σ
D) estimated at 2.106 cycles.The results are shown in Table 3. Unbroken specimens from the staircase fatigue test have been tested at a higher load in order to characterize the S-N curve trend (Figure 4).
Table 3: results of the experimental tests and prediction of fatigue limit
Surface state Sa [µm] Sku Sq [µm] Svi Kf
σD
[MPa](experimental) (calculated)
σD
[MPa]polished ≤0.04 3.55 ≤0.05 0.12 1 174 174
Ra 0.6 1.106 2.499 1.187 0.088 1.026 160 169.6
grinded 3.839 2.768 4.54 0.087 1.109 157 156.8
Ra 2.3 4.243 7.36 6.414 0.051 1.241 141 140.24
Ra 4.9 5.511 1.943 5.74 0.042 1.047 119 164.81
3.1. Fatigue surface criterion based on deterministic or empirical approach
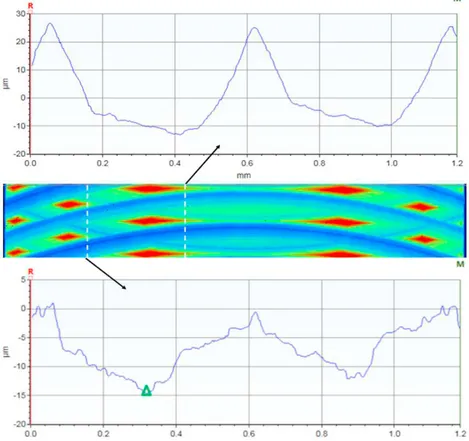
Most studies on the effect of surface geometry on fatigue strength propose criteria based on the usual roughness parameters (Ra, Rz) [6][7]. The main shortcomings of these criteria stem from the fact that they are all based on a profile measured over a line. It is difficult to extrapolate these criteria to heterogeneous surface conditions (such as shown in Figure 5) that can be obtained by milling.
Figure 5: variation of the obtained pattern depending on the measurement position.
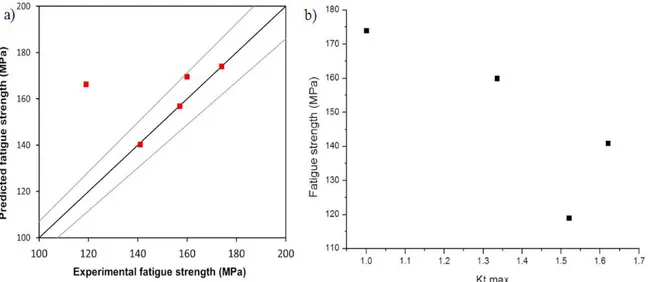
Figure 6: a) Comparison between experimental results and Souto-Lebel’s approach predictions, b) Fatigue limit as function of maximal stress concentration factor Kt,I,max.
The approach proposed by Souto-Lebel [8] is one of the few approaches based on surface parameters rather than parameters measured over a line. It is based on the calculation of the effective stress concentration factor dependent on several surface parameters:
= 1 + ∙ ∙ (5)
Where ac is a critical defect size which can be determined by readjustment. The fatigue limit of machined specimens is then predicted by referring to the fatigue limit of a flawless surface material, in this case the polished state:
=
(6)
The critical defect size ac chosen to minimize the prediction errors for the different batches is 10 µm. The results are shown in Table 3.
According to Figure 6-a), Souto-Lebel’s approach is efficient for the 4 batches with the lowest roughness. The maximum error is then less than 7%. However, the prediction of the fatigue limit for the Ra4,9 surface condition is too optimistic.
Another approach based on finite element (FE) simulations has been developed in order to better take into account the stress distribution at the bottom of the machining grooves for any surface states and surface defect. In this new approach, the surface topology is experimentally characterized using a BRUCKER Contour GTK0-X type of profilometer. A regular Gaussian regression filter is then applied over the scanned surface profile to remove undesired singularities. The filter is a long wavelength pass filter with a short wavelength cutoff of 15µm. The obtained surface is then modelled using the finite element method to perform an elastic calculation.
It is shown that the location of the maximum stress values from the FE analysis are in good agreement with the locations of the crack initiation locations experimentally observed on the tested specimens (Figure 7). Figure 7-a) shows the presence of a non-metallic inclusion at the crack initiation site of a machined specimen.
6 Author name / Procedia Engineering 00 (2017) 000–000
Table 3: results of the experimental tests and prediction of fatigue limit
Surface state Sa [µm] Sku Sq [µm] Svi Kf
σD
[MPa](experimental) (calculated)
σD
[MPa]polished ≤0.04 3.55 ≤0.05 0.12 1 174 174
Ra 0.6 1.106 2.499 1.187 0.088 1.026 160 169.6
grinded 3.839 2.768 4.54 0.087 1.109 157 156.8
Ra 2.3 4.243 7.36 6.414 0.051 1.241 141 140.24
Ra 4.9 5.511 1.943 5.74 0.042 1.047 119 164.81
3.1. Fatigue surface criterion based on deterministic or empirical approach
Most studies on the effect of surface geometry on fatigue strength propose criteria based on the usual roughness parameters (Ra, Rz) [6][7]. The main shortcomings of these criteria stem from the fact that they are all based on a profile measured over a line. It is difficult to extrapolate these criteria to heterogeneous surface conditions (such as shown in Figure 5) that can be obtained by milling.
Figure 5: variation of the obtained pattern depending on the measurement position.
Author name / Procedia Engineering 00 (2017) 000–000 7
Figure 6: a) Comparison between experimental results and Souto-Lebel’s approach predictions, b) Fatigue limit as function of maximal stress concentration factor Kt,I,max.
The approach proposed by Souto-Lebel [8] is one of the few approaches based on surface parameters rather than parameters measured over a line. It is based on the calculation of the effective stress concentration factor dependent on several surface parameters:
= 1 + ∙ ∙ (5)
Where ac is a critical defect size which can be determined by readjustment. The fatigue limit of machined specimens is then predicted by referring to the fatigue limit of a flawless surface material, in this case the polished state:
=
(6)
The critical defect size ac chosen to minimize the prediction errors for the different batches is 10 µm. The results are shown in Table 3.
According to Figure 6-a), Souto-Lebel’s approach is efficient for the 4 batches with the lowest roughness. The maximum error is then less than 7%. However, the prediction of the fatigue limit for the Ra4,9 surface condition is too optimistic.
Another approach based on finite element (FE) simulations has been developed in order to better take into account the stress distribution at the bottom of the machining grooves for any surface states and surface defect. In this new approach, the surface topology is experimentally characterized using a BRUCKER Contour GTK0-X type of profilometer. A regular Gaussian regression filter is then applied over the scanned surface profile to remove undesired singularities. The filter is a long wavelength pass filter with a short wavelength cutoff of 15µm. The obtained surface is then modelled using the finite element method to perform an elastic calculation.
It is shown that the location of the maximum stress values from the FE analysis are in good agreement with the locations of the crack initiation locations experimentally observed on the tested specimens (Figure 7). Figure 7-a) shows the presence of a non-metallic inclusion at the crack initiation site of a machined specimen.
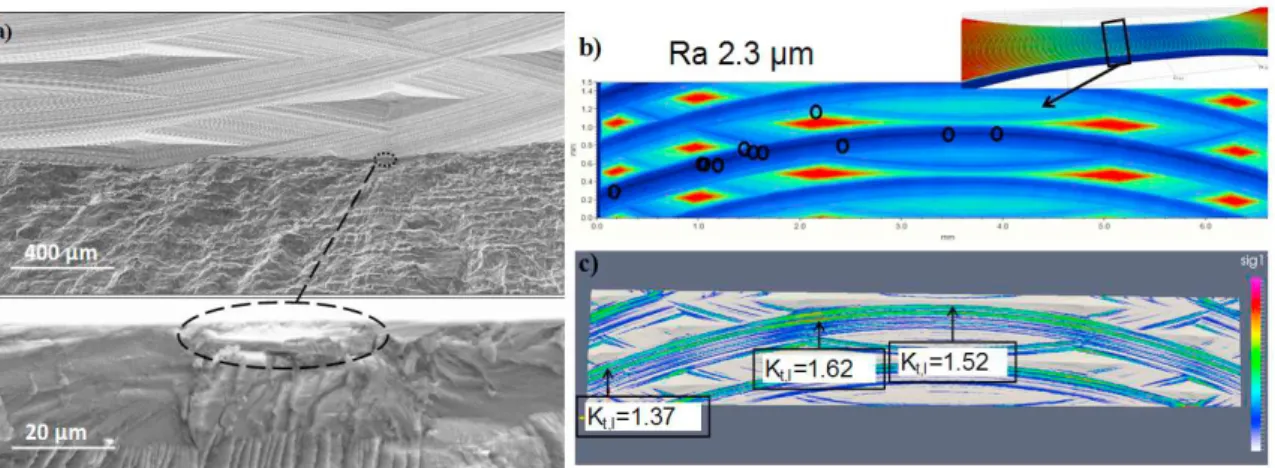
Figure 7: comparison between experimental results and FE analysis. (a) crack initiation site (b) experimental locations of initiation (c) FE analysis.
The stress concentration factor Kt,I which represents the ratio between the generated and the first principal applied stress is not homogeneous for the Ra2.3µm surface condition. Kt,I goes from 1.37 near the specimen’s border, to 1.52 in the centre and 1.6 in the most critical zone. This zone is located at 1.3 mm from the specimen’s centre and spreads over 0.8 mm of width.
From the comparison between crack initiation sites from Figure 7-b) and the stress concentration zones from the FE analysis in Figure 7-c) it is clear that crack initiation is located in the machining grooves with high stress concentration factor Kt,I but not necessarily in the zones where Kt,I is maximum. This means that the local stress intensity is one of the most significant parameters in the crack initiation mechanism but the macroscopic fatigue strength may also depend on the extent of the loaded zone.
The maximal stress concentration factor Kt,I,max is measured as well by FE analysis for the surface conditions Ra 0.6µm, Ra 2.3µm and Ra 4.9µm. The stress concentration factor for the polished surface condition is taken as equal to 1. Results of the fatigue limit as a function of Kt,I,max are shown in Figure 6-b). Again, the relation between the maximal stress concentration factor Kt ,I,max on the total surface and the fatigue behaviour for the milled surfaces is not that clear.
Experimental and first finite Element simulation results shows that initiation on machining surface doesn’t always start on the most loaded point but in a surface zone where the stress concentration factor is higher than a value of 1.3. To take into account this conclusion in the fatigue design approach, it seems necessary to integrate in the fatigue strength estimation all potential initiation area.
3.2. Fatigue surface criterion based on Probabilistic approach
The probabilistic two scale approach proposed is based on the calculation initiation probability on the surface. The fatigue strength at the local scale of elementary surface S0 is described by a Weibull distribution Weibull [14, 15, 16]. To illustrate the approach, the threshold is defined by the first principal stress amplitude but any equivalent stress quantity can be integrated in this calculation. The weakest link concept is applied to estimate the fatigue strength of the total component.
(7) For sake of simplicity, the threshold is defined by the first principal stress amplitude but any equivalent stress quantity can be integrated in this calculation. The total failure probability of the SΩ surface domain is given by:
(
1
0)
1
−
P
F=
Π
−
P
− − =∫
Ω S dS i I m FS
P
σ
σ
0 , 1 exp 1 0 (8) Where, the exponent m governs the scatter while the scale factor σ0 influences the mean value of the distribution.∫
Ω Ω = S m m dS I i IS
H
σ
σ
max , , 1σ
σ
D I I I tK
, max , max , , = (9)Knowing the maximal principal stress σI,max on the total surface, the fatigue strength defined σI,D can be calculated for a given failure probability in function of Kt,I,max and the stress heterogeneity factor Hm as:
−
Ω =H
P
S
S
K
mF m I t a I1
1
ln
0 1 max , , 0 ,σ
σ
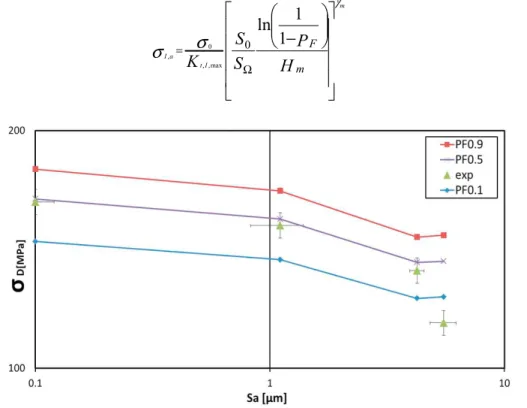
(10)Figure 8: Experimental and prediction of the fatigue limit evolution as a function of Sa
According to Figure 8, the Sa parameter seems to correlate with the fatigue behaviour of the different tested batches. This diagram seems to follow the same trend as the Kitagawa-Takahashi diagram in which the fatigue strength is defined as function of the initial crack length or defect size. The endurance limit decreases slowly for low values of Sa then drops sharply when Sa exceeds a threshold value between 1 and 3.5µm.
Figure 8 also shows the first encouraging results using the surface probabilistic approach. Using the theory of the weakest link in the probabilistic framework makes it possible to take into account all potential initiation sites. It also makes it possible to directly consider the scale effect which is vital for the prediction of the fatigue strength of large machined components.
8 Author name / Procedia Engineering 00 (2017) 000–000
Figure 7: comparison between experimental results and FE analysis. (a) crack initiation site (b) experimental locations of initiation (c) FE analysis.
The stress concentration factor Kt,Iwhich represents the ratio between the generated and the first principal applied stress is not homogeneous for the Ra2.3µm surface condition. Kt,I goes from 1.37 near the specimen’s border, to 1.52 in the centre and 1.6 in the most critical zone. This zone is located at 1.3 mm from the specimen’s centre and spreads over 0.8 mm of width.
From the comparison between crack initiation sites from Figure 7-b) and the stress concentration zones from the FE analysis in Figure 7-c) it is clear that crack initiation is located in the machining grooves with high stress concentration factor Kt,I but not necessarily in the zones where Kt,I is maximum. This means that the local stress intensity is one of the most significant parameters in the crack initiation mechanism but the macroscopic fatigue strength may also depend on the extent of the loaded zone.
The maximal stress concentration factor Kt,I,max is measured as well by FE analysis for the surface conditions Ra 0.6µm, Ra 2.3µm and Ra 4.9µm. The stress concentration factor for the polished surface condition is taken as equal to 1. Results of the fatigue limit as a function of Kt,I,max are shown in Figure 6-b). Again, the relation between the maximal stress concentration factor Kt ,I,max on the total surface and the fatigue behaviour for the milled surfaces is not that clear.
Experimental and first finite Element simulation results shows that initiation on machining surface doesn’t always start on the most loaded point but in a surface zone where the stress concentration factor is higher than a value of 1.3. To take into account this conclusion in the fatigue design approach, it seems necessary to integrate in the fatigue strength estimation all potential initiation area.
3.2. Fatigue surface criterion based on Probabilistic approach
The probabilistic two scale approach proposed is based on the calculation initiation probability on the surface. The fatigue strength at the local scale of elementary surface S0 is described by a Weibull distribution Weibull [14, 15, 16]. To illustrate the approach, the threshold is defined by the first principal stress amplitude but any equivalent stress quantity can be integrated in this calculation. The weakest link concept is applied to estimate the fatigue strength of the total component.
(7) For sake of simplicity, the threshold is defined by the first principal stress amplitude but any equivalent stress quantity can be integrated in this calculation. The total failure probability of the SΩ surface domain is given by:
(
1
0)
1
−
P
F=
Π
−
P
Author name / Procedia Engineering 00 (2017) 000–000 9
− − =
∫
Ω S dS i I m FS
P
σ
σ
0 , 1 exp 1 0 (8) Where, the exponent m governs the scatter while the scale factor σ0 influences the mean value of the distribution.∫
Ω Ω = S m m dS I i IS
H
σ
σ
max , , 1σ
σ
D I I I tK
, max , max , , = (9)Knowing the maximal principal stress σI,max on the total surface, the fatigue strength defined σI,D can be calculated for a given failure probability in function of Kt,I,max and the stress heterogeneity factor Hm as:
−
Ω =H
P
S
S
K
mF m I t a I1
1
ln
0 1 max , , 0 ,σ
σ
(10)Figure 8: Experimental and prediction of the fatigue limit evolution as a function of Sa
According to Figure 8, the Sa parameter seems to correlate with the fatigue behaviour of the different tested batches. This diagram seems to follow the same trend as the Kitagawa-Takahashi diagram in which the fatigue strength is defined as function of the initial crack length or defect size. The endurance limit decreases slowly for low values of Sa then drops sharply when Sa exceeds a threshold value between 1 and 3.5µm.
Figure 8 also shows the first encouraging results using the surface probabilistic approach. Using the theory of the weakest link in the probabilistic framework makes it possible to take into account all potential initiation sites. It also makes it possible to directly consider the scale effect which is vital for the prediction of the fatigue strength of large machined components.
4. CONCLUSION
From the results of a vast experimental fatigue campaign carried out in plane bending on the aeronautical aluminium alloy Al7050-T7451 showing different surface profiles, the following conclusions can be drawn:
• The manual grinding operation results in a fatigue strength that is equivalent to a classical machining operation in the aeronautical industry that causes a surface roughness of Ra 0.6µm.
• The locations of the crack initiation zones are in agreement with the high stress areas identified by finite element analysis.
• The surface roughness parameter Sa show good correlation with the fatigue strength of the different batches tested. When the arithmetic mean height Sa is greater than a threshold value between 1 and 3.5µm the fatigue strength start to decrease more sharply.
• Approaches that consider only the most loaded zone seem to be not suitable for the prediction of the fatigue strength.
• A probabilistic approach using a finite element model base on the geometry of the real machined surface has been developed and gives encouraging results
Acknowledgements
This work was carried out within the FUI QUAUSI project with the support of industrial (Dassault Aviation, Europe Technologie, Figeac Aéro, Mecachrome, Spring Technologie, Precise, GEBE2, CETIM) and academic partners (LSN2-IUT Carquefou).
References
[1] Shahzad, M., Chaussumier, M., Chieragatti, R., Mabru, C., Rezai Aria, F., 2010, Influence of anodizing process on fatigue life of machined aluminium alloy, Procedia Engineering, 2: 1015–1024.
[2] Guillemot, N., 2010, Prise en compte de l’intégrité de surface pour la prévision de la tenue en fatigue de pièces usinées en fraisage, PhD Thesis, ENS Cachan.
[3] Tang, Z.T, Liu, Z.Q, Pan, Y.Z, Wan, Y., Ai, X., 2009, The influences of tool flank wear on residual stresses induced by milling aluminum alloy, Journal of Materials Processing Technology, 209: 4502–4508.
[4] Rao, B., Shin, Y.C, 2001, Analysis on high-speed face-milling of 7075-T6 aluminum using carbide and diamond cutters, International Journal of Machine Tools & Manufacture, 41: 1763-1781.
[5] Campbell, C.E., Bendersky, L.A., Boettinger, W.J, Ivester, R., 2006, Microstructural characterization of Al-7075-T651 chips and work pieces produced by high-speed machining, Materials Science and Engineering, A 430: 15–26.
[6] Arola, D., Williams, C.L., 2002, Estimating the fatigue stress concentration factor of machined surfaces, International Journal of Fatigue, 24:923-930.
[7] Neuber, H., 1961, Theory of Stress Concentration for Shear-Strained Prismatical Bodies With Arbitrary Nonlinear Stress-Strain Law, Journal of Applied Mechanics; 28:544.
[8] Souto-Lebel, A., 2014. Rôle de l’intégrité de surface dans la tenue en fatigue d’un acier bainitique après fraisage de finition, PhD Thesis, Cachan: ENS Cachan.
[9] Suraratchaï, M., Limido, J., Mabru, C., Chieragatti, R., 2008. Modelling the influence of machined surface roughness on the fatigue life of aluminium alloy. International Journal of Fatigue, 30:2119,2126.
[10] Ås, S. K., Skallerud, B., Tveiten, B. W., 2008. Surface roughness characterization for fatigue life predictions using finite element analysis, International Journal of Fatigue, 30:2200,2209.
[11] Little, R.E., Jebe, E.H., 1975. Statistical Design of Fatigue Experiments. applied science publishers Ltd., London.
[12] Griffiths, B., 2001. Manufacturing Surface Technology: Surface integrity and Functional Performance. London: Prenton Press. [13] Leach, R. K., 2013. Characterisation of areal surface texture. Berlin: Springer.
[14] Weibull W., 1951, A statistical distribution function of wide applicability. Journal of Applied Mechanics, 18, pp. 293-297.
[15] Pessard E, Abrivard B, Morel F, Abroug F, Delhaye P, 2014, The effect of quenching and defects size on the HCF behaviour of Boron steel. Int J Fatigue, Issue 68, pp. 80-89.
[16] Hild F., Billardon R., Marquis D. (1992). "Stress heterogeneity influence on failure of brittle materials." Comptes Rendus de l'Academie des Sciences, Serie II, 315, (1992), pp. 1293-1298.
![Table 1: Mechanical properties of the Al7050-T7451 Rolling direction σy [MPa] UTS [MPa] Elongation %](https://thumb-eu.123doks.com/thumbv2/123doknet/7427118.219502/4.816.291.526.100.335/table-mechanical-properties-rolling-direction-mpa-uts-elongation.webp)
![Risiko- & [und] Schutzfaktoren der psychischen Gesundheit humanitärer Einsatzhelfer : eine systematische Literaturübersicht](data:image/gif;base64,R0lGODlhAQABAIAAAP///wAAACH5BAEAAAAALAAAAAABAAEAAAICRAEAOw==)