HAL Id: hal-01411676
https://hal.inria.fr/hal-01411676
Submitted on 7 Dec 2016
HAL is a multi-disciplinary open access
archive for the deposit and dissemination of
sci-entific research documents, whether they are
pub-lished or not. The documents may come from
teaching and research institutions in France or
abroad, or from public or private research centers.
L’archive ouverte pluridisciplinaire HAL, est
destinée au dépôt et à la diffusion de documents
scientifiques de niveau recherche, publiés ou non,
émanant des établissements d’enseignement et de
recherche français ou étrangers, des laboratoires
publics ou privés.
Mining usage patterns in residential intranet of things
Gevorg Poghosyan, Ioannis Pefkianakis, Pascal Le Guyadec, Vassilis
Christophides
To cite this version:
Gevorg Poghosyan, Ioannis Pefkianakis, Pascal Le Guyadec, Vassilis Christophides. Mining usage
patterns in residential intranet of things. The 7th International Conference on Ambient Systems,
Networks and Technologies, May 2016, Madrid Spain. pp.6. �hal-01411676�
Available online at www.sciencedirect.com
Procedia Computer Science 00 (2016) 000–000
www.elsevier.com/locate/procedia
International Workshop on Big Data and Data Mining Challenges on IoT and Pervasive Systems
(BigD2M 2016)
Mining usage patterns in residential intranet of things
Gevorg Poghosyan
a, Ioannis Pefkianakis
b, Pascal Le Guyadec
c, Vassilis Christophides
daInsight Centre for Data Analytics, Ireland
bHewlett Packard Labs, USA
cTechnicolor Research, France
dINRIA, France
Abstract
Ubiquitous smart technologies gradually transform modern homes into Intranet of Things, where a multitude of connected devices allow for novel home automation services (e.g., energy or bandwidth savings, comfort enhancement, etc.). Optimizing and en-riching the Quality of Experience (QoE) of residential users emerges as a critical differentiator for Internet and Communication Service providers (ISPs and CSPs, respectively) and heavily relies on the analysis of various kinds of data (connectivity, perfor-mance, usage) gathered from home networks. In this paper, we are interested in new Machine-to-Machine data analysis techniques that go beyond binary association rule mining for traditional market basket analysis considered by previous works, to analyze indi-vidual device logs of home gateways. Based on multidimensional patterns mining framework, we extract complex device co-usage patterns of 201 residential broadband users of an ISP, subscribed to a triple-play service. Such fine-grained device usage patterns provide valuable insights for emerging use cases such as an adaptive usage of home devices, and also “things” recommendation.
c
2016 The Authors. Published by Elsevier B.V.
Peer-review under responsibility of the Conference Program Chairs.
Keywords: intranet of things; home device analytics; multi-dimensional association rules
1. Introduction
With the rapid growth of smart technologies, modern homes are gradually transformed into Intranet of Things. A variety of devices (smartphones, IPTVs, network extenders, cameras, utility meters, etc.) get connected via wireless or wired home networks to offer multiple (not always integrated) services (e.g., remote surveillance, home automa-tion). Connectivity of things as well as broadband access in homes are supported by residential gateways capable of monitoring the operations and the performance of the devices connected to them.
In this paper, we are interested in analyzing device usage logs in order to support emerging use cases in smart homes such as adaptive usage of home devices1 and “things” recommendation1. Such use cases fall within the wider area of human-cognizant Machine-to-Machine communication aiming to predict user needs and complete tasks without users initiating the action or interfering with the service. While it is not a new concept, according to Gartner cognizant computing is a natural evolution of a world driven not by devices but collections of applications and services that span across multiple devices in which human intervention becomes as little as possible by analyzing past human habits.
To realize this vision, we are interested in co-usage patterns featuring spatio-temporal information regarding the context under which devices have been actually used in homes. For example, a network extender which is currently
1tmcnet.com/tmc/whitepapers/documents/whitepapers/2014/10719-using-analytics-optimize-customer-experience-the-connected-home.pdf
1877-0509 c 2016 The Authors. Published by Elsevier B.V.
2 Author name/ Procedia Computer Science 00 (2016) 000–000
turned off, could be turned on at a certain day period (e.g., evening) when it has been observed to be highly used along with other devices (e.g., a laptop or a tablet). Alternatively, the identification of frequent co-usage of particular devices at a home (say iPhone with media player), could be used by a “things” recommender to advertise the same set of devices at another home (say another iPhone user could be interested in a media player).
We advocate frequent pattern and association rule mining techniques since we believe that they are more easily understood by both end-users (for raising awareness regarding device energy or bandwidth consumption) and devel-opers (for programming if this then that scripts of home automation), than the potentially more accurate but opaque Machine Learning techniques (e.g., classification). Traditional market basket analysis has been recently revised for extracting associations between users’ interactions (e.g., communication and entertainment services) and context (e.g., time periods) captured by mobile devices2,3, frequent co-occurring mobile context events (e.g., a user listens to music
during workdays, while driving)4 or frequent co-usage patterns of different appliances under various contexts5.
Un-like these works, we extract n-ary (vs. binary) patterns from device logs involving attributes of at least three distinct entities: Device, Context, and Activity. An extra Gateway dimension is also considered when extracting recurring patterns across homes. Rather than decomposing our analysis problem into several binary ones (Context × Activity, Context × Device, etc.), we leverage recent advances in constraint-based algorithms6,7 for mining arbitrary n-ary
relations. Our main contributions are:
1) We analyze a new dataset collected from home gateways, subscribers of a large European ISP (Section 2). It is a high variety dataset with device connectivity, performance and usage data (mainly numerical but also categorical) produced in high velocity (per 30 seconds) under normal service operation by an important number of gateways (201) on which a large number (2828) of fixed (e.g., desktops, laptops) and portable (e.g., tablets, smartphones) devices are connected, as well are also IPTVs and phones.
2) We introduce a discrete representation of gateway logs that is flexible enough to capture device activities spanning multiple contexts or vice versa (Section 2). We enable an on-demand generation of device usage logs that combines usage evidence from multiple raw data logs (unlike unique transactions in market-basket analysis), while controls the spatial and temporal log resolution.
3) We extract frequent n-ary patterns and rules from device logs within or across houses (Section 4). These patterns uncover that devices are more frequently co-used at low traffic data rates, close to the gateway, during evenings. These co-usage patterns are significantly different across homes and independent of the number of devices.
Our plans for future work are presented in Section 5. 2. Dataset Description
We analyze more than 21 million measurement reports collected over a 3-month period (February - April, 2014) from the home gateways of 201 residential broadband subscribers of a large European ISP, geographically distributed over 10 cities. Each gateway has an ADSL2+ modem or fiber WAN access link, 4 Ethernet ports, an 802.11b/g/n WiFi access point, FXO POTS ports to connect phones. An IPTV connects to the gateway through an Ethernet set-top box (STB) device. The 2/3 of our deployment gateways use fiber and the rest ADSL access technology.
The gateway reports for each device: a) the MAC address, b) the connection interface (Ethernet or WiFi), c) device names given by users (e.g., “Kelitas-iPad”). It also periodically reports every 30 seconds the traffic data rate in Kbps at both downlink (from the gateway to the device) and uplink directions and the signal strength (RSSI) for each wireless device associated with it. For each connected Ethernet device, gateways report every 1 minute the timestamped traffic counters in bytes for both downlink and uplink directions. Finally, the start time, duration, and direction (incoming or outgoing) of phone calls are reported, along with a flag indicating whether they have been answered or not.
1 2 3 4 5 6 7 8 10 13 16 20 30 40 50 Number of Devices 0 20 40 60 80 100
CDF WiFi & Eth
WiFi Eth Res. WiFi & Eth Res. WiFi Res. Eth
Fig. 1:Number of devices per home.
A device is defined by its MAC address- e.g., a laptop with WiFi and Ethernet interfaces appears as two devices. Out of the 2828 distinct devices, 69.5% are WiFi and 30.5% are Ethernet. The num-ber of WiFi and Ethernet devices per home varies from 3 to 50. Roughly 80% of the homes has more than 8 devices, as can be seen in Figure 1 (dashed lines). WiFi devices typically outnumber the Eth-ernet devices (typically at least a STB), and vary between 0 and 46 per home. Among the connected
devices, there are also WiFi extenders connected to the gateway via Ethernet or WiFi. Although we can identify the devices behind an extender, we cannot specify their physical interface; e.g., all the devices of a WiFi extender which
Author name/ Procedia Computer Science 00 (2016) 000–000 3 connects through Ethernet to the gateway, will appear as Ethernet devices. This justifies the high number of Ethernet devices that appear in some homes (up to 40 Ethernet devices in a single home).
In our analysis we distinguish between resident devices (owned and operated regularly by home residents), and guest devices, which are occasionally used and typically belong to visitors. Devices which are connected for6 7 days are labelled as guest, and the devices connected for more than 7 days are labelled as resident. Resident devices also include those permanently hosted in a home, such as desktop computers, regardless of their connection days. Figure 1 (solid lines) shows the distribution of the number of resident devices connected at each gateway (varies from 2 to 28). In the rest of the paper we focus only on resident devices.
3. Core Entities in Home Intranet of Things
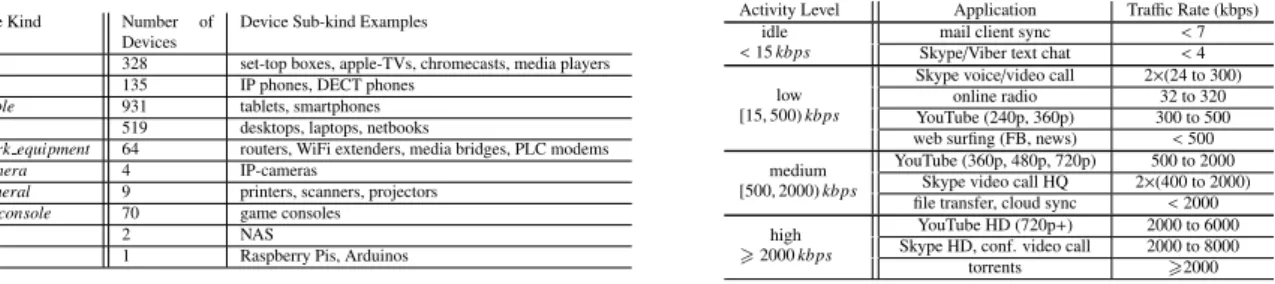
To represent device usage logs in residential Intranet of Things we rely on 4 types of entities shown in Ta-ble 1. Gateways are described by their identifier (Gid) and the broadband access type (Access ∈ { f iber, adsl}). Devices are described by their globally unique identifiers (Did), the gateway (Gid) and the physical interface (Port ∈ {wlan, eth, phone}) to which they are connected to, as well as, their MAC address (Mac). The need for globally unique Did stems from the fact that, devices may move across the homes, so the same MAC address may appear in more than one home. We also consider the device Kind and Vendor derived mainly by the MAC addresses. Table 2 describes the different device types observed in our dataset. Our gateways do not report any information regarding the device kinds. For all the devices with the exception of STBs, whose MAC addresses have been provided by our ISP, we have used a simple heuristic classification based on their MAC addresses and device names8. We have assessed the
high accuracy of classification results against a ground truth collected by surveys from 49 homes of our deployment. (a)Gateway. Gid Access g1 fiber g2 adsl g10 adsl (b)Device.
Did Gid Mac Port Kind Vendor d1 g4 00:22:3a:*...* eth tv Cisco d3 g54 phone phone d30 g2 9c:e6:35:*...* wlan portable Apple
(c)Context.
Did Begin End State Quality d30 5/3/2014, 23:30 6/3/2014, 00:10 connected high d30 6/3/2014, 00:10 6/3/2014, 00:20 connected medium d30 6/3/2014, 00:20 6/3/2014 00:40 connected low d30 6/3/2014, 00:40 6/3/2014, 07:00 disconnected d31 6/3/2014, 06:30 6/3/2014, 07:00 connected (d)Activity.
Did Begin End Activity d30 5/3/2014, 23:30 6/3/2014, 00:00 high d30 6/3/2014, 00:00 6/3/2014, 00:30 medium d30 6/3/2014, 00:30 6/3/2014, 00:40 idle d31 6/3/2014, 06:30 6/3/2014, 07:00 low
Table 1:Gateways, Devices, Usage Context and Activity sessions.
The Context and Activity of Table 1 capture information related to the actual device usage. Context records the contiguous time intervals (Begin and End timestamps) a particular device has been reported to be connected or dis-connected in (S tate). Other contextual information could be considered depending on the device type and the scope of analysis. For example, for WiFi devices the Quality of the received signal strength is an indicator of the device proximity to the gateway. In order to map RSSI to wireless link speed and quality, we use the thresholds presented in9. Period∈ {night; morning; a f ternoon; evening} or Weekday∈ {workday; weekend} represents useful temporal
context that can be easily derived from the session timestamps and included to the device usage logs. Note that each device could operate only under one context within the corresponding time-interval recorded in the table Context.
Activityrefers to the traffic rate of connected devices during contiguous time intervals (Begin and End timestamps). We discretize the cumulative traffic rates (downlink and uplink) generated by a data device into different Levels capturing general classes of applications that could run on devices10, as shown in Table 3. Note that, although the
instantaneous peak traffic of the above applications may exceed their data rate bin, our gateways report an average rate over a 30-second or 1-minute period, which falls into the above bins. The activity levels for STBs and IP phones vary from the ones specified in Table 3. We consider the STBs to be idle, when no content is being watched. During idle activity, there still can be some traffic (< 500 kbps) from STB firmware updates or from users browsing the menu. The activity level is high when a user is watching TV (rate> 500 kbps). Phone’s activity level is considered idle when there are no successful phone calls, and high when there are active calls. Also note that each device could exhibit only one activity within the corresponding time-interval.
The adopted discretization aims to reduce the inherent data noise and scarceness in order to improve the statistical significance and interpretability of extracted patterns. The proposed data representation, can flexibly capture complex usage logs in Intranets of Things where a device activity may span multiple contexts or vice versa. For example, a user may switch from checking email to video watching (activity changes) on her tablet, while she is close to the gateway (context remains the same). Or, a user may move from living room to the garden (signal quality and the context change), while she is watching a video (activity remains the same). More precisely, the usage logs of a device are generated from the recorded Context and Activity sessions using the following join condition: (C.Begin < A.End ∧ A.Begin < C.End). Since each device activity can be tracked only within a context, we need only to check
4 Author name/ Procedia Computer Science 00 (2016) 000–000
Device Kind Number of Devices
Device Sub-kind Examples
tv 328 set-top boxes, apple-TVs, chromecasts, media players phone 135 IP phones, DECT phones
portable 931 tablets, smartphones f ixed 519 desktops, laptops, netbooks
network equipment 64 routers, WiFi extenders, media bridges, PLC modems ip camera 4 IP-cameras
peripheral 9 printers, scanners, projectors game console 70 game consoles
nas 2 NAS
other 1 Raspberry Pis, Arduinos
Table 2:Overview of home device kinds.
Activity Level Application Traffic Rate (kbps) idle
< 15 kbps Skype/Viber text chatmail client sync < 7< 4 low
[15, 500) kbps
Skype voice/video call 2×(24 to 300) online radio 32 to 320 YouTube (240p, 360p) 300 to 500 web surfing (FB, news) < 500 medium
[500, 2000) kbps
YouTube (360p, 480p, 720p) 500 to 2000 Skype video call HQ 2×(400 to 2000) file transfer, cloud sync < 2000 high
> 2000 kbps
YouTube HD (720p+) 2000 to 6000 Skype HD, conf. video call 2000 to 8000 torrents >2000
Table 3:Activity levels and corresponding applications.
for time intervals of contexts that overlap those of activities. The granularity of temporal aggregations clearly affects the density of generated usage logs, and is guided by the objectives of our analysis.
4. Analysis of Device Co-usage
The analysis of usage logs in residential Intranet of Things involves different types of entities (e.g., Gateways, Devices, Context and Activity), which may be described by several attributes depending on the scope of the analysis. The more we zoom into device usage scenarios, the more attributes need to be considered. Rather than reducing the complexity of the n-ary usage logs analysis into a frequent binary pattern and association rule mining problem by converting n-ary to binary logs (e.g., Context × Activity, Context × Device)11,2,12,13,4,5, we rely on recent advances in
data mining over n-ary relations (e.g., Device × Context × Activity)6,7. Our choice is motivated by the need to employ
the same general purpose mining algorithms for serving different analytical use cases.
In general, n-ary usage logs are defined as subsets of the Cartesian Product of a number of finite and disjoint attribute domains: U ⊆ D1×... × Dn. Unlike extracting frequent co-occurring elements from the same domain (Di),
in our setting we are mining frequent sets of n-tuples (D1×... × Dn) in U (called n-sets). More formally, we are
interested in extracting patterns under the form of closed n-sets7: H = [X1, . . . , Xn] such that Xi ⊆ Di. H is called
a closed n-set iff (a) all elements of each set Xiare in relation with all the other elements of the other sets in U, and
(b) Xisets cannot be enlarged without violating condition (a). A notable characteristic of the Data-Peeler algorithm7 we employ for extracting closed n-sets is that, it enables us to consider user-defined (anti-monotonic) constraints on the relevancy of the mined collections of n-sets. We may ask for patterns with a minimal number of elements in some domains (e.g. with at least 2 devices) and/or patterns covering at least a given number of tuples in U. N-ary association rules are based on the notion of association which essentially boils down to closed n-sets defined on subsets of the original attribute domains. The frequency (support) of an association is the subset of the support domain used to count the association occurrences on the remaining domains on which it is defined. For formal definitions of a rule and frequencyreaders are referred to6.
We first study device usage patterns across all the homes of our deployment, which are needed in order to support “things” recommendation use cases. We seek to identify, what types of devices are co-used more frequently and at what time periods in day?Our analysis requires to extract n-ary associations from device usage logs defined over four domains: Gateway, Day, Device, Period. Since we are interested in frequent daily patterns across gateways, Gateway and Day are the support domains. For example, the support s({0f i0,0po0} × {0a f0,0ev0}) reflects the number of days across all gateways, that fixed (’fi’) and portable (’po’) devices in a home were co-connected at both afternoon (’af’) and evening (’ev’). Any subset of this n-set (e.g., s({0po0} × {0a f0,0ev0})) has support greater or equal than its superset.
['ph'] ['tv'] ['ph', 'tv'] ['po'] ['ph', 'po'] ['ne'] ['po', 'tv'] ['ne', 'ph'] ['ph', 'po', 'tv'] ['ne', 'tv'] ['ne', 'ph', 'tv'] ['fi'] ['fi', 'ph'] ['ne', 'po'] ['ot'] ['ot', 'ph'] ['ne', 'ph', 'po'] ['ga'] ['fi', 'tv'] ['fi', 'ph', 'tv'] ['ne', 'po', 'tv'] ['ne', 'ph', 'po', 'tv'] ['ga', 'ph'] ['ga', 'tv'] ['ga', 'ph', 'tv'] ['fi', 'po']
['ni'] ['mo'] ['mo', 'ni'] ['af'] ['af', 'ni'] ['af', 'mo'] ['af', 'mo', 'ni'] ['ev'] ['ev', 'ni'] ['ev', 'mo'] ['ev', 'mo', 'ni'] ['af', 'ev'] ['af', 'ev', 'ni'] ['af', 'ev', 'mo']
['af', 'ev', 'mo', 'ni'] 0.00 0.20 0.40 0.60 0.78
Fig. 2: Co-idle device usage patterns across all homes in time.
['d4'] ['d3'] ['d4', 'd3'] ['d1'] ['d1', 'd4'] ['d1', 'd3'] ['d1', 'd4', 'd3'] ['d2'] ['d4', 'd2'] ['d0'] ['d4', 'd0'] ['d5'] ['d5', 'd4'] ['ni'] ['mo'] ['mo', 'ni'] ['af'] ['af', 'ni'] ['ev'] ['ev', 'ni'] ['af', 'mo'] ['af', 'mo', 'ni'] ['ev', 'mo'] ['ev', 'mo', 'ni'] ['af', 'ev'] ['af', 'ev', 'ni'] ['af', 'ev', 'mo']
['af', 'ev', 'mo', 'ni'] 0.00 0.20 0.40 1.00
Author name/ Procedia Computer Science 00 (2016) 000–000 5 We next investigate, the activity level exhibited by connected devices. We first differentiate idle, from low, medium, high activity levels. Then we construct the usage logs including all instances when devices in a home are idle during a certain time period. A connected device is considered to be idle during a time period, if all the gateway reports during this period show the device to be in idle activity level. Two (or more) devices are co-idle at a certain time period if the above condition holds, and they overlap with the period under analysis. Figure 2 illustrates the heat map of the support of co-idle devices at different periods, e.g., the support s({0f i0,0po0} × {0a f0,0ev0}) is the number of days across
all the gateways, that fixed and portable devices were idle, at both afternoon and evening. For illustration purposes, we sort the heat map cells based on decreasing support order and omit the patterns with very low support (6 0.003).
Our analysis shows the devices with the longest idle times to be the IP phones and TVs, whose maximum support is 0.78 and 0.41, respectively. This behavior implies that TVs and phones are frequently connected, but rarely used. Portables (support ranges from 0.004 and 0.1) show longer idle times than fixed devices (support ranges from almost zero to 0.02). Network equipment shows relatively long idle times with supports between 0.02 and 0.08. Finally, game consoles are rarely observed idle (supports from 0.003 to 0.008) compared with the other device kinds. Figure 2 shows that for all devices apart from game consoles, the highest supports in decreasing order appear at night, morning, afternoon and evening. This implies that devices are typically inactive during nights and more active during evenings. On the contrary, the game consoles present the highest supports in reverse order (evening, afternoon, morning, night). This suggests that when residents in our deployment homes play video games, they usually don’t use other devices. We also observe that network equipment is co-idle with portable devices, which is expected since the traffic typically routes through the networking device to the gateway. The Quality dimension, which solely applies to wireless devices, was not considered so far, because 91% of our gateway reports for wireless devices are classified in the high quality category. The remaining 8.5% and 0.5% of records are classified in the medium and low categories, respectively.
We next perform an in-depth analysis of individual homes aiming to support home-automation use cases. We seek to identify, what types of devices are co-used more frequently, at what time periods in day and what is their activity level?We select as case study a home with 17 resident and 10 guest devices of various kinds and vendors (see Table 4) that in their majority use WiFi to connect to the gateway. The number of days that a device appears to be connected varies from 15 to the total 89 days of interest. Device ID Interface Device Kind Vendor Number of Days Connected
d0 WiFi portable AMPAK Technology 69 d1 Ethernet peripheral Fujitsu 46 d2 WiFi portable (iPhone) Apple 89 d3 Ethernet IPTV 87
d4 IP phone 89
d5 WiFi data Unknown 32 d6 WiFi portable (iPhone) Apple 68 d7 WiFi portable Samsung 74 d8 WiFi portable Samsung 56 d9 WiFi portable Sony 89 d10 WiFi data Azurewave Technologies 15 d11 WiFi portable Samsung 50 d12 WiFi fixed Hon Hai Precision 88 d13 WiFi fixed Intel 81 d14 WiFi fixed (laptop) GVC Corporation 68 d15 WiFi fixed Hon Hai Precision 46 d16 WiFi media player Liteon Technology 89
Table 4: Overview of devices in our case study home. Figure 3, illustrates the heat map plot of the
support of co-idle devices at different time peri-ods, where the support domain is the Day. As ex-pected, Phone (d4) and STB (d3) have the longest idle times. Besides these devices, the peripheral d1 and the data device d5 exhibit the longest and the shortest idle times, respectively. Interestingly, we do not observe any strong correlation between the number of connected days and the idle times. For example, the peripheral d1, is connected less days than the portables d0 and d2. For all the devices,
the highest supports in decreasing order appear at night, morning, afternoon and evening, as shown in Figure 3. We consider two (or more) devices to be co-active with activity level x at a certain time period, if they have overlapping activity intervals at level x, during this period. In the heat map of Figure 4(a) we present the co-active devices along with their activity levels, in decreasing support of0high0activity level. The support domain is the Day,
and we filter out co-active devices with less than 4 days. In the sequel, we focus on high, medium activity, in the evenings. As we can observe in Figure 4(a), almost all co-active device sets include STB (d3) and phone (d4). The highest support is s({0d160,0d30} × {0hi0})= 0.51. This means that, the STB and the media player show high co-activity
level, for 45 out of the 89 days of monitoring period. The large co-activity supports for phone and STB is justified from the fact that, we define only idle and high activity levels for those devices. Apart from these frequently used devices, a media player and a fixed device ([’d16’, ’d12’]), exhibit a high activity level with 4 days of support.
Figure 4(b) depicts device co-usage at low activity, in decreasing support (support domain is again the Day). Due to space restrictions, we present only the 15 highest support device sets. Our results show two key differences compared with the high activity level patterns of Figure 4(a). First the supports are overall higher, with the peak support s({0d20,0d90} × {0lo0})= 0.94 (83 days). This implies that co-used devices operate more at low than high activity level,
in our case study home. Second, the device sets do not include STB and phone because low activity does not apply to them. Device sets include portable, fixed, media player devices and their combinations. We finally observe co-active devices at different activity levels with the peak support to be 65 days (s({0d160,0d120} × {0low0,0medium0})= 0.73).
6 Author name/ Procedia Computer Science 00 (2016) 000–000 ['d16', 'd3'] ['d12', 'd3'] ['d4', 'd3'] ['d15', 'd3'] ['d9', 'd3'] ['d13', 'd3'] ['d14', 'd3'] ['d16', 'd4'] ['d12', 'd4'] ['d16', 'd12'] ['d16', 'd4', 'd3'] ['hi'] ['hi', 'me'] 0.00 0.20 0.51
(a) (in decreasing high level)
['d2', 'd9'] ['d16', 'd2'] ['d16', 'd9'] ['d12', 'd2'] ['d16', 'd2', 'd9'] ['d16', 'd12'] ['d12', 'd9'] ['d14', 'd2'] ['d14', 'd9'] ['d13', 'd9'] ['d16', 'd13'] ['d16', 'd14'] ['d16', 'd12', 'd2'] ['d13', 'd2'] ['d16', 'd7'] ['lo'] ['me'] ['lo', 'me'] 0.000.200.40 0.60 0.94
(b) (in decreasing low level)
Fig. 4: Co-active patterns during evening for case study home.
Sony mob. iPhone evening,morning Liteonplayer
afternoon,evening
Fig. 5: Association rules graph for our case study home. We observe the activity with the peak supports to be 0.9, 0.67, 0.51,
0.4 for evening, afternoon, morning and night. Although, there are common co-activity patterns across periods, residents co-use different devices at different times, which calls for different home profiling among time periods.
Figure 5, illustrates the n-sets of our case study home using hy-pergraph diagram of rules with support and confidence of at least 0.5. We focus only on the temporal device co-usage, without con-sidering the activity level while always-connected IPTV and phone devices are excluded from our analysis. Each vertex represents a set of devices that appear either in the head or the body of an ex-tracted rule. A hyper-edge represents all possible temporal periods for which devices in n-sets have been observed co-active. Note that hyper-edges are undirected since the confidences of the extracted rules which have the set of devices represented by a vertex as head or body, are similar. The hypergraph of our case study, includes a media player (d16) and two portable devices (iPhone d2, Sony d9). Rules’ supports range from 0.5 to 0.63 and the confidences from 0.5 to 0.78. More precisely, the activity of the media player at a certain time period is correlated (with confidence from 0.5 to 0.78) with the iPhone usage at another period (and vice versa), for
evening, morning and afternoon periods. The rule with the highest confidence (0.78) shows that if the media player is active in the afternoon, then the iPhone will be used in the evening (d16, a f ternoon → d2, evening). The largest hyper-edge represents the co-activity of the media player, Sony portable (with confidence from 0.6 to 0.74) and iPhone, Sony portable (with confidence from 0.62 to 0.73), during afternoon and evening.
We have performed the analysis on a Python and MongoDB 2.4 implementation on a Dell Latitude E5430. For our case study home the log generation from one day and three months of raw records took correspondingly ∼30 seconds and ∼2.5 hours. The rule mining, implemented in C++6, took less than 5 seconds for all three-dimensional logs. 5. Summary
In this paper, we have explored n-ary association rules for mining device usage patterns in residential Intranet of Things. These patterns provide valuable insights to uncover daily practices of residents without employing intrusive home sensors. Several plans for future work are foreseen. First, our gateways currently report only network-level feedback. We could enhance the dimensions of our analytics with application-level gateway feedback, or reports from other types of devices as home sensors. Second, our proposed use cases mainly apply to devices connected to the gateway. We foresee a unified Intranet of Things architecture where “things” can talk also to each other, thus enabling applications over an even more diverse set of devices.
Acknowledgements
This work was partially funded by the European ICT FP7 User Centric Networking project (grant no. 611001). References
1. L. Yao, Q. Z. Sheng, A. H. H. Ngu, X. Li, Things of interest recommendation by leveraging heterogeneous relations in the internet of things, in: ACM Transactions on Internet Technology, 2015.
2. H. Ma, H. Cao, Q. Yang, E. Chen, J. Tian, A habit mining approach for discovering similar mobile users, in: ACM WWW’12. 3. X. Li, H. Cao, E. Chen, H. Xiong, J. Tian, Bp-growth: Searching strategies for efficient behavior pattern mining, in: IEEE MDM’12. 4. V. Srinivasan, S. Moghaddam, A. Mukherji, K. K. Rachuri, C. Xu, E. M. Tapia, Mobileminer: Mining your frequent behavior patterns on your
phone, in: ACM UbiComp, 2014.
5. S. Rollins, N. Banerjee, Using rule mining to understand appliance energy consumption patterns, in: IEEE PerCom’14. 6. K.-N. Nguyen, L. Cerf, M. Plantevit, J.-F. Boulicaut, Multidimensional association rules in boolean tensors., in: SIAM SDM’11.
7. L. Cerf, J. Besson, C. Robardet, J.-F. Boulicaut, Data-Peeler: Constraint-based Closed Pattern Mining in n-ary Relations, in: SIAM SDM’08. 8. G. Poghosyan, Device analytics in home networks, in: EPFL Master’s Thesis 2014.
9. I. Pefkianakis, et al., Characterizing home wireless performance: The gateway view., in: IEEE INFOCOM’15. 10. What speeds do I need for Skype, Netflix, video games, etc.?, support.speedtest.net.
11. H. Cao, T. Bao, Q. Yang, E. Chen, J. Tian, An effective approach for mining mobile user habits, in: ACM CIKM ’10.
12. S. Nath, Ace: Exploiting correlation for energy-efficient and continuous context sensing, in: ACM MobiSys ’12.
13. L. Ong, M. Berg´es, H. Y. Noh, Exploring sequential and association rule mining for pattern-based energy demand characterization, in: ACM BuildSys’13.