HAL Id: hal-00831370
https://hal.archives-ouvertes.fr/hal-00831370
Submitted on 6 Jun 2013
HAL is a multi-disciplinary open access archive for the deposit and dissemination of sci-entific research documents, whether they are pub-lished or not. The documents may come from teaching and research institutions in France or abroad, or from public or private research centers.
L’archive ouverte pluridisciplinaire HAL, est destinée au dépôt et à la diffusion de documents scientifiques de niveau recherche, publiés ou non, émanant des établissements d’enseignement et de recherche français ou étrangers, des laboratoires publics ou privés.
Flow regime associated with vertical secondary
migration
Guy Vasseur, Luo Xiaorong, Jianzhao Yan, Didier Loggia, Renaud Toussaint,
Jean Schmittbuhl
To cite this version:
Guy Vasseur, Luo Xiaorong, Jianzhao Yan, Didier Loggia, Renaud Toussaint, et al.. Flow regime associated with vertical secondary migration. Marine and Petroleum Geology, Elsevier, 2013, 45, pp.150-158. �10.1016/j.marpetgeo.2013.04.020�. �hal-00831370�
Flow regime associated with vertical secondary migration
Guy Vasseur, Sisyphe, Univ. Paris 6, France
Xiaorong Luo & Jianzhao Yan , Inst. Geol. Geophy, CAS, Beijing, China Didier Loggia, Univ. Montpellier 2, France
Renaud Toussaint & Jean Schmittbuhl, IPGS, CNRS, EOST, Univ. Strasbourg, France
Corresponding author: Guy Vasseur, 343 rue Georges Cuvier, 34090 Montpellier, France. Mail: [email protected], tel: 33467792389.
Abstract Secondary migration is defined as the movement of hydrocarbons through relatively permeable rocks from source to trap: a two-phase flow within a porous medium. Depending on the geometry and capillary pressure distributions of carrier beds, secondary migration has both vertical and lateral components. The present paper focuses on that part of the migration where the movement is mainly vertical. Its objective is to propose a description of the dynamics governing the vertical part of secondary migration based on the main physical aspects of two-phase flow in a homogeneous porous medium. The study is illustrated by laboratory observations performed in a vertical, 2-D Hele-Shaw cell filled with a transparent porous medium where the flow of dyed oil invading a wetting fluid is visually observed. These observations help us to understand the effect of buoyant, capillary and viscous forces on the resulting flow, the relative importance of which is characterized by non-dimensional numbers. Extrapolating these observations to natural media, it is proposed that vertical secondary migration can be described as a percolation of disconnected and vertically-elongated stringers. These stringers do not move continuously but as a succession of snap-off and re-feeding events which result in a jerky upward movement. Using parameters characterizing the physical properties of the fluid and of the porous medium, the geometry and the dynamic behavior of the stringers are estimated. The width of stringers occurring during secondary migration in geological media is centimetric and their vertical size ranges from several centimeters to a few meters. An upper limit of the mean upward velocity of stringers is proposed, as well as an estimate of their spatial density and of the minimum, average horizontal distance (decametric) between two stringers. The stringers are sparsely distributed, resulting in a low average oil loss and a high efficiency of the vertical migration process.
Keywords: secondary migration, two-phase flow, porous medium, Bond number, capillary number
1. Introduction
Secondary migration is the process by which oil expelled from low permeability source rocks, finds a path through carrier beds towards accumulation and traps (Schowalter, 1979; England et al., 1987; Dembicki and Anderson, 1989; England et al., 1991; England, 1994; Welte et al., 2000). There is a general consensus that secondary migration occurs as a separate phase flow through the water-filled pores of the carrier(Mann, 1997), although there are alternative hypotheses such as migration in solution (Selley, 1998); this can work only for lighter components of hydrocarbons, partly miscible with the surrounding water.
two phenomena. Due to their low density, hydrocarbons expelled into low capillary pressure units such as sandstones rise mainly vertically until they encounter capillary pressure barriers such as mudstones. At this point, lateral migration of hydrocarbons with an important horizontal component can occur. The present paper is focussed on that part of migration where the
movement is mainly vertical. Its objective is to propose a description of the dynamics governing the vertical part of secondary migration, based on the main physical aspects of two-phase flow in porous media. The study of lateral migration imposed by the presence of sealing rocks and resulting in important horizontal movement has been the subject of other experimental studies (Catalan et al, 1992; Thomas and Clouse, 1995; Yan et al, 2012).
From a physical point of view, vertical secondary migration can be reduced to a specific case of two-phase flow where two immiscible fluids are flowing in the porous space. More precisely, since the porous medium is initially saturated with water wetting the grains of the porous medium and the grain surfaces have a water-wetting behavior, secondary migration is a process of
invasion by a non-wetting fluid (Dembicki and Anderson, 1989; Catalan et al., 1992; Carruthers and Ringrose, 1998; Luo et al. 2004). A very specific property of this flow is that the invading fluid has a density lower than that of the expelled fluid. Buoyancy forces therefore play a major role as the motor of this invasion, with capillary and viscous forces providing opposing drag forces. The relative importance of these various forces may be characterized by non-dimensional numbers (Wilkinson, 1984; Hirsch and Thompson, 1995; Thomas and Clouse, 1995; Meakin et al, 2000). Here, we are only concerned with two-phase flow of oil and water and the possible presence of gas is not discussed.
The main objective of this paper is to demonstrate the main physical aspects of flow as observed in physical experiments and to synthesize studies concerning two-phase flow. Orders of
magnitude of the relevant physical parameters that may occur in the subsurface during natural secondary migration are obtained. In order to illustrate the present study, we make use of
laboratory observations performed in a vertical Hele-Shaw two-dimensional (2D) cell filled with a transparent porous medium. Dyed oil is injected at the bottom of the cell, allowing direct visualization of the flow. The description of the cell is given in Appendix A. The processes occurring in the cell give a visual illustration of the statements used here to characterize the flow properties.
The geometry of the flow, its dynamics and its time scales are discussed as a function of non-dimensional numbers describing the relative importance of the forces acting at micro-scale. On the basis of these non-dimensional numbers, an extrapolation of the flow characteristics to the actual conditions of natural hydrocarbon migration is proposed. This extrapolation shows that the vertical migration of hydrocarbon leads to the formation of disconnected oil bubbles, the
geometry of which can be assessed. The velocity of these bubbles, their pathways and their evolution with time through possible fragmentation and reconnection, are fundamental questions on which experimental and theoretical physics give interesting clues.
2. Micro-physics of oil migration and non-dimensional numbers Bo and Ca
compared to surrounding water. Forces slowing the movement are viscosity (interaction with porous framework) and capillarity due to surface forces at the interfaces between the various fluids. These depend on a large number of parameters characterizing both the porous medium and the fluids. Table 1 gives the main parameters relevant to the experimental results used as a
support for this study (displayed on Figs. 1, 2, 3 and 4). Table 2 gives the corresponding
parameters applicable to natural migration as derived from generally accepted values for natural reservoirs. The fluid properties (viscosity, surface tension and density difference) correspond to typical properties expected in natural conditions (Hantschel and Kauerauf, 2007) and are about the same in both experimental and natural cases (Tables 1 and 2). This is not the case for the pore size of the porous medium - and for the related parameters - which is larger in experiments than those in natural conditions. As explained below, this discrepancy is associated with the
requirements of short-term laboratory experiments
Despite the differences in experimental and subsurface conditions, the understanding of the micro-physics and the introduction of characteristic ratios allows us to reconcile apply results from experimental physics to natural phenomena. In fact, the characterization of two phase flow in porous media can be simplified by the introduction of two non-dimensional numbers
Table 1
Parameters applicable to the laboratory experiments illustrated by Fig. 1 to 4
Table 1-1 Parameters for the experiment shown on Figure1
Variable Unit Value
g gravity acceleration ms-2 9.81 density difference kg m3 208 surface tension N m-1 0.0289 pore diameter mm 0.6-0.8
Bo Bond number 8.65E-3
viscosity of oil Pas 0.00169
Porosity 0.36 F Coefficientfor permeability 395 k Permeability m2 3.10E-10 Fig1a Fig1b Injection rate ml/mn 0.1 3 q Injection velocity at
5cm of point source m s-1 3.54E-6 1.06E-4 Ca Capillary number 8.17E-5 2.45E-3 Table 1-2 Parameters for the experiment shown on Figure 2
Variable Unit Value
injection rate ml/mn 0.5 q injection velocity at 5cm m s-1 1.77E-5 Ca Capillary number 4.09E-4
Fig2a Fig 2b Fig 2c
bead
diameter mm 1.0-1.2 1.2-1.5 1.5-2.0 Bo Bond
number 2.14E-2 3.17E-2 5.41E-2
Table 1-3 Parameters for the experiment shown on Figure 3
Variable Unit Value
injection rate ml/mn 0.5 q injection velocity at 5cm m s-1 1.77E-5 Ca Capillary number 4.09E-4 bead diameter mm 1.5-2.0 Bo Bond number 5.41E-2 finger height mm 16.2
Table 1-4 Parameters for the experiment shown on Figure 4
Variable Unit Value
injection rate ml/mn 0.05 q velocity in the main part m s -1 1.11E-6 Ca Capillary number 2.75E-5 bead diameter mm 0.8-1.0 Bo Bond num. 1.43E-2
stringer width mm 5.1 stringer height mm 31.5
V/ Instantaneous Velocity m s-1 1.73E-3 D
Distance between stringers
Table 2
Parameters applicable to actual migration
Variable unit Value
g gravity acceleration ms -2 9.81 density difference kg m 3 200 surface tension N m -1 3E-2
viscosity of oil Pas 1E-2
Porosity 0.1
F coefficient for
k 3650
pore size mm 0.5 0.05 0.005
Bo Bond number 1.64E-2 1.64E-4 1.64E-6
stringer height mm 31 306 3060
stringer width
3D mm 3.4 3.0 2.6
k Permeability m2 6.9E-12 6.9E-14 6.9E-16
q flux from
source rock m s
-1
8E-15 8E-16 8E-15 8E-16 8E-15 8E-16 Ca Ca number 9.72E-11 9.72E-12 9.72E-11 9.72E-12 9.72E-11 9.72E-12
V/ instantaneous rising veloc. m s
-1
1.35E-5 1.35E-5 1.35E-7 1.35E-7 1.35E-9 1.35E-9 Ns
surface density of stringers
m-2 5.06E-5 5.06E-6 6.78E-3 6.78E-4 9.1 E-1 9.1E-2
D
distance between stringers
2.1 The Bond number
The Bond number Bo characterizes the ratio of gravity forces to capillarity at the pore scale. It is given by
Bo=2 g/ (1),
being the density difference, the pore size, the surface tension and g the acceleration of gravity.
For the experimental cell, the parameters are presented in Table 1 and, for natural migration, in Table 2. The main fluid parameters characterizing the flow are the density difference between water and oil and the oil-water interfacial tension ; average values g cm-3 and
m-1 are chosen as typical of natural hydrocarbon fluids (Danesh, 1998). These values
also apply to the present experiments. The key parameter considered in this study is the pore size related to the size of grainsIn the experiments, the pore size is defined by the bead radius which may be chosen in the range 0.1mm to 1mm, corresponding to Bond numbers ranging from 1.1 ×10⁻³ to 5.4 ×10⁻². Since the experiments have to be performed in a reasonably short time span (hours to days), it is necessary to use relatively large bead radii, implying relatively large permeability coefficients. In the case of natural migration, the carrier pore size is assumed to lie in the range 5-500 µm, leading to a Bo number in the range 1.6×10⁻⁶ to 1.6×10⁻². The size of the beads used in experiments is relatively large compared to that of natural porous media (0.005 to 0.5 mm, see Table 2).
2.2 The capillary number
The non-dimensional capillary number Ca characterizes the ratio of viscous forces to capillary forces at pore level. It is given by:
Ca =q 2/(k) (2),
where is the dynamic viscosity of the fluid, q is flux per unit surface (in m s-1) or Darcy
velocity and k the permeability of the porous medium. The viscosity of natural oil at depth may be estimated as 2 ×10⁻³ Pa.s (Ungerer et al, 1990). In natural media, k can be evaluated as a function of the pore size as 2/F, F being a geometrical factor of the order of 103 to 102 , taking
into account the porosity and the tortuosity of pore channels. Ca reduces to Ca =Fq/ (Hantschel and Kauerauf , 2007). In papers dealing with physical aspects of multiphase flows, the capillary number is often defined as C =q/, omitting the factor F (Wilkinson, 1986). In the present paper, the factor F is evaluated as a function of the porosity by the law F = 45 (1-)2 / 3. This
formula, known as Ergun’s formula (Ergun, 1952), is a specific application of the Koseny – Carman permeability estimate (de Marsily, 1981) for porous media composed of mono-dispersed packed spheres, with the sphere diameter.
Again, the relevant parameters for experiments and natural phenomena are given in Tables 1 and 2 respectively. Since, in the experimental cell, oil is injected at a point source, the flow per unit
surface is estimated at a given distance from the point source. In the vicinity of this point source (for a few cm) we can assume a radial flow leading to a local Ca number. For most of the experiments presented here, this Ca number is on the order of 10-5 to 10-4. The evaluation of the natural flux of oil during migration is a rather difficult task. A conservative estimate starts from the expulsion rate from source rocks qs. From England et al (1991), qs can be estimated to 8×10
-15
m3m-2s-1 (or m s-1) to 8×10-16 m s-1. The corresponding capillary number Ca is of the order of 10
-10
to 10-12.
At this point, it must be realized that the Ca number relevant to laboratory experiments is much larger (about 10 orders of magnitude higher) than actual values occurring in geological situations. Due to limitations in the monitoring of fluid pumps and limited observation time, it is clearly impossible to simulate the extremely low flow rates occurring in actual migration. Laboratory experiments such as the ones presented here are therefore supports which help us to understand the actual phenomena.
The extremely low value of Ca expected in natural situations seems to indicate that viscous effects are completely negligible compared to capillary effects and that oil flow is entirely governed by the trade-off between the acting force (buoyancy) and the capillary resisting force. However, it must be realized that the estimated flow qs corresponds to an average over a time
period of the order of 1013s (i.e. of million years, My) and over horizontal surfaces of some 108 m2 (10km×10km). Focusing of flow pathways may locally result in higher flow rates. Moreover, as will be discussed later, the flow itself is probably not continuous in time but is likely to occur as a succession of sudden, unstable bursts; therefore in particular places and at particular times, the flow may be much higher and the importance of viscosity cannot be completely neglected (Hantschel and Kauerauf , 2007). During such bursts, the instantaneous velocity reflects the competition between buoyancy and viscosity during changes which occur at the oil-water interface along pore-scale menisci, and is independent of the source flux. In real situations, such rapid velocity changes would be independent of the rate at which oil is expelled from source rocks. They could therefore be comparable in both experiments and in natural situations.
3. Dynamic flow regime
3.1 Stability of the flow in relation to Bo and Ca
The physical aspects of two-phase flow in porous media have been intensively studied using laboratory experiments (Lenormand et al, 1988; Luo et al, 2004, 2007a). In the geometry relevant to secondary migration, oil invades a mostly water saturated medium from below. Since oil is less dense than water, gravity tends to produce instability in this geometry. However, since oil (the invading fluid) is more viscous than water, viscous pressure differences tend to stabilize the flow.
When the invading flux is large, the oil water interface is stable (piston-like invasion) because the viscous effects of the pressure gradients dominates (Løvoll et al. 2004, 2010; Toussaint et al. 2011). At lower flux, viscous effects become less important and the result is an unstable behavior: gravitational fingering occurs, resulting in a few (or even a single) oil fingers rising through the water (Lenormand, 1985; Hou et al, 2005). It is predicted by theory and verified by
laboratory experiments that these two domains (stable and unstable displacement) are separated in the Ca vs Bo phase diagram (Tokanaga et al, 2000; Luo et al., 2004): for Ca>Bo the stable behavior dominates whereas for Ca<Bo it is unstable. This would be the opposite in situations where water is pumped back into the oil, and where a low-viscosity fluid displaces a more viscous one, with gravity stabilizing or not playing a role (e.g. experiments of Méheust et al. (2002), Løvoll et al. (2004), Toussaint et al. (2005), Løvoll et al. (2010)).
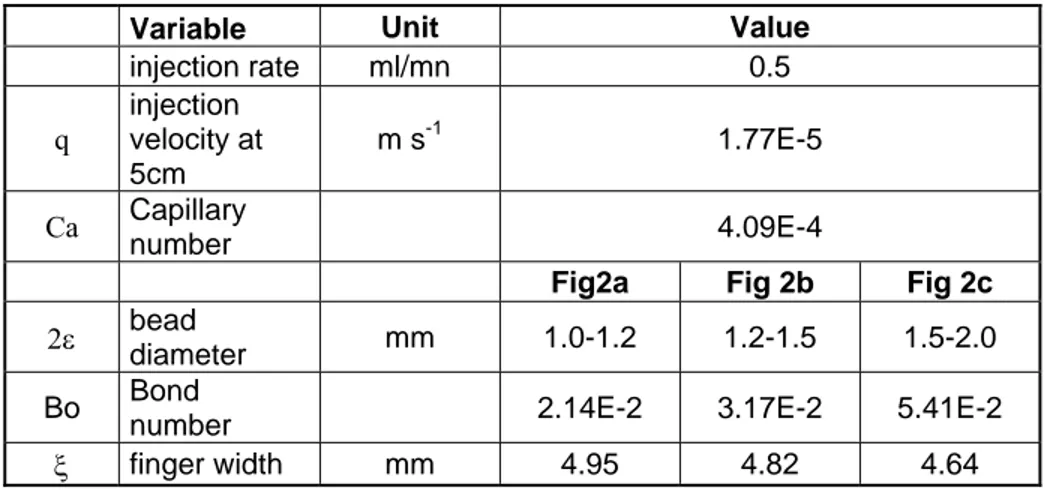
For viscous oil displacing less viscous water (i.e. the role of relatively large Ca), the stabilizing role of viscosity is illustrated on Fig.1, which presents the invasion of oil by point injection in the experimental 2D cell. Whereas the other properties of the model are the same, two values of the injection rate are used and illustrated in Figs.1a and 1b. It is clear (Fig. 1b) that, near the injection point source, the pattern of invading oil at high injection rate tends to follow a radial structure (Ca is larger near the point source). On the contrary, at low injection rates (Fig 1a), except near the injection point, a single narrow oil finger rises across the cell and the unstable regime clearly dominates. The fact that a single finger is observed to rise is not an artifact due to point source injection, as will be discussed later (Fig.4). Although the Ca values related to experiments
(generally 10-3 to 10-5) are much larger that in natural cases, these experiments confirm that when Ca<<Bo, the flow of oil is unstable and characterized by fingering.
Natural oil migration is characterized by extremely small values of Ca compared to Bo (typically Bo~10-4 whereas Ca~10-11). Since natural migration occurs for Ca<<Bo, it is reasonable to
extrapolate this theoretical and experimental result to extremely low Ca values and to state that natural oil migration does indeed belong to the unstable domain.
Figure 1. 2D invasive plume visualized by red oil obtained in the same medium (glass beads of 0.6-0.8mm diameter) with two injection rates (cf parameters of Table 1-1). The dimension of the
cell is 30cm wide and 35cm height. The medium is water-saturated prior to the injection. The injection point is shown by an arrow. 1a: injection rate of 0.1ml/mn. 1b: injection rate of 3 ml/mn. Note that low injection rate (Ca<<Bo) is characterized by high instability and the rising of a single finger whereas high injection rate (Ca~Bo in the vicinity of the injection point) gives a relatively regular invasion pattern.
3.2 Invasion percolation and width of fingers
An alternative to laboratory experiment for obtaining further insight to the nature of two-phase flow with such small Ca numbers is to base the analysis on the physical process called “Invasion Percolation (IP) in a Gradient” (Wilkinson, 1986; Hirsch and Thompson, 1995; Meakin et al., 2000; Carruthers, 2003; Zhou et al., 2006). This process can be thought of as an asymptotic behavior for negligible viscous effects (limit Ca=0). Invasion percolation is easy to simulate numerically. It has been used to study the geometry of the pathways associated with the
instability of a two-phase flow, notwithstanding its dynamic aspects (Frette et al, 1989; Zhou et al., 2006). Nevertheless, it is a very interesting tool for dealing with migration pathways
associated with complex geometrical structures (Luo et al, 2007b; Corradi et al, 2009).
A basic result of IP in homogeneous porous media (Frette et al, 1989; Birovljev et al, 1995; Zhou et al, 2006) is that gravity destabilizes the upward flow of light and non-wetting fluid (oil)
invading a wetting fluid. This instability induces oil fingers with a width on the order of:
.Bo- (3)
where acritical percolation exponent, is 4/3 in 2D and 0.88 in three dimensions (3D). It can be seen that this estimated width is only weakly dependent on the pore size since it varies as a, with a = -0.14 in 2D and 0.064 in 3D.
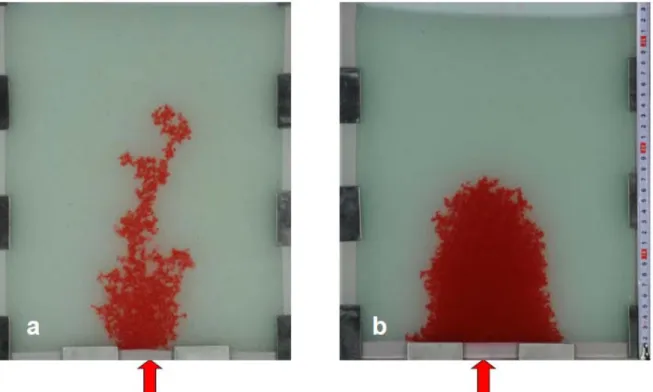
The validity of this relation was verified using numerical simulations on regular networks (Zhou et al, 2009) as well as both 2D and 3D experiments on porous media subjected to immiscible flow (Frette et al, 1992 ; Yan et al., 2012). This is illustrated by the experimental results
displayed on Fig. 2; for three experiments carried out using three bead dimensions, the width of the rising finger is of the order of 1 cm. As shown on Tables 1-2, the value of evaluated from equation (3) is about 5 mm for the porous medium used. The differences between the three cases presented on Figs. 2a, b and c are quite small, although it seems that the width decreases with increasing size of beads. The observed width is about 1cm, which is of the order of magnitude predicted by equation (3).
These ideas can also be applied to natural migration using the 3D approach, i.e. 0.88. Using previous values of capillary tension and as stated in Table 2, finger widths of several mm are expected to occur for a wide range of pore size values (few m to mm), although this will also depend on the degree of heterogeneity of the porous medium. When the medium has a broad pore size distribution, the width of fingers is increased whereas, for a narrow distribution, each finger tends to be reduced to a spike: in other words, disorder tends to scatter the fingers (Zhou et al, 2006).
Another fundamental factor is the degree of structural heterogeneity affecting the porous medium because of its sedimentation, burial and tectonic history (Carruthers and Ringrose, 1998). In complex depositional environments, pathways follow permeable sand bodies and lateral migration may become dominant. The present study cannot describe the dynamics of flow for such complex situations, although powerful simulation tools based on invasion percolation can be used to study the geometry of such pathways (Luo et al, 2007b; Corradi et al, 2009).
Figure 2. Three examples of rising finger (cf parameters of Table 1-2) for the same injection rate (0.5 ml/mn) but slightly different porous media. The three figures correspond to three bead sizes: 1-1.2mm (Fig. 2a), 1.2-1.5mm (2b), 1.5-2mm (2c)
3.3 Fragmentation of rising fingers
Whereas invasion percolation predicts that invasive clusters are continuously growing structures, experiments performed in 2-D and 3-D cells clearly show that fingers of non-wetting fluid are not continuous; they are in fact divided in several disconnected regions which are permanently being reconnected and fragmented. This fragmentation is an essential feature of the fluid displacement (Meakin et al, 2000): if a finger did not fragment, then its buoyancy force would continuously increase. These fragmentation and re-connection phenomena are not accounted for by standard invasive percolation theory. However, they can be explained by advanced concepts of invasion percolation taking into account both the advance of non-wetting fluid and its retreat, as proposed by Birovljev et al (1995) and Wagner et al (1997). The case of flow with snap-off in rough fractures has also been considered by Schmittbuhl et al. (1998) and Auradou et al. (1999, 2003). Experimentally, snap-off in porous media has been shown to affect the size distributions of the trapped, non-wetting clusters, which affects the transport properties (Tallakstad et al., 2009a, 2009b; Jankov et al., 2010). This was also observed in numerical Lattice Boltzmann two-phase simulations (Aursjø et al., 2010).
Physically, fragmentation occurs when, and where, the wetting fluid (i.e. water) is able to overcome the surface tension offered by the meniscus of the non-wetting cluster. This happens when the buoyancy pressure exerted by a cluster is of the order of the capillary pressure exerted on a pore throat. This occurs when the height of the cluster is of the order of /Bo and the size
distribution of fragmented clusters can be described by simple scaling laws (Wagner at al, 1997).
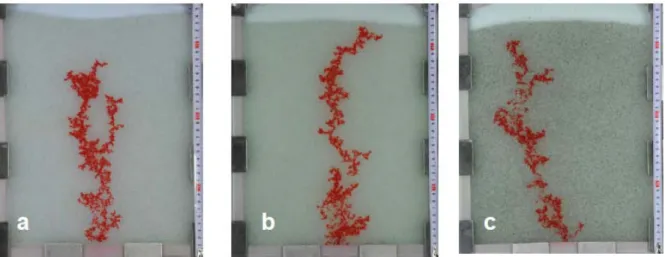
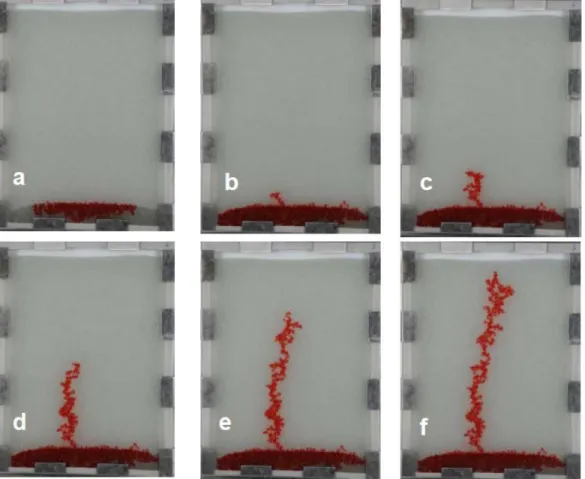
Some examples of snap-off and division of a rising finger are illustrated on Fig. 3: it is clear from these five instantaneous snapshots during the same experiment that, at some moment, the finger becomes disconnected in several segments which are on the order of a few cm long. The
application of the law:
= /Bo (4)
results in predicting values around 2 cm (Tables 1-3), which is the correct order of magnitude. When applied to natural oil migration, for the range of parameters of interest presented on Table 2, the vertical size of clusters = /Bo is 3 cm to 3 m. Compared to its width (of the order of 3 mm), the cluster formed by the pores invaded by oil can be described as a narrow stringer rising upwards.
Figure 3. Snap-shots of the same experiment using beads of 1.5-2mm diameter, observed at various instants labelled a,b,c,d,e,f (cf parameters of Table 1-3). Observe the fragmentation of the finger.
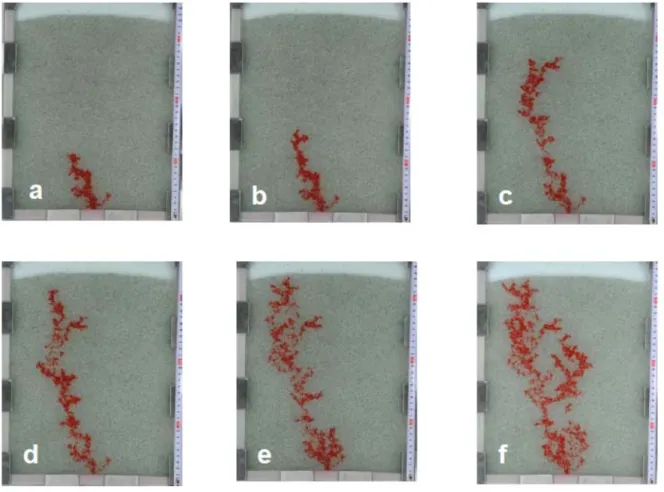
The birth and formation of a stringer and its evolution may be illustrated by experiments where the injection of oil does not originate from a point source, but is rather more or less
homogeneously distributed. Fig. 4 presents an experiment where the bottom of the cell is filled with large (1.5-2mm diameter) beads whereas the upper part is made of smaller beads (0.8-1.0 mm diameter). The injected oil initially fills the bottom part, acting as a reservoir. Then, according to its buoyancy, a single finger rises by invading more and more pores (Fig.4). Although this cannot be seen on the discontinuous snapshots, visual observation shows that invasion proceeds by rapid and discontinuous invasion of single pores. The observation of these jerky dynamics can be used to estimate the velocity of migration in natural porous media.
As stated above, a reasonable assessment is to assume that the average flow is limited by the expulsion of hydrocarbons from source rocks (Carruthers and Ringrose, 1998). Since Bo<<1, the buoyancy force of a single oil-filled pore is much smaller than its capillary pressure, which prevents an isolated, non-wetting fluid inside a single pore from moving; however, buoyancy of connected pores is additive and clusters with many pores (of the order of 1/Bo pores long in the vertical direction) may overcome this barrier. In order to build such a cluster, one has to assume that a few discrete stringers of continuous oil phase slowly emerge from the nearby source rock (Hirsch and Thompson, 1995). Once a stringer has a sufficient buoyancy to overcome capillary forces it may migrate until it is halted by a collection of smaller pore throats.
The cluster may then grow until, reaching a height of the order of /Bo, it acquires sufficient gravitational energy to overcome the barrier. Such mobility of clusters exceeding a length set up by the pressure forces has also been observed in the context where the large scale pressure gradient is set up by fluid injection, rather than by gravity: in such a case, the maximum size set by snap-off corresponds to /Ca, and the mobile clusters were found to be those with a size comparable to the maximum characteristic one (Tallakstad et al., 2009a, 2009b; Aursjø et al. 2010).
Once a given stringer has acquired a sufficient upward force, it can grow and move upward. Eventually during movement, snap-off occurs and the stringer shrinks and leaves below some truncated parts and isolated droplets. This stringer generally becomes trapped behind a barrier of throats until it is fed again by a new finger arriving from below. The later stringer may collect the droplets left behind by the previous one or connect with remaining truncated parts. Moreover this new stringer is observed to follow the backbone of the previously designed migration pattern. When both fingers merge, depending on the size of the surrounding throats, their buoyancy reaches the threshold to overcome capillarity and the upward movement continues until eventually, either the finger snaps off, reducing the buoyancy force on each part, or until some trapping occurs due to the fact that all surrounding pores have smaller throat sizes. Movement is stopped until further addition of oil increases the stringer buoyancy sufficiently to overcome the later capillary necking.
The upward movement of the oil stringer occurs as a succession of jumps during which its geometry is modified by invasion of one or several new pores at its upper part and/or retreat of one or several pores at its bottom one. When observed in the laboratory, these jumps occur suddenly and, at the microscopic scale, it is likely that during such jumps, viscosity plays an
important role, setting the limiting speed by balancing viscous and buoyancy forces during the time when some of the capillary forces along the boundary are reduced (or even accelerate the motion). This statement is now used to evaluate an upper limit of the instantaneous velocity of a stringer.
An immobile stringer of height can be thought of as a bubble in dynamic equilibrium between its buoyancy pressure force g and the capillary pressure at its interfaces with the wetting fluid (of the order of /for such a situation, the pressure forces are exactly balanced and the stringer does not move. When the stringer is fed by new oil, its buoyancy increases and
eventually overcomes the capillary effect, resulting in upwards movement. Once the upward motion has started, the capillary forces acting on all sides of the bubble alternate in direction, either pushing or pulling it. During this upward motion it is reasonable to assume that the net effect of capillary forces, averaged in time and space, is near to zero so that the upward velocity V of the stringer is limited only by viscous forces. This velocity can be evaluated as a function of the pressure gradient associated with gravity, using the standard, single phase Darcy law:
V= (k/ g
This gives an upper estimate of the rising velocity of the stringer.
The application of this formula to actual 2-D experiments is illustrated on Fig. 4 and Tables 1-4; whereas the observed velocity of the tip is 1.5×10⁻⁴ ms-1, the computed maximum velocity derived from (5) with relevant parameters is V/= 1.73×10⁻³ ms-1. The predicted maximum velocity is indeed larger that the one observed. The actual velocity of the tip observed results from a time average between (a) the mobile stages of the stringer and (b) the immobile stages of the tip after snap off, during which new stringers are formed, grow and migrate from the source underneath. It is hence consistent that the observed velocity is lower than the maximum velocity computed, which corresponds to the fast stages. Although this comparison is not entirely
accurate, the order of magnitude remains correct.
The application of equation (5) for natural migration is illustrated on Table 2. The maximum instantaneous velocity largely depends on the pore size (through the permeability): for large (0.5mm) it is on the order of 500m/y whereas for small (0.005mm) it reduces to 5cm/y.
Figure 4. Snap-shots of the same experiment using beads of 1.5-2.0mm diameter on the lower part of the cell and 0.8-1.0mm diameters in the central part. The figure is observed at various instants labeled a,b,c,d,e,f and the time elapsed for reaching the top of the cell is about 40mn corresponding to a velocity of the finger tip of about 1.5 10-4 m s-1 (cf parameters of Table 1-4)
3.5 Spatial density of stringers
As already pointed out by Hantschel and Kauerauf (2007), the overall picture of oil secondary migration looks like a percolation of stringers. For the range of parameters chosen (Table 2), the stringers would be characterized by a horizontal size of a few mm and a vertical height of 3 cm to 3 m; these stringers are subject to snap-off and reconnection and they are moving upwards in steps, sweeping remaining droplets. The spatial density of this population of stringers is a fundamental question which is now looked at, using a simple assumption on the individual dynamics of individual stringers.
An estimate of the instantaneous velocity of a given stringer invading new pores is deduced from equation 5. Assuming that this velocity has to keep pace with the flow per unit area of
hydrocarbons qs expelled from source rocks, in the range 8×10 -15
m s-1 to 8×10-16 m s-1 (England et al, 1994), a minimum number of such stringers per unit area is required; the density of
stringers per unit area is given by:
and the average distance D between stringers is (for the 3D case) D N-0.5.
This type of estimate may of course be applied to the experiments shown on Fig.4 in a 2D
approach. For this case, assuming a 2D geometry, it is predicted (Tables 1-4) that D = 2.8 m. This is consistent with the fact that only a single stringer appears in the cell which is only 30 cm wide. A more convincing illustration would require a much wider cell.
When applied to natural migration, the values obtained depend on the assumed flow rate coming from source rocks. Two values of the flux are assumed in Table 2. The rising velocity of stringers and their surface density are controlled by two parameters, the pore size and the source flux qs.
The distance D between rising stringers ranges from about one meter for smaller pore size to several tens of meters in the case of larger . The pathways are sparsely distributed as indicated by the small ratios of the stringer widths over their relative distance D. This is consistent with the fact that oil shows observed in carriers are rare – despite the large quantities of oil being transported (low average oil loss and good efficiency of the vertical migration). Of course the estimated distance D is an upper bound since it is implicitly assumed that the instantaneous stringer velocity applies continuously and that its upper movement is only limited by the expulsion of hydrocarbons from source rocks. Nevertheless this evaluation provides an interesting basis for estimating oil losses during vertical migration (Luo et al, 2007a).
4. Conclusions
The flow regime of hydrocarbons in heterogeneous, natural porous media is characterized by internal complexities and instabilities which result in both complex pathway geometries and jerky flow dynamics of oil stringers. The present paper is therefore limited to homogeneous porous media, where homogeneity refers to the dimensions of the elementary representative volume relative to the Darcy’s flow (see de Marsily, 1981). Even so, the physical description of the flow regime corresponding to the vertical migration of hydrocarbons is quite complex both in space and time.
The present work sheds some light on the geometry and dynamics of the vertical migration of oil. During vertical migration, oil flow can be described as a percolation of disconnected stringers with a vertical size of several centimeters to a few meters and a centimetric horizontal cross section. The upward movement of a stringer is discontinuous; it proceeds by invasion of new pores at its upper tip and segmentation and snap-off of its lower extremity. During snap-off, the stringer shrinks and leaves behind isolated droplets; it remains trapped until it is fed again by a new finger arriving from below. This new stringer collects the droplets let by the previous ones and uses the backbone of the previous path (Yan et al., 2012).
The vertical velocity of a stringer is limited by viscosity and, for a pore size m, its maximum value is on the order of a few meters per year. With such a velocity, the vertical movement of a stringer over distances of tens to hundreds of meters is geologically
instantaneous. However this figure is a maximum velocity and the average velocity of a stringer is limited by the rate at which it is fed through expulsion from source rocks. Nevertheless, this estimated maximum velocity leads to an evaluation of the minimum horizontal density of stringer
required to keep pace with the flow of oil expelled from source rocks; the stringers are
horizontally separated by distances D of the order on a several meters to decameters. On the other hand, experiments support the idea that the pathways followed by successive stringers remain the same. Therefore the sparse distribution of stringers would result in relatively low migration losses since the volume of rocks invaded over the whole migration episode is small (Lei et al, 2013).
More work is now clearly necessary to take into account the structural heterogeneities and the possibility of lateral migration. A few experimental studies of the effect of a tilted cap are already available (Yan et al., 2012), but a complete theoretical study of the geometry and dynamics of stringers associated with complex geometry has still to be done.
Acknowledgments
Part of this study was supported by the Chinese National Major Fundamental Research
Developing Project (2006CB202305). The support of the French regional network REALISE, of the CNRS and the ITN FLOWTRANS is also acknowledged. The authors thank K.J. Måløy for fruitfull discussions and Andrew Aplin forhis suggestions and corrections on the manuscript.
Appendix A: brief description of the experimental device
The Hele Shaw cell is not a scaled model but rather a device providing a visualization of the phenomena occurring during the slow displacement of two immiscible fluids in a granular medium. The cell used has a thickness of h = 3mm limited by two glass walls with a height of 40 cm and a width of 30 cm. It is filled with glass beads with a sorted diameter (in the range 0.2 to 2 mm) representing the porous medium. The size of the beads is relatively large compared to that of natural porous media (0.005 to 0.5 mm, cf Table 2). This is imposed by the necessity to perform experiments in a relatively short time span (hours to days) implying a relatively large permeability coefficient. The cell is first filled with water. Then oil, a non wetting and lighter fluid, is slowly injected at the bottom of the cell at its central point in order to observe the invasion of the porous medium by oil. In this experiment, the oil is dyed so that the pattern of invasion is continuously followed which gives a spectacular image of the dynamical aspects of the actual flow corresponding to secondary migration. The physical characteristics of the medium and of the fluids are given in Table1-1 (Fig. 1), 1-2 (Fig. 2), 1-3 (Fig.3) and 1-4 (Fig.4). In the last series of experiments (Fig 4 and table 1-4), the bottom of the cell is filled with some layers of large beads surmounted by smaller ones. The injected oil first occupies the lower compartment before invading the upper one. This geometry avoids the point source effect due to the local injection.
REFERENCES
Auradou, H., Måløy K.J., Schmittbuhl J. , Hansen A. , 2003. Drainage in a rough gouge-filled fracture. Transport in Porous Media, 50(3), 267-305.
Auradou, H., Måløy K.J., Schmittbuhl J. , Hansen A. , Bideau D., 1999. Competition between correlated buoyancy and uncorrelated capillary effects during drainage. Phys. Rev. E, 60, 7224-7234.
Aursjø, O.,Knudsen, H.A., Flekkøy, E.G., Måløy, K.J., 2010. Oscillation-induced displacement patterns in a two-dimensional porous medium: A lattice Boltzmann study, Phys. Rev. E, 82, 026305.
Berg, R.R., 1975. Capillary pressure in stratigraphic traps, Amer. Ass. Petrol. Geol. Bull., 59, 939-956.
Birovljev, A., Furuberg, L., Feder, J., Jossang, T., Måløy , K.J., Aharony, A., 1991. Gravity invasion percolation in two dimensions: experiment and simulation, Phys. Rev. Lett., 67, 584-587.
Birovljev, A., Wagner, G., Meakin, P., Feder, J., Jøssang, T., 1995. Migration and fragmentation of invasion percolation clusters in two dimensions porous media, Phys. Rev. E., 51, 5911-5915.
Burrus, J., Kuhfuss, A., Doligez, B., Ungerer, P., 1991. Are numerical models useful in
reconstructing the migration of hydrocarbon ? A discussion based on the Northern Viking Graben, In: England W.AA and Fleet A.J., (Eds.) Petroleum migration. Geol. Soc. Spec. Pub., 56, pp. 89-109.
Carruthers, D. J., 2003. Modeling of secondary petroleum migration using invasion percolation techniques, In: Duppenbecker, S., Marzi, R., (Eds.)., Multidimensional basin modeling: Amer.Ass.Petrol. Geol. /Datapages Discovery Series 7, pp. 21-37.
Carruthers, C., Ringrose, P., 1998. Secondary oil migration : oil-rock contact volumes, flow behaviour and rates, in : Parnell, J., (Ed.) Dating and duration of fluid flow and fluid rock interaction, Geological Soc. Special Pub., 144, pp. 205-220.
Catalan, L., Xiaowen, I., Dullien, F.A., 1992. An experimental study of secondary oil migration, Amer. Ass. Petrol. Geol. Bull., 76, 638-650.
Corradi, A., Ruffo, P., Corrao, A., Visentin, C., 2009. 3D hydrocarbon migration by percolation technique in an alternate sand-shale environment described by a seismic facies classified volume, Mar. Petrol. Geol., 26, 495-503.
Danesh A., 1998. PVT and phase behaviour of petroleum reservoir fluids, Developments in petroleum science 47, Elsevier, 400p.
Dembicki, H. Jr., Anderson, M.J., 1989. Secondary migration of oil: experiments supporting efficient movement of separate, buoyant oil phase along limited conduits, Amer. Ass. Petrol. Geol. Bull., 73, 1018-1021.
England, W.A., McKenzie, A.S., Mann, D.M., Quigley, J., 1987. The movement and entrapment of petroleum fluids in the subsurface, Geol. Soc. London, 144, 327-347.
England, W.A., Mann, A. L., Mann, D.M., 1991. Migration from source to trap. In : Merril, R.K., (Ed.), Source and migration processes and evaluation techniques, Amer. Ass. Petrol. Geol. Hanbook of Petrol. Geol., pp, 23-46.
England, W.A., 1994. Secondary migration and accumulation of hydrocarbons, In: Maagoon, L.B., Dow, W.G., (Eds.) the petroleum system- from source to trap, Amer.Ass.Petrol. Geol. Memoir N° 60, pp. 211-232.
Ergun, S., 1952, Flow through packed columns, Chem. Process Eng. London,48, 89.
Frette, V., Feder, J., Jøssang, T., Meakin, P., 1992. Buoyancy driven fluid migration in porous media, Phys. Rev. Let., 68, 21, 3164-3167
Hantschel, T., Kauerauf, A.I., 2007. Fundamentals of Basin and Petroleum Systems modelling; Springer, 470pp.
Hirsch, L.M., Thompson, A.H., 1995. Minimum saturations and buoyancy in secondary migration, Amer .Ass. Petrol. Geol. Bull., 79, 696-710.
Hou, P., Zhou, B., Luo, X. R., 2005. Experimental studies on pathway patterns of secondary oil migration. Science in China (ser.D). 49, 469-473.
Jankov, M., Løvoll, G., Knudsen, H.A., Måløy, K.J., Planet, R., Toussaint, R., Flekkøy, E.G., 2010. Effects of pressure perturbations on drainage in an elastic porous medium, Tr. in Porous Media, 84(3), 569-585.
Lei, Y., Luo, X.R., Zhang, L.P.,Vasseur, G., Wang H., Zhao S., 2013. Quantitative Estimation of Oil Losses During Migration, Part III: Application In the Yaojia Formation, Northwestern Songliao Basin, NE China. J. Petroleum Geology (in press).
Lenormand, R., Touboul, E., Zarcone, C., 1988. Numerical models and experiments on immiscible displacements in porous media. J. of Fluid Mechanics, 189, 165-187.
Lenormand, R., 1985. Differents mécanismes de déplacements visqueux et capillaires en milieux poreux. C. R. Acad. Sci. Paris II, 301, 247-250.
Luo, X. R., Zhang, F. Q., Miao, S., Wang, W. M., Huang, Y. Z., Loggia, D., Vasseur, G., 2004. Experimental verification of oil saturation and loss during secondary migration. J. Petrol. Geol., 27(3), 241-251.
Luo, X. R., Zhou, B., Zhao, S. X., Zhang, F.Q., Vasseur, G., 2007a. Quantitative estimates of oil losses during migration, Part I: the saturation of pathways in carrier beds. J. Petroleum Geology, 30(4), 375-387.
Luo, X.R.,Yu, J., Zhang, L.P., Yang, Y., Chen, R.Y., 2007b. Numerical modeling of secondary migration and its applications to Chang-6 Member of Yanchang Formation (Upper
Triassic), Longdong area, Ordos Basin, China, Science in China Series D (Earth Sciences), 50, 91-102.
Løvoll, G., M. Jankov M., Måløy, V R., Toussaint, R., Schmittbuhl, J., Schaefer, G. , Méheust, Y., 2010. Influence of viscous fingering on dynamic saturation-pressure curves in porous media. Transport in Porous Media, 86, 1, 305-324, doi: 10.1007/s11242-010-9622-8
Løvoll, G., Méheust, Y. , Toussaint, R., Schmittbuhl J., Måløy, K.J., 2004. Growth activity during fingering in a porous Hele Shaw cell, Phys. Rev. E., 70, 026301,
doi:10.1103/PhysRevE.70.026301
Mann, U., 1997. Petroleum migration: Mechanisms, pathways, efficiencies and numerical simulation, In: Welte, D.H., Baker, D.R., (Eds.) Petroleum and Basin Evolution. Berlin Heidelber: Springer-Verlag, pp. 405-520.
de Marsily, G., 1981. Quantitative hydrogeology, Academic press, 440pp, San Diego. Meakin, P., Wagner, G., Vedvik, A., Amudsen, H., Feder, J., Jossang, T., 2000. Invasion
percolation and secondary migration : experiments and simulations. Mar. Petrol. Geol., 17, 777-795.
Méheust, Y, Løvoll, G., Måløy, K. J., Schmittbuhl, J., 2002. Interface scaling in a
two-dimensional porous medium under combined viscous, gravity and capillary effects, Phys. Rev. E, 66, 051603.
Schmittbuhl, J., Hansen, A. , Auradou, H., Måløy, K.J., 2000. Geometry and dynamics of invasion percolation with correlated buoyancy , Phys. Rev. E, 61, 3985-3995. Schowalter, T.T., 1979. Mechanics of secondary hydrocarbon migration and entrapment.
Amer.Ass.Petrol. Geol. Bull., 63, 723-760.
Selley, R.C., 1998. Elements of Petroleum Geology (2nd Edition). Academic Press, London, 470pp.
Tallakstad, K.T., Knudsen, H.A., Ramstad, T., Løvoll, G., Måløy, K.J., Toussaint, R., Flekkøy, E.G.,2009. Steady-state two-phase flow in porous media: statistics and transport properties, Phys. Rev. Lett. ,102, 074502.
Tallakstad, K.T., Løvoll, G., Knudsen, H. A., Ramstad, T., Flekkøy, E. G., Måløy, K. J., 2009. Steady-state, simultaneous two-phase flow in porous media: An experimental study, Phys. Rev. E, 80, 036308..
Thomas, M.M., Clouse, J.A., 1995. Scaled physical model of secondary oil migration, Amer.Ass.Petrol. Geol. Bull., 79, 19-29.
Tokunaga, T., Mogi, K., Matsubara, O., Tosaka, H., Kojima , K., 2000. Buoyancy and interfacial force effects on two-phase displacement patterns: an experimental study, Am. Ass.
Petrol.Geol.Bull., 84,(1), 65-74.
Toussaint, R., Løvoll, G., Méheust, Y., Måløy, K.J., Schmittbuhl, J., 2005. Influence of pore-scale disorder on viscous fingering during drainage, Europhys. Lett., 71, 583-589. Toussaint, R., Måløy, K.J., Méheust, Y., Løvoll, G., Jankov, M., Schäfer, G., Schmittbuhl, J.,
2012. Two-phase flow: structure, upscaling, and consequences for macroscopic transport properties, Vadose zone journal, 11 (3), pp. vzj2011.0123.
Ungerer, P., Burrus, J., Doligez, B., Chenet, Y., Bessis, F., 1990. Basin evaluation by integrated two-dimensional modeling of heat transfer, fluid flow, hydrocarbon generation, and migration, Am. Ass. Petrol. Geol. Bull., 74, 309-335.
Yan, J., Luo, X., Wang, W, Toussaint, R., Schmittbuhl J., Vasseur, G., Chen F., Yu, A., Zhang L., 2012. An experimental study of oil secondary migration in a three dimensional tilted porous medium, Am. Ass. Petrol. Geol. Bull., 96, 773-788.
Wagner, G., Birovjlev, A., Meakin, P., Feder, J., Jossang, 1997. Fragmentation and migration of invasion percolation clusters: experimentations and simulations, Phys. Rev. A, 55, 7015-7029.
Welte, D.H., Hentschel, T., Wygrala, B.P., Weissemburger, K.S., Carruthers, D , 2000. Aspects of petroleum migration modelling, J. Geoch. Explor., 69-70, 711-714.
Wilkinson, D., 1984. Percolation model of immiscible displacement in the presence of buoyancy forces, Physical Review A, 30(1), 520-531.
Wilkinson, D., 1986. Percolation effects in immiscible displacement, Phys. Rev. A, 34(2), 1380-1391.
Yan J.Z., Luo X.R., Zhang L.K., Lei Y.H., 2012. An Experimental Study on the Percolation Backbone of the Secondary Oil Migration Path, Petroleum Geology & Experiment, 34(1), 99-103
Zhou, B., Loggia D., Luo X., Vasseur G., 2006. Numerical studies of gravity destabilized percolation in 2D porous media The European Physical Journal B, 50(4), 631-637.