HAL Id: hal-02161846
https://hal-mines-albi.archives-ouvertes.fr/hal-02161846
Submitted on 24 Jun 2019
HAL is a multi-disciplinary open access
archive for the deposit and dissemination of
sci-entific research documents, whether they are
pub-lished or not. The documents may come from
teaching and research institutions in France or
abroad, or from public or private research centers.
L’archive ouverte pluridisciplinaire HAL, est
destinée au dépôt et à la diffusion de documents
scientifiques de niveau recherche, publiés ou non,
émanant des établissements d’enseignement et de
recherche français ou étrangers, des laboratoires
publics ou privés.
Key factors influencing the environmental performance
of pyrolysis, gasification and incineration
Waste-to-Energy technologies
Jun Dong, Yuanjun Tang, Ange Nzihou, Yong Chi
To cite this version:
Jun Dong, Yuanjun Tang, Ange Nzihou, Yong Chi. Key factors influencing the environmental
per-formance of pyrolysis, gasification and incineration Waste-to-Energy technologies. Energy Conversion
and Management, Elsevier, 2019, 196, pp.497-512. �10.1016/j.enconman.2019.06.016�. �hal-02161846�
Key factors influencing the environmental performance of pyrolysis,
gasification and incineration Waste-to-Energy technologies
Jun Dong
a,b,⁎, Yuanjun Tang
b,c, Ange Nzihou
b, Yong Chi
caKey Laboratory of Recycling and Eco-treatment of Waste Biomass of Zhejiang Province, Zhejiang University of Science and Technology, 310023 Hangzhou, China bCentre RAPSODEE, Ecole des Mines Albi, Campus Jarlard, 81013 Albi Cedex, France
cState Key Laboratory of Clean Energy Utilization, Zhejiang University, 310027 Hangzhou, China
Keywords: Waste-to-Energy
Energy conversion technologies Energy recovery
Life cycle assessment Environmental impacts Optimization
A B S T R A C T
Waste-to-Energy (WtE) has started playing an increasingly important role in the recovery of energy from mu-nicipal solid waste (MSW). A number of WtE technologies are being developed. However, selecting a more environmentally sustainable option is difficult due to data limitation and methodological inconsistencies. Using life cycle assessment (LCA) as a tool, this paper aims to identify key factors influencing the potential environ-mental impacts of four representative WtE technologies, namely the incineration (S1), pyrolysis (S2), gasifica-tion (S3), and gasificagasifica-tion coupled with ash melting (S4). The systems are constructed using inventory data based on on-site operation of several industrial-scale reference plants. A comprehensive sensitivity analysis is conducted, assessing a range of critical input parameters, processes, operating conditions and modelling as-sumptions. The results demonstrate that all analysed WtE systems exhibit environmental benefits (i.e. negative environmental impacts) for most of the impacts, while S3 seems to be more optimal due to an intermediate syngas cleaning process, which results in both reduced emissions and increased energy recovery. Parameters driving the environmental impacts are energy recovery efficiency, feedstock variability, NOxand CO2emissions
at stack, and recycling of metals. Moreover, the overall ranking of different WtE systems is strongly dependent on operating conditions, such as effectiveness of the air pollution control process, utilization pathway of pyrolysis char, and to a lesser extent, bottom ash management (landfill or recycling). The LCA modelling conditions, such as substituted source of electricity, choice of functional unit and time frame are also shown to significantly affect the quantified environmental performance. Finally, the study highlights the directions, towards which, efforts should be focused throughout all stages of each WtE technology to obtain further improvements.
1. Introduction
Waste-to-Energy (WtE) has played an important role in dealing with the increasing production of municipal solid waste (MSW)[1]. Stimu-lated by dwindling reserves of fossil fuels and sustainable energy pro-duction, WtE is seen as an attractive approach to recover energy and useful materials[2]. Today, approximately 1.5% of the total energy is provided by WtE in European Union (EU)[3]. In this context, the future goal of modern WtE has shifted from being a “waste treatment sector” to an “energy and resource producer”[4].
Incineration is currently the most mature WtE technology with over 1400 plants in operation around the world[5]. The last generation of incinerators is equipped with advanced air pollution control (APC) system, which has significantly improved their environmental perfor-mance [6]. Pyrolysis and gasification are newly developed WtE
technologies[7], which operate in the absence of oxygen (pyrolysis) or in the presence of sub-stoichiometric air (gasification) to yield syngas ahead of combustion (the process is called the “two-step oxidation”). Both processes offer opportunities to minimize the formation of dioxins and to integrate with high-efficient energy recovery devices (such as, gas turbines and gas engines). So far, pyrolysis/gasification-based WtE is still less applied on commercial scale, as around a hundred plants are reported to process MSW[8].
However, there remains a lack of consensus about a better WtE technology. From the perspective of environment, WtE should achieve lower emissions, a higher energy recovery efficiency, and efficient re-covery of inorganic materials. Therefore, it is necessary to conduct a systematic comparison among various WtE technologies.
This targeted aim calls for support by suitable assessment tools. Life cycle assessment (LCA) represents a comprehensive methodology as it ⁎Corresponding author at: Key Laboratory of Recycling and Eco-treatment of Waste Biomass of Zhejiang Province, Zhejiang University of Science and Technology,
310023 Hangzhou, China.
E-mail address:dongjun@zust.edu.cn(J. Dong).
quantifies both direct and indirect environmental impacts of a system throughout its life cycle[9,10]. In the past years, increasing LCA studies have been performed in the field of WtE. Majority of these studies are focused on incineration, aiming at identifying potential environmental burdens [11,12], or making comparisons with alternatives such as landfill[13,14]. However, LCA of pyrolysis and gasification technolo-gies is still scarcely assessed. Evangelisti[15]evaluated three pyrolysis and gasification systems (gasification-plasma gas cleaning, pyrolysis-combustion, and gasification-combustion) and reported that gasifica-tion-plasma was the only system showing a better environmental per-formance over modern incineration. Zaman[16]in turn indicated that gasification-combustion appeared more optimal than incineration. The contradictory result to those of Evangelisti[15]can be mainly due to different energy recovery efficiencies adopted in these studies. Arena
[5]compared operational data from a gasification-melting system with incineration and reported that incineration was better for most of the selected impact categories, though gasification could produce a less leachable residue with a greater potential to be recovered. Overall, as highlighted by Khandelwal [17]and Mayer[3] in recent reviews, a comparison of different WtE technologies requires further investigation to derive clearer results.
The inconsistencies in the available literature can be explained by issues of both WtE technical parameters and LCA modelling meth-odologies [9]. From the technic perspective of WtE, existing studies revealed that parameters, such as plant energy efficiencies [18], air pollutants at stack [19], waste composition [20], and solid residues management [21]were decisive for environmental performance. Be-sides, LCA principles, such as energy substitution[22], temporal and geographic horizon [23], and choices of impact assessment methods
[24]were also proven to be vital factors affecting the life cycle impacts. However, very few of the studies (i.e. only 6% of 315 peer-reviewed studies[3]) have addressed the holistic description of all these aspects, which has hindered transparent comparison and determination of a more sustainable WtE technology.
Consequently, this paper aims to give a systematic assessment of
environmental profile of different WtE technologies. Within this con-text, first, an LCA modelling is conducted quantifying the environ-mental impacts of four WtE technologies, namely incineration, pyr-olysis, gasification and gasification-melting. This is done based on data inventory from on-site operation of several representative plants. These technologies are the most common types of WtE currently available. Then, the results are discussed by a comprehensive sensitivity analysis to seek crucial factors (i.e. input parameters, processes, operating conditions, and modelling assumptions), which drive their environ-mental sustainability. Finally, potential areas of improvement are out-lined for each specific technology. Therefore, this paper contributes to already existing LCA and extends knowledge in the following ways: (1) quantifying the environmental performance of different WtE technol-ogies, which fills the knowledge gaps in this field and also serves as a reference for other similar LCA studies; (2) carrying out a holistic sensitivity analysis of the LCA process, which identifies key environ-mental hotspots and bottlenecks of each WtE technology for future improvements; (3) the results from this study are expected to increase the credibility and reliability of LCA, thus providing potentially useful recommendations for public policy and planning.
2. Methodology
2.1. Goal and scope definition
The life cycle assessment is performed following the ISO standards
[25]and the International Reference Life Cycle Data System (ILCD) Handbook[26]. The aim is to compare the environmental impacts of four representative WtE technologies, and then, to identify the key factors determining their sustainability as well as potential areas of improvements. The goal of this study is in accordance with the ‘‘Si-tuation C1′’ as defined by the ILCD Handbook, and implies an “attri-butional” approach for LCA modelling. The LCA modelling is carried out by using the Gabi 8.0 software.
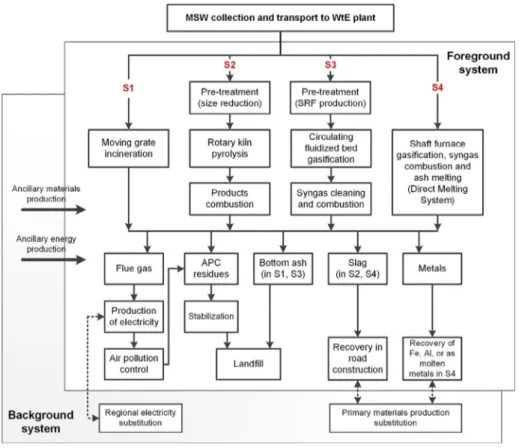
Fig. 1shows the system boundaries under consideration, which are
split into foreground and background systems. The foreground system covers waste pre-treatment (required in several WtE units), thermal conversion (incineration, pyrolysis, gasification, or gasification-melting), energy recovery, APC, and solid residues management. MSW collection and transportation before arriving the WtE plants are not included. All plants are assumed to be connected to steam turbine for energy recovery and are equipped with a typical APC line comprising selective non-catalytic reduction (SNCR), dry scrubber with slaked lime (Ca(OH)2) and activate carbon, and bag filter for removing NOx, acid gases, dioxins, and particulate matter (PM). Solid residues include bottom ash, slag and APC residues. It is worth noticing that the bottom ash (generated in S1, and S3 scenarios) and slag (generated in S2, and S4 scenarios) are separately defined due to their different character-istics. The latter appears as a melted, vitrified material feasible for immediate recycling [27]. Instead, the bottom ash is assumed to be landfilled, which follows the common EU practice. APC residues mainly consist of fly ash and exhausted sorbents, and are stabilized before final disposal in landfill at a distance of 200 km. It should be mentioned that these settings are used in the baseline cases (default situation), while among these input parameters, the most critical ones will be discussed in detail based upon a sensitivity analysis, which is discussed in a later section 2.4.
Based upon the data from the Gabi databank, the background system quantifies the upstream production of ancillaries, as well as the benefits from recovered energy, metals and inerts. The plants are con-sidered to produce electricity only. This assumption makes the model-ling easier and would not affect the comparison results[5]. In appliance with the attributional LCA, the ‘‘multifunctional’’ issue is addressed based upon the system expansion. The recovered electricity is assumed to substitute an equivalent amount of electricity from EU grid mix (25.8% nuclear, 21.5% coal, 19.7% natural gas, and 30.2% renewables, as par 2016 statistics) [28]. The recycling of metals is credited for avoiding the production of virgin metals. The recovered slag is used in road construction to substitute natural aggregates.
The functional unit is defined as the thermal treatment with elec-tricity recovery of one tonne of MSW. The plants are assumed to be located in EU, and have a composition of the EU average residual waste (Table 1)[29], and a lower heating value of 10.307 GJ/tonne according to the CEWEP report of 314 waste incineration plants in EU[30]. The elementary composition is determined for each waste fraction based on the study of Koehler[31](seeTable S1 in Supplementary Material). The LCA time frame for potential environmental impacts is considered to be 100 years. This is in particular relevance for the leaching of ash components in landfill, where emissions can last thousands of years
[9,11]. A long-term perspective covering a time span of 60,000 years will be discussed in the sensitivity analysis, which is based upon re-commendations of Doka[23].
2.2. Data source and inventory analysis
The LCA modelling is processed using mass and energy balances, which is based upon the material and substance flow analysis (MFA/ SFA) for each WtE system. The incoming waste can end up in any of the compartments, including bottom ash (or slag), APC residues, or air-borne emissions. Transfer coefficients (TCs) express the proportion of each input element constituting the waste. The source and data used to compute TCs are detailed in theSupplementary Material(Section SM-2).Fig. 2shows the mass flow sheets in the four analysed WtE systems. The data used are mainly based on on-site operation of several re-ference plants. The selected plants are all industrial-scale, and there-fore, are capable of reflecting reliable and representative performance of specific WtE technologies. Basic information of the reference WtE plants is provided inTable 2. It is worth noticing that the selected ga-sification-melting plant is located in Japan, which may result in a dif-ferent waste composition from that in EU. However this would not cause significant effects on the operating of gasification-melting pro-cess, such as coke consumption[32]. The life cycle inventory is sum-marized inTable 3, while the description of each scenario is detailed as follows.
2.2.1. S1: Incineration
The modelled incineration reflects moving grate incinerator, which is the predominant type used worldwide[19]. TCs for incineration are adapted from the work of Koehler[31]. The process conditions are sourced from the average performance of 110 incineration plants (85% of the total number) operating in France[33,34]. Therefore, the data are representative of incineration in other regions with similar tech-nology levels.
Air emissions are divided into two categories, namely the waste-specific and process-waste-specific emissions. Waste-waste-specific emissions are dependent on waste input and are calculated using TCs. Two pollutants (CO2,fossiland Hg) are compiled considering the availability of TCs re-lative to each WtE system. Process-specific emissions are controlled by thermal technologies and/or APC operation. Seven pollutants (CO, di-oxins, HCl, NH3, NOx, PM and SO2) are considered, which are calcu-lated using emission factors based on French incinerators.
Incineration enables the recovery of energy and materials. A net electricity recovery efficiency of 17.7% is used, which is reported by CEWEP as an average value for the selected incineration plants in EU
[30]. The mass and composition of bottom ash and APC residues are calculated using TCs. Scrap metals in the bottom ash can be recovered using mechanical separation. The processing steps and associated en-ergy consumptions are sourced from the work of Allegrini[21]. A ty-pical recovery efficiency of 80% is used for ferrous (Fe) scraps[11]. While the recovery of non-ferrous scraps varies with technologies, Aluminium (Al) recovery with a typical efficiency of 30% is considered
[11]. The remaining bottom ash is landfilled, whereas the modelling of the leaching of ash elements is taken from the work of Doka[23]. The APC residues are assumed to be chemically stabilized by the Ferrox process. A detailed assessment of the associated impacts is estimated according to Fruergaard[35].
2.2.2. S2: Pyrolysis
The modelling of pyrolysis is based on rotary kiln, which is the only type of reactor that has successfully achieved industrial-scale im-plementation[36]. The basic processes and data are calculated from the reference plant “Burgau” in Germany[37], which had operated for over 30 years (until 2015) and is a good example of full-scale pyrolysis. The associated TCs are approximated based upon the work of Arena and Di Gregorio[38], which have been adapted considering data of air emis-sions in the reference plant.
The incoming waste is shredded to 300 mm size as a pre-treatment step, and is then fed into the rotary kiln together with around 12–20 kg of quicklime per tonne of waste[39]. The kiln is externally heated using
Table 1
EU average Municipal solid waste composition assumed as reference for the LCA modelling.
Waste composition Content (wt%, as received basis) Organic waste 35 Paper 20 Plastics 11 Textiles 4 Glass 5 Metals 3 Other/inert wastea 22
a “Other/inert waste” may include amounts of combustibles that not
elsewhere classified. However due to the lack of data, this composition is treated as a whole as non-combustible.
combustion flue gas to maintain the core reaction zone at about 500 °C. Pyrolysis is carried out with an average residence time of 1 h, due to which, the waste is converted into gas and char fractions. The gas is conveyed to a downstream combustor, which operates at 1200 °C. The solid fraction undergoes separation to extract metals. Their recovery
efficiencies are assumed to be same as those of incineration. The re-maining char in Burgau plant is not utilized and is transported to landfill. However, it should be noted that this reference plant was de-signed for pure disposal purpose at the time of planning. Since the aim of this study is to examine the waste-to-energy potential of different
Fig. 2. Configuration and mass flows in the four different WtE technologies. Data are adjusted to the functional unit of 1 tonne of MSW, values are expressed as kg. Letters “I” and “E” represent respectively “import” and “export”.
technologies, proper utilization of this high-caloric char should be considered, as it would have a significant impact on the overall energy efficiency. As a result, char is assumed to be milled to fine powders, and combusts along with syngas, following common practices in similar plants (such as, Siemens, Mitsui, and Takuma). The temperatures of the combustion chamber are sufficiently high, which generates a molten slag. As mentioned previously, the slag can have a superior leaching resistance, due to which, it is regarded as a recyclable material for road construction application.
2.2.3. S3: Gasification
The modelling of gasification is based on the operation of reference plant “Kymijärvi II” in Finland[40], which uses circulating fluidized bed gasifier and is the largest gasification plant processing MSW-de-rived fuels (namely, solid refuse fuels; SRF) in the world. The TCs have been estimated based on the studies of Konttinen[41]and Arena and Di Gregorio[42].
The MSW is upgraded (through shredding, and pelletization) to accord with the required quality of SRF. Such processing requires en-ergy and the data are taken from Nasrullah[43]. Then, the waste passes into the gasifier, which operates at 850–900 °C to generate syngas. This is followed by gas cleaning, for which the produced gas is cooled in a heat recovery unit the temperature drops down to 400 °C. After this, the gas passes through a series of ceramic filters to remove alkalis, heavy metals and PM. The cleaned syngas has few corrosive contaminants, which enable it to produce high-quality steam (540 °C, and 121 bar). This steam quality is higher than those produced in conventional in-cineration plants (40 bar, 400 °C)[44]. Consequently, the plant reaches an electricity recovery efficiency of 27.4% (net efficiency)[40]. The produced bottom ash appears similar to that from the incineration case, which is landfilled after recycling of the metals.
2.2.4. S4: Gasification-melting
The Direct Melting System, which has achieved commercial opera-tion for more than 30 years in Japan and South Korea, is selected as a representative gasification-melting system. The performance data are mainly sourced from a reference plant in Japan, which is one of the world’s largest gasification-melting plants [27,32,45]. The TCs are taken from Arena and Di Gregorio[38]based on a similar prototype.
The MSW does not require pre-treatment. It is fed into the shaft furnace together with coke (to assist ash melting) and limestone (to adjust the viscosity of melt). Gasification occurs in the middle zone of the furnace (600–800 °C) and the produced syngas is sent for complete burning in a downstream combustor. Incombustible waste fractions descend to the bottom of furnace, where combustion and melting re-actions occur with the injection of O2-rich air (36 vol% O2) at 1000–1800 °C. Molten residues are discharged intermittently and se-parated magnetically into slag and metals. The net electricity recovery efficiency reaches 16.7% by subtracting the internal power consump-tion, such as oxygen generator and ash melting[32].
2.3. Life cycle impact assessment
The life cycle impact assessment (LCIA) is estimated according to the CML 2001 method, updated in August 2016. A total of 11 impacts including both toxic and non-toxic categories are considered: global warming (GWP), acidification (AP), eutrophication (EP), ozone layer depletion (ODP), photochemical ozone creation (POCP), terrestric ecotoxicity (TETP), freshwater aquatic ecotoxicity (FAETP), human toxicity (HTP), marine aquatic ecotoxicity (MAETP), and abiotic de-pletion (ADP elements and ADP fossil). The accounting of biogenic CO2 emissions (as opposed to CO2where the carbon is of fossil origin) are widely debated. In this study, biogenic CO2is treated carbon neutral (GWP of zero), following currently common LCA practice[46,47].
Table 2 Reference WtE plants considered in this study. Scenario Technology Type (supplier) Feedstock Plant capacities (tonnes/year) Reference plants S1 Incineration Moving grate Residual MSW 10,000 –700,000 110 French incineration plants [33,34] S2 Pyrolysis Rotary kiln MSW, industrial waste, sewage sludge 35,000 Burgau, Germany [37,39] S3 Gasi fi cation Circulating fl uidized bed Solid Refuse Fuels 250,000 Kymijärvi II, Finland [40,44] S4 Gasi fi cation-melting Direct Melting System (shaft furnace) MSW 75,000 A speci fi ed plant in Japan [27,32,45]
2.4. Sensitivity analysis
The sensitivity analysis is conducted using the method re-commended by Clavreul[48]. The objective is to systematically identify key factors influencing the environmental performance of different WtE systems. The following steps have been applied successively.
•
Perturbation analysis identifies important individual parameters to overall results, whereby all input parameters are varied one at a time by 10% by the following equation:= SR result initial result parameter initial parameter ∆ ∆ (1) Table 3
Life cycle inventory table for the four different WtE technologies, referred to the functional unit of 1 tonne of MSW.
Unit Incineration(S1) Pyrolysis(S2) Gasification(S3) Gasification-melting (S4) Input streams
Limestone as ancillary material kg – – – 70.20 Quicklime as ancillary material kg – – – 16.00
Coke as ancillary fuel kg – – – 49.00
Electricity for MSW pre-treatment kwh – -a 70.00
– Slaked lime for APC kg 16.63 18.58 18.71 18.70
Ammonia for APC kg 0.52 0.52 0.52 0.52
Active carbon for APC kg 0.56 0.56 0.56 0.56 Output solid residues to be treated
Bottom ash, to be landfilledb kg 277.43 – 102.73 –
APC residues, to be stabilized followed by landfill kg 48.09 64.72 125.93 64.90 Direct emissions to air
CO2,fossilc kg 416.97 419.92 419.95 602.29 CO g 35.11 49.28 9.86 35.43 HCl g 31.07 25.13 4.93 21.15 NH3 g 24.64 24.64 24.64 28.57 NOx g 763.17 822.52 793.44 120.01 PMd g 5.68 6.90 9.86 12.57 SO2 g 40.46 39.43 34.50 18.86
Hg g 3.14E-02 5.42E-02 4.93E-04 9.86E-02
Dioxins g 4.51E-08 4.93E-09 9.86E-09 4.97E-09 Recovered streams (avoided burdens)
Net electricity output kwh 506.76 593.17 783.49 558.90 Slag for road construction kg – 266.56 – 165.76
Ferrous scrap kg 15.46 10.76 7.98 –
Aluminium scrap kg 11.83 6.82 4.64 –
Molten metals kg – – – 18.06
APC = air pollution control, PM = particulate matter
a The raw MSW need to be shredded as pre-treatment in pyrolysis scenario (S2), which necessarily requires electricity. The consumption amount, together with the
energy required for char milling, has been quantified as a whole (i.e. internal energy use, assumed to be 20% of the total recovered electricity).
b The value presents the net amount of bottom ash after metals separation, which is destined to be landfilled. c Biogenic CO
2emissions are considered neutral to GWP. The fraction of biogenic carbon based on EU average MSW composition is estimated at 48% according to
IPCC guideline.
dThe PM emission is divided into 99.5% PM
2.5and 0.5% PM2.5-10according to Doka[23], with the aim to better quantify its impact on human and ecosystem.
Fig. 3. Characterized results of impact assessment for the treatment of 1 tonne of MSW using four different WtE technologies. Some impacts are scaled to fit the y-axis; their original values can be obtained by dividing the factor shown on the x-axis.
where SR is the sensitivity ratio; result
initial result∆ is the relative change of the total result; initial parameter∆parameter is the relative change of an individual para-meter. A list of the tested parameters in each scenario is presented in theSupplementary Material (Table S8). Parameters with a higher ab-solute SR represent that they have more significant influence on the overall results. Parameters with SR values higher than 0.2 will be fur-ther discussed.
•
Several process operating conditions are then discussed based upon the scenario analysis. The aim is to examine if an alternative choice for the construction of scenarios would vary the ranking of WtE systems or not.•
The last part of the sensitivity analysis addresses model assump-tions. From the methodological point of view, the LCA results ty-pically depend on various choices. Three critical aspects, namely the substituted energy sources, the choice of a functional unit, and the choice of time frame, are discussed herein.3. Results
The overall environmental impacts of the baseline WtE systems are shown inFig. 3. All the four systems exhibit negative values for 8 out of 11 impacts, indicating an environmental benefit due to credits from the recovery of energy and materials. Contrarily, positive values of GWP, EP and TETP impacts indicate environmental burdens. Comparing dif-ferent WtE technologies, gasification (S3) is better for 5 impacts (GWP, AP, POCP, TETP, and ADP fossil). Gasification-melting (S4) instead has the lowest impacts in 4 categories (EP, ODP, FAETP, and ADP ele-ments), whilst pyrolysis (S2) is superior for HTP.
In order to identify main sources of the environmental burdens, contribution analysis is conducted to distribute the overall impacts into different life cycle stages.Fig. 4reports the results refer to 7 selected categories that are representative in terms of non-toxic impacts, toxic impacts and resources depletion. It is observed that the impacts from “stack emissions”, “energy recovery” and “metals recycling” are the most noteworthy contributors, with the former one being an environ-mental loading and the latter two being environenviron-mental savings. The “stack emissions” account for a large proportion of the GWP, AP, EP and TETP impacts. For all WtE systems there is a positive impact of GWP, which is mainly due to the fossil-origin CO2 emission derived from MSW. S1, S2 and S3 scenarios show negligible difference of GWP stack emissions (417–420 kg CO2eq.), while that value in S4 is much higher
(602 kg CO2 eq.) due to the burning of coke to maintain high tem-perature in the melting zone of the gasifier[27]. By contrast, S4 shows a significantly lower AP and EP emissions at stack, of which NOx emission is the principal contributor. The reduced impacts can be as-cribed to the following two reasons. Firstly, the emissions data in spe-cified WtE plants are broadly comparable with the exception of NOx (Table 3), of which S4 shows the lowest NOxemission. Secondly, pyr-olysis and gasification WtE produces a lower flue gas volume as a consequence of the lower excess air (ER = 1.2 vs. ER = 1.6 in S1). Hence, mass emission rate per tonne of MSW is decreased compared with incineration. Lastly with respect to TETP, heavy metals (here only Hg is considered) are the major contributors. S3 shows the least impact due to intermediate gas cleaning that has condensed part of the metals in the filter.
“Energy recovery”, due to the substitution of fossil fuels combustion for electricity production, has made a significant contribution to reduce GWP, AP, EP and ADP fossil impacts. The highest avoided emissions are found in S3. As has been mentioned previously, the use of intermediate syngas purification offers the opportunity to remove targeted pollutants (particularly Cl) prior to combustion. In this case, the steam data of the boiler reach 121 bar and 540 °C, thus improving the efficiency of the power cycle (a net efficiency of 27% in S3 vs. 18% in S1). On the other hand, S4 shows the lowest amount of electricity recovered. This is be-cause the ash melting process is quite energy intensive, which consumes about 24% of the gross electricity generated. However, the main ad-vantages of melting are size reduction of the ash to be landfilled and the decrease of toxicity (dioxins and heavy metals leaching)[49].
“Metals recycling” shows also avoided impacts, in particular for toxicity impacts (FAETP, HTP). Recycling of Fe is the main contributor to FAETP credits (greater than96%), while HTP credits are nearly completely ascribed to Al recycling. This indicates that the environ-mental impacts from scrap metals separation, upgrading, and re-processing are considerably lower than their production from virgin materials[11]. With reference to the four WtE scenarios, the compo-sition of recycled metals is strongly different, mainly as oxidized form in incineration and metallic form in pyrolysis and gasification. Higher actual recovery efficiencies and subsequently increased avoiding im-pacts are thus possible in pyrolysis/gasification-based WtE. However, S3 shows lower FAETP and HTP credits due to higher transfer of metals to fly ash (seeTable S4).
“Materials and energy provision” have only a minor contribution to S1 and S2 scenarios, however is more noteworthy in S3 and S4. For S3 this contribution mainly derives from the energy demand to produce
Fig. 4. Contribution analysis of different life cycle stages to the impacts from the four different WtE technologies. Only selected impact categories are shown in the figure, the impacts are estimated according to the CML 2001 method (updated in August 2016).
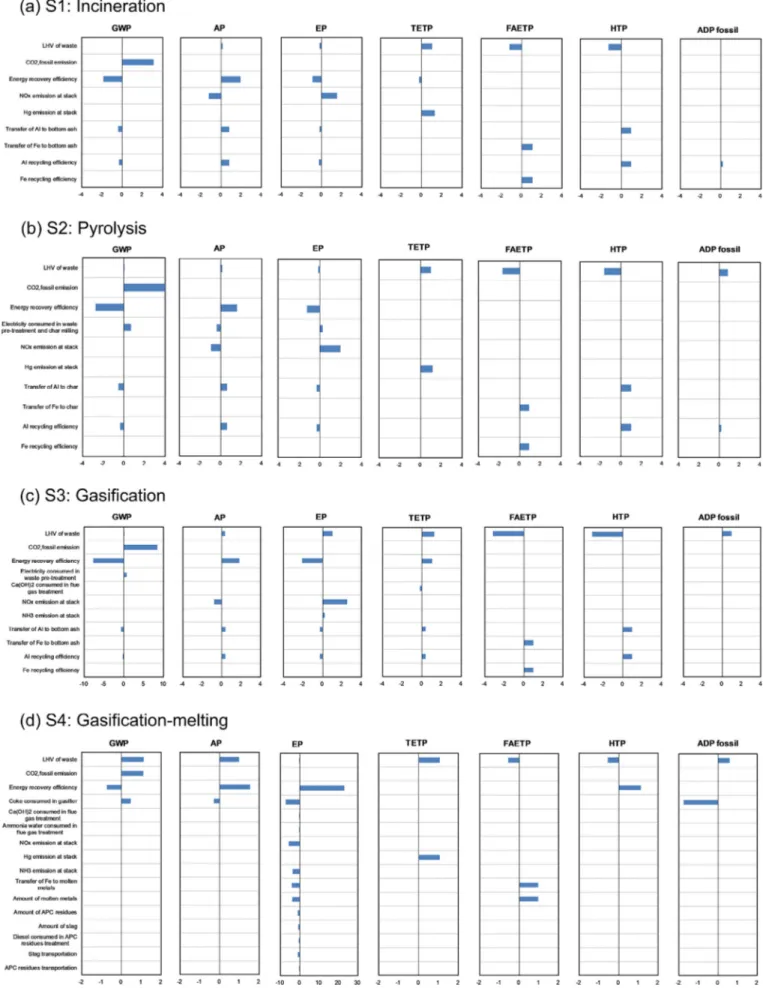
Fig. 5. Perturbation analysis results showing the most important parameters and their sensitivity ratios (SRs) in LCA results of the four different WtE technologies. Only SR greater than 0.2 and SR < -0.2 are presented.
SRF, as pre-treatment to upgrade the quality of the incoming waste. For S4 the use of coke appears significant to ADP fossil impact as a con-sequence of resource use for its production, but also contributes to GWP, AP and EP during its utilization. “Bottom ash landfill” accounts for a greater contribution to FAETP impact in S1 system, to a less extent in S3, due to the consumption of energy for mechanical treatment and the subsequent leaching of heavy metals within the considered time frame. On the other hand, the impacts resulting from “bottom ash landfill” are absent in S2 and S4 scenarios, being substituted by an avoided contribution from “slag recycling”, despite that this benefit is insignificant. As for the rest life cycle stages regarding “transportation”
and “APC residues stabilization and landfill”, they account for an in-significant contribution to all impact categories.
Overall, the contribution analysis has identified key processes con-tributed to the environmental impacts of each WtE system. Based on the results, a sensitivity analysis is conducted. In the following, the effects of key input parameters, operation conditions, and LCA modelling conditions are separately discussed inSection 3.1, 3.2, and 3.3. Fi-nally, the “best-case” scenarios are discussed inSection 3.4.
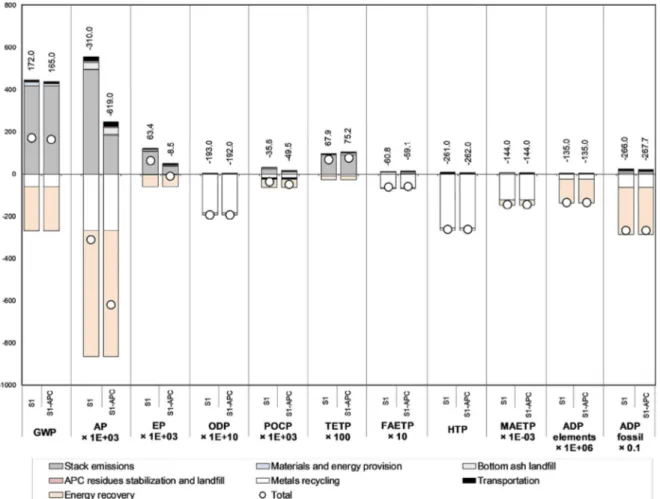
Fig. 6. The effect of improved air pollution control process on the environmental impacts of incineration (S1) WtE technology. Suffix letter “APC” stands for alternative “Air Pollution Control” option. Some impacts are scaled to fit the y-axis; their original values can be obtained by dividing the factor shown on the x-axis. Table 4
The effect of bottom ash recycling in road construction on the environmental impacts of incineration (S1) and gasification (S3) WtE technologies.
S1: incineration S3: gasification
S1 (base case) S1-BA recyclinga Variationb S3 (base case) S3-BA recyclinga Variationb
GWP [kg CO2eq.] 1.72E + 02 1.68E + 02 2.33% 1.04E + 02 1.03E + 02 0.96% AP [kg SO2eq.] −3.10E-01 −3.43E-01 10.65% −5.13E-01 −5.26E-01 2.53% EP [kg Phosphate eq.] 6.34E-02 5.63E-02 11.20% 4.08E-02 3.82E-02 6.37% ODP [kg R11 eq.] −1.93E-08 −1.94E-08 0.52% −1.49E-08 −1.49E-08 0.00% POCP [kg Ethene eq.] −3.56E-02 −3.90E-02 9.55% −4.51E-02 −4.63E-02 2.66% TETP [kg DCB eq.] 6.79E-01 6.66E-01 1.91% −2.28E-01 −2.33E-01 2.19% FAETP [kg DCB eq.] −6.08E + 00 −6.87E + 00 12.99% −4.94E + 00 −5.23E + 00 5.87% HTP [kg DCB eq.] −2.61E + 02 −2.65E + 02 1.53% −2.02E + 02 −2.03E + 02 0.50% MAETP [kg DCB eq.] −1.44E + 05 −1.47E + 05 2.08% −1.24E + 05 −1.25E + 05 0.81% ADP elements [kg Sb eq.] −1.35E-04 −1.36E-04 0.74% −1.74E-04 −1.74E-04 0.00% ADP fossil [MJ] −2.66E + 03 −2.74E + 03 3.01% −3.45E + 03 −3.48E + 03 0.87%
a Suffix letter “BA recycling” stands for “Bottom Ash recycling” in in specified scenarios.
b Grey row named “variation” represents the relative change of environmental impacts in BA recycling case to those in the base case. Only absolute values are
3.1. Importance of key input parameters to the LCA results
The critical parameters, which significantly affect the LCA results, have been identified through a perturbation analysis. The results are illustrated inFig. 5 in terms of SR values for seven selected impact categories. The results show that, among the 40–60 input parameters in each WtE system, around 15 parameters have SR values higher than ± 0.2. This means that, a 10% change in these parameters would lead to a variation of results larger than 2%.
Energy recovery efficiency is seen to be the most influential para-meter for all WtE technologies. The highest SR value of 22.9 is seen for EP of S4. Parameters related to the properties of feedstock, in particular the lower heating value of incoming waste and CO2,fossilstack emission, also stand out in all impact categories. These parameters are mainly dependent on waste composition, which highlight a relatively im-portant role of feedstock variability in determining the total results. NOxstack emission is also an important parameter, and is a result of the waste properties (N content), combustion technology and the effec-tiveness of APC system. To a lesser extent, Hg and NH3emissions in-fluence TETP and EP, respectively. Other key parameters are mainly related to metals recycling, for example, the amount of metal elements transferred to dedicated fractions (bottom ash in S1 and S3, or char in S2, or molten metals in S4), and their recovery efficiencies. In addition, some parameters are of importance to only specified systems. Examples of such parameters include internal electricity consumption in S2 and S3, and slag and APC residues management in S4. In summary, key parameters determining the environmental performance of WtE tech-nologies are found to be as follows:
•
An effective energy recovery is a relatively important parameter, at the same time, efforts should be paid to decrease as much as the internal energy consumption.•
The variation in feedstock plays a crucial role in determining the waste composition (such as, C-fossil and N content) and its heating value.•
An efficient air emissions control system is an important factor, and this is particularly true for NOxremoval.•
Metals recycling is also a key parameter and contributes to both non-toxic and toxic impacts.3.2. Importance of operating conditions to the LCA results 3.2.1. Effectiveness of air pollution control
The results from the contribution analysis (Fig. 4) demonstrate a crucial role of stack emissions to final environmental burdens. Due to this reason, the effectiveness of APC process is discussed in this work. In the base case, the APC line in each WtE system is based on “SNCR + dry Ca(OH)2scrubber + activate carbon”. Today, with gradually tightened emission standards, more effective APC techniques have been put in use
[50]. As a potential improvement, the use of “wet Ca(OH)2 scrubber + activate carbon + SCR” is evaluated. Detailed description of the APC techniques and operating data are provided in the
Supplementary Material. Furthermore, the results for incineration case are discussed inFig. 6. As expected, the related assumptions have led to a better environmental performance in S1-APC scenario, particularly in terms of AP, EP and POCP, which show a decrease of 99%, 113% and 39% as compare to S1, respectively. Compared to the results presented in Fig. 3, it is observed that AP, EP and POCP impacts of S1-APC
Fig. 7. The effect of applying pyrolysis char in land as soil amendment on the environmental impacts of pyrolysis (S2) WtE technology. Suffix letter “LA” stands for “Land Application” of the pyrolysis char. Some impacts are scaled to fit the y-axis; their original values can be obtained by dividing the factor shown on the x-axis.
scenario have surpassed pyrolysis and gasification scenarios (S2-S4) and become the most environmental-friendly scenario. As indicated previously in Fig. 5, this benefit is mainly due to the decreased NOx emission, and to a lesser extent, due to the decreased SO2, HCl and NH3 emissions.
Based upon this analysis, implementation of a more effective APC process can significantly reduce the overall environmental impacts, thus determining the relative sustainability of different WtE systems. 3.2.2. Bottom ash recycling
The results shown inFig. 4indicate varied environmental impacts from “bottom ash landfill” (in S1 and S3) and “slag recycling” (in S2 and S4) processes. The former is seen as an environmental burden due to the consumption of energy in landfill operation and leaching of toxic substances. Realizing that bottom ash shows similar technical proper-ties to those of natural aggregates, increasing efforts are taken to utilize bottom ash in road construction in many EU countries[51,52]. For this reason, the “bottom ash recycling” case is assessed in this work. Key data used for model estimation are detailed in the Supplementary Material, and the results are presented inTable 4.
Compared with the base case, assumptions on bottom ash recycling have resulted in decreased impacts for all categories. The benefits are mainly derived from the following factors: (1) decrease in energy consumption associated with ash landfill, (2) reduction in the provision of natural gravel. Incineration (S1-BA recycling) generally shows more sustainable impacts than gasification (S3-BA recycling), which is due to a higher amount of bottom ash generated and being recycled. However, the results show that the effect of bottom ash recycling is quite mar-ginal, which does not change the overall ranking of different WtE sys-tems. Similar findings were drawn by Birgisdottir [53], who report fairly equal environmental impacts for recycling or landfill of in-cineration bottom ash. The results on the other hand indicate that re-cycling can serve as a potential future management option for bottom ash, which in fact would be preferred over landfill as a means for
conserving resources. For this option, the limitation lies within the leaching emissions, as has recently been assessed by Allegrini[21]that road application of bottom ash may potentially lead to higher release of toxic substances.
3.2.3. Pyrolysis char utilization in land application
In the base case, char generated from pyrolysis is used as an energy source for electricity recovery. Comparatively, char applied in land is considered in this work. The LCA boundary of the char application process consists of char transport to dedicated farms, spreading it on soil, and the subsequent effects to soil. While energy utilization of char in the base case avoids electricity production, the land application of char provides several merits, including substitution of mineral fertili-zers (N, P and K), and long-term carbon sequestration. Detailed calcu-lation is available in theSupplementary Material.
Fig. 7shows the associated environmental impacts along with those from the base case. Char utilization in land shows higher saved impacts regarding GWP, AP and EP, and to lesser extent for ODP and POCP. Looking at the contribution of each life cycle stage, majority of the reduced impacts are associated with the decreased stack emissions, which is due to the exempted char combustion. The benefit is also re-flected by a negative contribution from the avoided production of mi-neral fertilizers, particularly for AP and EP. Conversely, the land ap-plication case significantly increases toxic impacts, such as TETP, FATEP and HTP, which is mainly due to metal emissions, and originally contained in char yet transferred to soil.
In short, the utilization pathway of pyrolysis char would greatly influence the environmental performance of pyrolysis (S2) system. Overall, it is difficult to figure out which application option is more favourable. However, critical life cycle hotspots can be identified. For example, it is important to consider the potential risk of metal con-taminants if char is to be used in land. This requires efforts to reduce the concentrations of metals in char, or modify them to become less re-active. Overall, there is a need to carefully address the potential
burdening impacts, so as to properly determine a better utilization route for char.
3.3. Importance of model conditions to the LCA results 3.3.1. Substituted energy sources
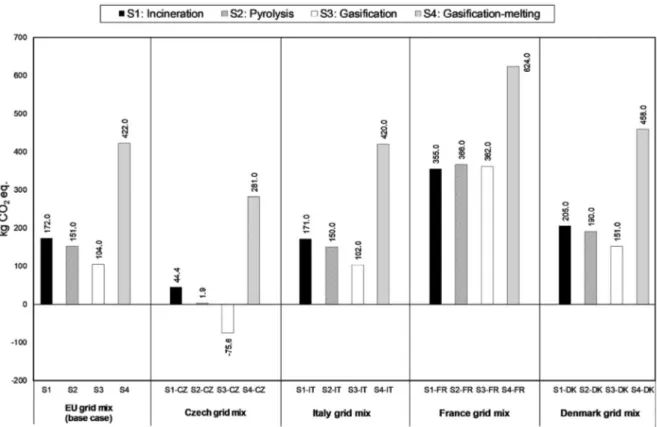
In the base case, the electricity produced is assumed to substitute the one provided by the EU grid mix. Concerning the importance of energy recovery process, alternative energy sources in individual countries are considered as substituted options, and these countries include Czech, Italy, France, and Denmark. These countries are selected because electricity from Czech is “dirtier” based on higher utilization of coal (50.4%). The French and Italian grid mixes are instead “cleaner” due to a predominant role of respectively nuclear (72.5%) and natural gas (44.5%) in their energy infrastructures. However, a higher ratio of
renewables (60.5%) is observed for Denmark’s energy infrastructure
[28].
The results for GWP impact are shown inFig. 8. It is noted that the sources of substituted electricity heavily affects the LCA results. GWP under different substituted energy sources is found to be in the fol-lowing descending order: France > Denmark > EU grid mix > Italy > Czech. This is due to the reason that, more the electricity is produced based on fossil fuels, higher are the GWP emissions, thus al-lowing increased environmental credits. The overall ranking of WtE systems changes, which means that GWP from incineration (S1) out-performs gasification (S3), provided the displaced electricity is based on French grid mix. This can be explained by the higher amount of electricity recovered from S3, which is more sensitive to the source of energy to be substituted.
These results are in accordance with the previous findings
Fig. 9. The effect of using alternative functional unit on the environmental impacts of the four different WtE technologies: (a) with reference to 1 kwh of electricity generated; (b) with reference to 1 kwh of exergy in output products. Some impacts are scaled to fit the y-axis; their original values can be obtained by dividing the factor shown on the x-axis.
[9,54,55]. The results highlight that, the assumptions on the substituted energy should be adequately addressed. For example, the geographical location of the specified plant has a certain significance, especially when the aim is to select an environmentally optimal WtE technology. 3.3.2. Alternative functional units
The robustness of LCA results is tested by changing the perspectives of functional unit. The “input-oriented” functional unit in the base case (i.e. 1 tonne of MSW) is shifted to two alternative “output-oriented” ones, as follows:(1)1 kwh of electricity generated, and (2) 1 kwh of exergy in the output products. The calculation data are provided in the
Supplementary Material.
Fig. 9 shows generally decreased impacts across all categories, which are 2–3 orders of magnitude less than the base case. This is ex-pected, as from the input-oriented perspective, the treatment of 1 tonne of MSW can result in around 500–800 kwh of electricity generation. Changing the functional unit has altered the ranking of different sce-narios. An improved performance is observed for incineration (S1-FU2, S1-FU3) regarding HTP, MAETP and ADP fossil impacts, and gasifica-tion-melting (S4-FU2, S4-FU3) regarding AP and POCP impacts. This can be explained by the differences of energy efficiencies. Gasification (S3) and pyrolysis (S2) produce higher amount of electricity and exhibit greater avoided (negative) impacts from the input-oriented perspective. However, this benefit is offset if the functional unit is fixed at an identical amount of electricity or exergy output. The results also show that the delivery of 1 kwh of electricity (Fig. 9a) or 1 kwh of exergy (Fig. 9b) has little difference in environmental impacts, which is due to the reason that exergy contained in the recovered electricity has con-tributed to a majority proportion (87–95%) of the total output products. Overall, this analysis confirms that changing the functional unit in LCA would result in different environmental performance. The comparison of different WtE systems requires a very cautious selection of input or output perspective in order to properly interpret the results.
3.3.3. Long-term time frame
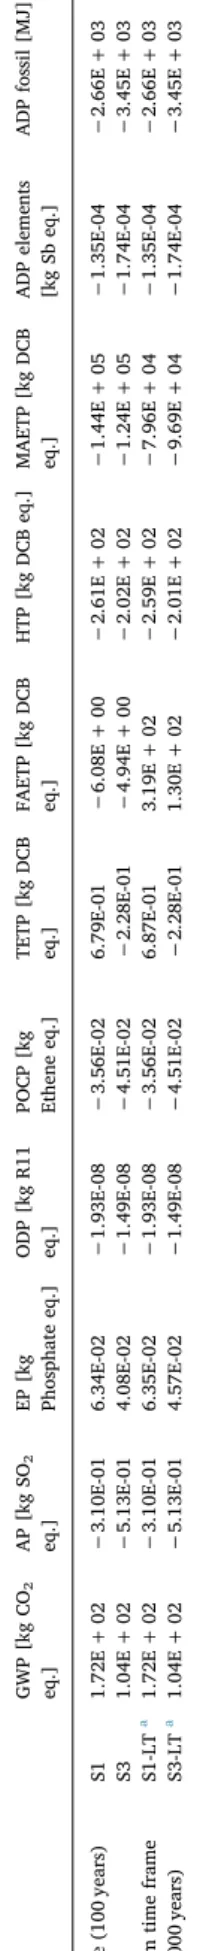
The time frame considered in this study is 100 years, which follows the common practice observed within the LCA. However, it is necessary for the sensitivity analysis to consider a long-term time frame, which aims at quantifying the “worst case” environmental consequences.
The analysis is focused on bottom ash after it is landfilled, and therefore, is relevant only for incineration (S1) and gasification (S3) systems. The long-term perspective considers 60,000 years, using TCs of substance leaching sourced from Doka [23]. The resulted environ-mental impacts are listed inTable 5. As expected, increased burdens are shown when expanding the time frame. This affects mainly the toxic-related impacts, together with EP, which are ascribed to accumulated leaching of heavy metals. Among all categories, FAETP and MAETP are considerably more sensitive, particularly FAETP impact is shifted from an environmental saving to a burden, which has significantly deterio-rated the performance of incineration and gasification cases.
3.4. “Best-case” scenarios
Finally, two “best-case” scenarios are modelled. The aim is to ex-amine the performance of most state-of-the-art WtE technologies.
For incineration (S1), the operating data from AEB plant in Amsterdam are analysed[44]. Due to innovative optimizations, such as increasing steam parameters (440 °C, 125 bar), use of steam reheating and water-steam cycle, and flue gas recirculation, the net energy effi-ciency of the plant reaches 30.6%, which is the highest among world’s incineration plants. The APC employs “SNCR + activate carbon + wet Ca(OH)2 scrubber” to control stack emissions (see details in the
Supplementary Material). The plant also recycles various residual ma-terials. The results shown inFig. 10 confirm an improved environ-mental performance from the use of this Best Available Technology (BAT). All impacts from SI-BAT case show 4–229% decrease compared
Table 5 The eff ect of using alternative long-term time frame (60,000 years) on the environmental impacts of incineration (S1) and gasi fi cation (S3) WtE technologies. GWP [kg CO 2 eq.] AP [kg SO2 eq.] EP [kg Phosphate eq.] ODP [kg R11 eq.] POCP [kg Ethene eq.] TETP [kg DCB eq.] FAETP [kg DCB eq.] HTP [kg DCB eq.] MAETP [kg DCB eq.] ADP elements [kg Sb eq.] ADP fossil [MJ] Base case (100 years) S1 1.72E + 02 − 3.10E-01 6.34E-02 − 1.93E-08 − 3.56E-02 6.79E-01 − 6.08E + 00 − 2.61E + 02 − 1.44E + 05 − 1.35E-04 − 2.66E + 03 S3 1.04E + 02 − 5.13E-01 4.08E-02 − 1.49E-08 − 4.51E-02 − 2.28E-01 − 4.94E + 00 − 2.02E + 02 − 1.24E + 05 − 1.74E-04 − 3.45E + 03 Long-term time frame (60,000 years) S1-LT a 1.72E + 02 − 3.10E-01 6.35E-02 − 1.93E-08 − 3.56E-02 6.87E-01 3.19E + 02 − 2.59E + 02 − 7.96E + 04 − 1.35E-04 − 2.66E + 03 S3-LT a 1.04E + 02 − 5.13E-01 4.57E-02 − 1.49E-08 − 4.51E-02 − 2.28E-01 1.30E + 02 − 2.01E + 02 − 9.69E + 04 − 1.74E-04 − 3.45E + 03 Legend with dark grey indicates a high changing of the impacts, light grey low and white with no changing. aSu ffi x letter “LT ” stands for “Long-Term ” time frame in speci fi ed scenarios.
to the base case (S1). The SI-BAT case has effectively surpassed S2, S3 and S4, showing the lowest impacts regarding 6 out of 11 categories (GWP, AP, EP, POCP, MAETP and ADP elements). This reveals that modern incineration has the potential to fulfill an environmentally sound technology, over pyrolysis and gasification at present.
For gasification (S3), the “best-case” scenario is not dedicated to examining the performance of an alternative plant. Instead, the po-tential of the co-firing of cleaned syngas in existing boilers is assessed. This option represents one of the future perspectives for gasification due to several reasons [56,57]: (1) cleaned syngas connected to for example a coal-fired boiler allows the use of high steam parameters, thus exhibiting a huge potential to improve energy recovery efficiency; (2) the introduction of gas instead of solid fuels into boilers can mini-mize problems related to correction, fouling, and ash quality; (3) the utilization of existing infrastructure can reduce the requirements for additional investment. For these purposes, S3-BAT scenario considers that the syngas produced from gasification is sent for co-firing in a coal plant, and assumes a net electricity efficiency of 35.4% based on the value of EU average[58]. The results presented inFig. 10show that S3-BAT scenario provides a superior performance with regards to 6 out of 11 impacts (GWP, AP, POCP, TETP, ADP elements and ADP fossil) when compared with the four WtE base cases. This again verifies the im-portance of boosting energy efficiency.
4. Discussion and future recommendations
The comparison among four most common WtE technologies, namely incineration (S1), pyrolysis (S2), gasification (S3), and gasifi-cation coupled with ash melting (S4), indicates an overall sustainable performance of all considered systems, which means that 8 out of 11 impacts show net environmental benefits. The impacts are much lower than those from the EU grid mix. For example, for the generation of 1 kwh of electricity, WtE technologies have the potential to reduce 18–68% of GWP (except for S4) by avoiding coal and natural gas. A brief calculation is conducted from a much broader perspective of functional unit, and assumes that the WtE plants are dedicated to managing 2,000 t/d of residual waste, which is a typical treatment capacity by a good sized metropolitan city [59]. In such a case, 23,000–130,000 tonnes of GWP emissions per year could be avoided from the EU grid mix, which are equivalent to 16,000–25,000 tonnes of
coal and 12–19 million m3of natural gas. This fact clearly indicates the huge potential for future development of WtE technologies.
The results from both contribution analysis (Fig. 4) and perturbation analysis (Fig. 5) confirm that energy recovery efficiency is one of the most critical parameters affecting the environmental performance of WtE technologies. The results presented inFig. 10further reveal the importance of improving plant efficiency in determining the relative ranking of each technology. This clearly indicates potential future areas for development. For incineration, positive experience gained from Amsterdam’s AEB plant could serve as the basis of a number of tech-nical optimisations designed to improve energy efficiency. For pyrolysis and gasification, a feasible application would be the use of syngas in existing power stations or other industrial plants, where the process could benefit from higher efficiency of host plants. Potential long-term development of pyrolysis and gasification includes the use of more ef-ficient equipment, such as a combined cycle gas turbine[60]. However, this application has not yet matured enough to meet the market de-mand.
The results from this study show developing attractiveness for pyrolysis and gasification WtE technologies. However, these technolo-gies are still less commercialized at present. One important obstacle is associated with the variability of feedstock, as the applications of pyr-olysis and gasification to WtE are often limited to few specific waste fractions (such as, SRF, plastic, and rubber tyres[61]). Factually, a higher degree of pre-treatment is generally required, even if some ga-sification technologies are able to accept raw MSW (for example, S4 system in this study). Therefore, improving the fuel quality seems im-portant to reduce as much as of energy consumed for waste segregation, drying, and homogenization. A feasible approach could be to integrate the plants with an upstream material recovery facility, or mechanical biological treatment plants. Besides, waste pre-processing before WtE is also efficient for incineration, as is shown inFig. 5, increasing the waste lower heating value enables a higher recovery of electricity to effec-tively decrease the associated environmental burdens.
Energy, environment, economic, and social performance of WtE technologies are all of great interest to authorities[2,62]. Therefore, a brief discussion of economic aspect is conducted in this work. It is evident that an accurate cost estimation and fair comparison among different WtE technologies cannot be addressed. This is due to a variety of issues, such as: (i) lack of sufficient operational data; (ii) variations in
Fig. 10. The effect of using Best Available Technology in incineration (S1) and gasification (S3) WtE technologies. Suffix letter “BAT” stands for “Best Available Technology”. Some impacts are scaled to fit the y-axis; their original values can be obtained by dividing the factor shown on the x-axis.
regional energy cost, availability of resources; (iii) variations in gov-ernmental regulations and incentives[3]. Despite this fact, a detailed literature review of the cost structure of WtE technologies shows comparable annual capital and net operational cost between incinera-tion and pyrolysis/gasificaincinera-tion [63]. Several studies [64,65] have shown that the net cost from gasification plants can even be lower than that from incineration, which is due to the higher efficiency of gasifi-cation that allows for a higher revenue from the export of electricity. Apart from these spatial and temporal factors, scale effects should also be accounted for when different WtE options are compared. This is due to the reason that an increasing plant size can lead to a drop in treat-ment cost[3].
To conclude, a range of critical input parameters, processes, oper-ating conditions and modelling assumptions influence the environ-mental impacts of different WtE technologies and have been identified comprehensively in this study. These factors should therefore be fo-cused on when considering potential areas of improvements throughout all stages of each WtE technology.
Declaration of Competing Interest
The authors declare that they have no known competing financial interests or personal relationships that could have appeared to influ-ence the work reported in this paper.
Acknowledgements
This project is supported by the French Centre National de la Recherche Scientifique (CNRS) and the Labex SOLSTICE (Agence Nationale de la Recherche, ANR).
Appendix A. Supplementary data
Supplementary data to this article can be found online athttps:// doi.org/10.1016/j.enconman.2019.06.016.
References
[1] Carneiro MLNM, Gomes MSP. Energy, exergy, environmental and economic analysis
of hybrid waste-to-energy plants. Energ Convers Manage. 2019;179:397–417.
[2] Tan ST, Ho WS, Hashim H, Lee CT, Taib MR, Ho CS. Energy, economic and
en-vironmental (3E) analysis of waste-to-energy (WTE) strategies for municipal solid
waste (MSW) management in Malaysia. Energ Convers Manage. 2015;102:111–20.
[3] Mayer F, Bhandari R, Gäth S. Critical review on life cycle assessment of
conven-tional and innovative waste-to-energy technologies. Sci Total Environ.
2019;672:708–21.
[4] Arena U. From waste-to-energy to waste-to-resources: the new role of thermal
treatments of solid waste in the Recycling Society. Waste Manag. 2015;37:1–3.
[5] Arena U, Ardolino F, Di Gregorio F. A life cycle assessment of environmental
per-formances of two combustion-and gasification-based waste-to-energy technologies.
Waste Manag. 2015;41:60–74.
[6] Kumar A, Samadder S. A review on technological options of waste to energy for
effective management of municipal solid waste. Waste Manag. 2017;69:407–22.
[7] Luz FC, Rocha MH, Lora EES, Venturini OJ, Andrade RV, Leme MMV, et al.
Techno-economic analysis of municipal solid waste gasification for electricity generation in
Brazil. Energ Convers Manage. 2015;103:321–37.
[8] Panepinto D, Tedesco V, Brizio E, Genon G. Environmental performances and
en-ergy efficiency for MSW gasification treatment. Waste Biomass Valori.
2015;6:123–35.
[9] Astrup TF, Tonini D, Turconi R, Boldrin A. Life cycle assessment of thermal
waste-to-energy technologies: review and recommendations. Waste Manag.
2015;37:104–15.
[10] Laurent A, Clavreul J, Bernstad A, Bakas I, Niero M, Gentil E, et al. Review of LCA
studies of solid waste management systems–Part II: Methodological guidance for a
better practice. Waste Manag. 2014;34:589–606.
[11] Boesch ME, Vadenbo C, Saner D, Huter C, Hellweg S. An LCA model for waste
incineration enhanced with new technologies for metal recovery and application to
the case of Switzerland. Waste Manag. 2014;34:378–89.
[12] Lausselet C, Cherubini F, del Alamo Serrano G, Becidan M, Strømman AH. Life-cycle
assessment of a Waste-to-Energy plant in central Norway: current situation and
effects of changes in waste fraction composition. Waste Manag. 2016;58:191–201.
[13] Cucchiella F, D’Adamo I, Gastaldi M. Sustainable waste management: Waste to
energy plant as an alternative to landfill. Energ Convers Manage. 2017;131:18–31.
[14] Nabavi-Pelesaraei A, Bayat R, Hosseinzadeh-Bandbafha H, Afrasyabi H, Chau K-W.
Modeling of energy consumption and environmental life cycle assessment for in-cineration and landfill systems of municipal solid waste management - a case study
in Tehran Metropolis of Iran. J Clean Prod. 2017;148:427–40.
[15]Evangelisti S, Tagliaferri C, Clift R, Lettieri P, Taylor R, Chapman C. Life cycle
assessment of conventional and two-stage advanced energy-from-waste
technolo-gies for municipal solid waste treatment. J Clean Prod. 2015;100:212–23.
[16]Zaman A. Life cycle assessment of pyrolysis–gasification as an emerging municipal
solid waste treatment technology. Int J Environ Sci Technol. 2013;10:1029–38.
[17]Khandelwal H, Dhar H, Thalla AK, Kumar S. Application of life cycle assessment in
municipal solid waste management: A worldwide critical review. J Clean Prod.
2019;209:630–54.
[18]Trindade AB, Palacio JCE, González AM, Rúa Orozco DJ, Lora EES, Renó MLG, et al.
Advanced exergy analysis and environmental assesment of the steam cycle of an incineration system of municipal solid waste with energy recovery. Energ Convers
Manage. 2018;157:195–214.
[19]Makarichi L, Jutidamrongphan W, Techato K-A. The evolution of waste-to-energy
incineration: a review. Renew Sust Energ Rev. 2018;91:812–21.
[20]Bisinella V, Götze R, Conradsen K, Damgaard A, Christensen TH, Astrup TF.
Importance of waste composition for Life Cycle Assessment of waste management
solutions. J Clean Prod. 2017;164:1180–91.
[21]Allegrini E, Vadenbo C, Boldrin A, Astrup TF. Life cycle assessment of resource
recovery from municipal solid waste incineration bottom ash. J Environ Manage.
2015;151:132–43.
[22]Burnley S, Coleman T, Peirce A. Factors influencing the life cycle burdens of the
recovery of energy from residual municipal waste. Waste Manag. 2015;39:295–304.
[23]Doka G. Life cycle inventories of waste treatment services. Ecoinvent report No. 13,
Part III. Landfills–underground deposits–landfarming 2003.
[24]Lieberei J, Gheewala SH. Resource depletion assessment of renewable electricity
generation technologies—comparison of life cycle impact assessment methods with
focus on mineral resources. Int J LCA 2017;22:185–98.
[25] ISO. ISO 14040: Environmental management–life cycle assessment–principles and framework, second ed., ISO, Geneva, 2006.
[26]European Commission (EC). International Reference Life Cycle Data System (ILCD)
Handbook - General Guide for Life Cycle Assessment - Detailed Guidance.
Luxembourg, LU: Publications Office of the European Union; 2010.
[27]Tanigaki N, Manako K, Osada M. Co-gasification of municipal solid waste and
material recovery in a large-scale gasification and melting system. Waste Manag.
2012;32:667–75.
[28] EU Commission, DG ENER. Energy Statistics, Energy datasheets: EU-28 countries, data for year 2016. August 2018.
[29]Manders J. Life Cycle Assessment of the treatment of MSW in “the average
“European to-Energy plant. Proceedings of 6th Beacon Conference on
Waste-to-Energy, Malmö. 2009.
[30]Reimann D. CEWEP Energy Report III (status 2007–2010) - Results of Specific Data
for Energy, R1 Plant Efficiency Factor and NCV of 314 European Wasteto-Energy
(WtE) Plants. Würzburg/Brussels: CEWEP; 2012.
[31]Koehler A, Peyer F, Salzmann C, Saner D. Probabilistic and technology-specific
modeling of emissions from municipal solid-waste incineration. Environ Sci
Technol. 2011;45:3487–95.
[32]Tanigaki N, Ishida Y, Osada M. A case-study of landfill minimization and material
recovery via waste co-gasification in a new waste management scheme. Waste
Manag. 2015;37:137–46.
[33]Beylot A, Villeneuve J. Environmental impacts of residual Municipal Solid Waste
incineration: a comparison of 110 French incinerators using a life cycle approach.
Waste Manag. 2013;33:2781–8.
[34] Beylot A, Hochar A, Michel P, Descat M, Ménard Y, Villeneuve J. Municipal Solid Waste Incineration in France: An Overview of Air Pollution Control Techniques, Emissions, and Energy Efficiency. J Ind Ecol. 2017.https://doi.org/10.1111/jiec.
12701.
[35]Fruergaard T, Hyks J, Astrup T. Life-cycle assessment of selected management
options for air pollution control residues from waste incineration. Sci Total Environ.
2010;408:4672–80.
[36]Czajczyńska D, Anguilano L, Ghazal H, Krzyżyńska R, Reynolds A, Spencer N, et al.
Potential of pyrolysis processes in the waste management sector. Therm Sci Eng
Prog. 2017;3:171–97.
[37] Stein W, Tobiasen L. Review of Small Scale Waste Conversion Systems. IEA Bioenergy Agreement - Task 36, Work Topic 42004.
[38]Arena U, Di Gregorio F. Element partitioning in combustion-and gasification-based
waste-to-energy units. Waste Manag. 2013;33:1142–50.
[39] DGEngineering - The rotary kiln engineers. 2009. Waste pyrolysis plant “Burgau”, Burgau MW pyrolysis plant.
[40] Savelainen J, Isaksson J. 2015. Kymijärvi II plant: High-efficiency use of SRF in power production through gasification. Report by Lahti Energy Ltd and Metso Power Oy, Finland.
[41]Konttinen J, Backman R, Hupa M, Moilanen A, Kurkela E. Trace element behavior
in the fluidized bed gasification of solid recovered fuels–a thermodynamic study.
Fuel 2013;106:621–31.
[42]Arena U, Di Gregorio F. Gasification of a solid recovered fuel in a pilot scale
flui-dized bed reactor. Fuel 2014;117:528–36.
[43]Nasrullah M, Vainikka P, Hannula J, Hurme M, Kärki J, Mass. energy and material
balances of SRF production process. Part 3: Solid recovered fuel produced from
municipal solid waste. Waste Manage Res. 2015;33:146–56.
[44]Wood S, Fanning M, Venn M, Whiting K. Review of state-of-the-art waste-to-energy
technologies. Stage two: Case Studies. WSP UK Limited, London, Uk; 2013.
[45]Tanigaki N, Fujinaga Y, Kajiyama H, Ishida Y. Operating and environmental
Manage Res. 2013;31:1118–24.
[46] Christensen TH, Gentil E, Boldrin A, Larsen AW, Weidema BP, Hauschild M. C
balance, carbon dioxide emissions and global warming potentials in LCA-modelling
of waste management. systems. 2009;27:707–15.
[47] Flórez-Orrego D, Maréchal F, de Oliveira Junior S. Comparative exergy and
eco-nomic assessment of fossil and biomass-based routes for ammonia production.
Energ Convers Manage. 2019;194:22–36.
[48] Clavreul J, Guyonnet D, Christensen TH. Quantifying uncertainty in LCA-modelling
of waste management systems. Waste Manag. 2012;32:2482–95.
[49] Leckner B. Process aspects in combustion and gasification Waste-to-Energy (WtE)
units. Waste Manag. 2015;37:13–25.
[50] Vehlow J. Air pollution control systems in WtE units: An overview. Waste Manag.
2015;37:58–74.
[51] Di Gianfilippo M, Costa G, Pantini S, Allegrini E, Lombardi F, Astrup TF. LCA of
management strategies for RDF incineration and gasification bottom ash based on
experimental leaching data. Waste Manag. 2016;47:285–98.
[52] Astrup T. Pretreatment and utilization of waste incineration bottom ashes: Danish
experiences. Waste Manag. 2007;27:1452–7.
[53] Birgisdottir H, Bhander G, Hauschild MZ, Christensen TH. Life cycle assessment of
disposal of residues from municipal solid waste incineration: recycling of bottom ash in road construction or landfilling in Denmark evaluated in the ROAD-RES
model. Waste Manag. 2007;27:S75–84.
[54] Turconi R, Butera S, Boldrin A, Grosso M, Rigamonti L, Astrup T. Life cycle
as-sessment of waste incineration in Denmark and Italy using two LCA models. Waste
Manage Res. 2011;29(Supplement):78–90.
[55] Andreasi Bassi S, Christensen TH, Damgaard A. Environmental performance of
household waste management in Europe - An example of 7 countries. Waste Manag.
2017;69:545–57.
[56]Hrbek J. Status report on thermal biomass gasification in countries participating in
IEA Bioenergy Task 33. Austria: Vienna University of Technology; 2016.
[57]Vainikka P, Nieminen M, Sipilä K. Waste firing in large combustion plants. Waste to.
Energy Conversion Technolog. Elsevier 2013:98–119.
[58] World Energy Council. 2016. Energy Efficiency Indicators: Efficiency of coal-fired power plant (Year: 2014).
http://wec-indicators.enerdata.net/coal-fired-power-plants-efficiency.html. (last accessed: 15/10/2018).
[59]Ripa M, Fiorentino G, Vacca V, Ulgiati S. The relevance of site-specific data in Life
Cycle Assessment (LCA). The case of the municipal solid waste management in the
metropolitan city of Naples (Italy). J Clean Prod. 2017;142:445–60.
[60]Arena U. Process and technological aspects of municipal solid waste gasification. A
review. Waste Manag. 2012;32:625–39.
[61]Lombardi L, Carnevale E, Corti A. A review of technologies and performances of
thermal treatment systems for energy recovery from waste. Waste Manag.
2015;37:26–44.
[62]Nabavi-Pelesaraei A, Bayat R, Hosseinzadeh-Bandbafha H, Afrasyabi H, Berrada A.
Prognostication of energy use and environmental impacts for recycle system of
municipal solid waste management. J Clean Prod. 2017;154:602–13.
[63]Ouda OKM, Raza SA, Nizami AS, Rehan M, Al-Waked R, Korres NE. Waste to energy
potential: a case study of Saudi Arabia. Renew Sust Energ Rev. 2016;61:328–40.
[64]Jadhao SB, Shingade SG, Pandit AB, Bakshi BR. Bury, burn, or gasify: assessing
municipal solid waste management options in Indian megacities by exergy analysis.
Clean Technol Environ Policy 2017;19:1403–12.
[65]Rizwan M, Saif Y, Almansoori A, Elkamel A. Optimal processing route for the
uti-lization and conversion of municipal solid waste into energy and valuable products.