HAL Id: hal-02496600
https://hal-mines-albi.archives-ouvertes.fr/hal-02496600
Submitted on 3 Mar 2020
HAL is a multi-disciplinary open access
archive for the deposit and dissemination of
sci-entific research documents, whether they are
pub-lished or not. The documents may come from
teaching and research institutions in France or
abroad, or from public or private research centers.
L’archive ouverte pluridisciplinaire HAL, est
destinée au dépôt et à la diffusion de documents
scientifiques de niveau recherche, publiés ou non,
émanant des établissements d’enseignement et de
recherche français ou étrangers, des laboratoires
publics ou privés.
Plastic Fuel Conversion and Characterisation: A Waste
Valorization Potential for Ghana
Michael Commeh, David Dodoo-Arhin, Edward Acquaye, Isaiah Nimako
Baah, Nene Kwabla Amoatey, James Hawkins Ephraim, David Obada, Doan
Pham Minh, Ange Nzihou
To cite this version:
Michael Commeh, David Dodoo-Arhin, Edward Acquaye, Isaiah Nimako Baah, Nene Kwabla Amoatey,
et al.. Plastic Fuel Conversion and Characterisation: A Waste Valorization Potential for Ghana.
MRS Advances, Cambridge University Press, 2020, 5 (26), pp.1349-1356. �10.1557/adv.2020.127�.
�hal-02496600�
Plastic Fuel Conversion and Characterisation: A
Waste Valorization Potential for Ghana
Michael Commeh1*, David Dodoo-Arhin2*, Edward Acquaye3 Isaiah Nimako Baah4, Nene
Kwabla Amoatey5, James Hawkins Ephraim4, David O. Obada6, D. Pham Minh7, A. Nzihou7
1Technology Consultancy Centre, Kwame Nkrumah University of Science and Technology, Kumasi,
Ghana
2Department of Materials Science and Engineering, University of Ghana, Legon-Accra, Ghana 3Tema Oil Refinery, Tema-Ghana
4Comeph and Associates Ghana Ltd, Accra, Ghana
5Department of Chemical Engineering, Kwame Nkrumah University of Science and Technology,
Kumasi, Ghana
6Department of Mechanical Engineering, Ahmadu Bello University, Zaria, Nigeria 7 Centre RAPSODEE, CNRS, Mines Albi, Route de Teillet, 81013 Albi Cedex 09, France
Corresponding Authors: David Dodoo-Arhin (ddodoo-arhin@ug.edu.gh ) and Michael Commeh
(mcommeh.tcc@knust.edu.gh)
Abstract
Plastics generally play a very important role in a plethora of industries, fields and our everyday lives. In spite of their cheapness, availability and important contributions to lives, they however, pose a serious threat to the environment due to their mostly non-biodegradable nature. Recycling into useful products can reduce the amount of plastic waste. Thermal degradation (Pyrolysis) of plastics is becoming an increasingly important recycling method for the conversion of plastic materials into valuable chemicals and oil products. In this work, waste Polyethylene terephthalate (PET) water bottles were thermally converted into useful gaseous and liquid products. A simple pyrolysis reactor system has been used for the conversions with the liquid product yield of 65 % at a temperature range of 400°C to 550°C. The chemical analysis of the pyrolytic oil showed the presence of functional groups such as alkanes, alkenes, alcohols, ethers, carboxylic acids,
esters, and phenyl ring substitution bands. The main constituents were Tetradecene, 1-Pentadecene, Cetene, Hexadecane, 1-Heptadecene, Heptadecane, Octadecane, Nonadecane, Eicosane, Tetratetracontane, 1-Undecene, 1-Decene). The results are promising and can be maximized by additional techniques such as hydrogenation and hydrodeoxygenation to obtain value-added products.
INTRODUCTION
Many municipal landfills will reach the end of their life expectancy within the next decades especially in the developed world. Recycling can reduce the amount of waste relegated to landfills and increase landfill life expectancy. Plastic represents about 8 wt% of the municipal solid waste and it generally consists of mixture of different kind of plastics. This waste is difficult to be treated or recycled due to its complex nature and composition, structural deterioration of the polymeric components and the contamination with various organic, inorganic or biological residues. The benefits of plastics are however, undeniable. The material is cheap, lightweight and easy to make. These qualities have led to a boom in the production of plastics over the past century. Since the 1950s, the production of plastics has outpaced that of almost every other material. This trend is expected to continue as global plastic production skyrockets over the next few decades. Much of the plastics produce are designed to be thrown away after being used only once. In 2016, the world plastics production totalled around 335 million metric tons; around three-quarters (251 million tonnes) ended up as waste [1]. Only nine per cent of the nine billion tonnes of plastic the world has ever produced has been recycled. Most ends up in landfills, dumps, oceans or in the environment.
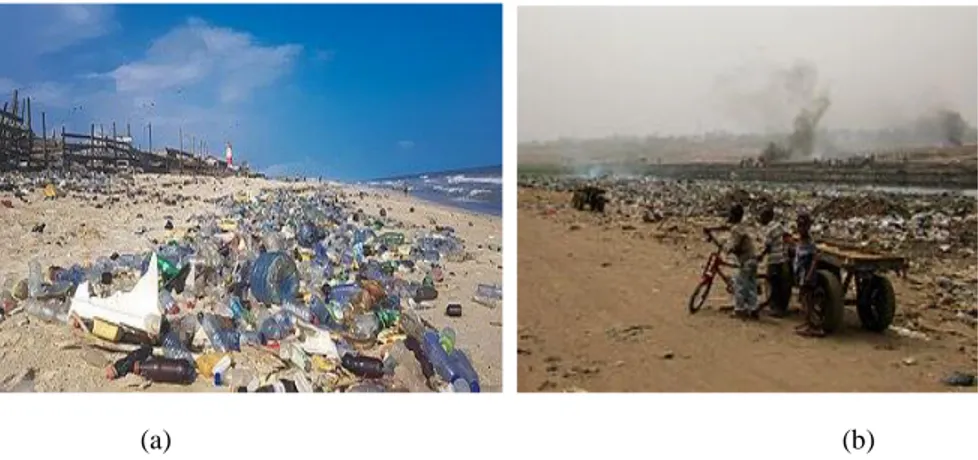
(a) (b)
Figure 1a & b: Plastic waste on Ghanaian Beach (a) and collected plastics being burnt for various recycling output reasons.
Disposing of plastic waste by burning it in open-air pits releases harmful gases like furan and dioxin [2]. Thus, recycling is becoming increasingly necessary to help curb the plastic menace, especially through simple tools and appropriate technologies for developing countries like Ghana [3-5]
.
In 2010, 31 million tonnes of plastic wastes were generated and only about 8% of the total waste produced was recycled. The remaining 92% find their way in land fill sites, ocean, stomach of animals, or burnt into the atmosphere, etc [6,7, 8]. Pyrolysis is one of the best methods to recover the material and energy from polymer waste, as only about 10% of the energy content of the waste plasticis used to convert the scrap into valuable hydrocarbon products [9, 10]
.
The worlds limited reserve of coal, crude oil and natural gas places great pressure on mankind to preserve its existing non-renewable materials. From their chemical formula, most polymers (plastics) are only composed of carbon and hydrogen; however, some plastics may also contain low contents of oxygen due to the presence of additives, impurities or moisture [11,12]. Cepeliogullar et al [13] and Fakhrhoseini et al [14] have explored the potential of PET in a pyrolysis process to produce liquid oil using fixed-bed reactors at 500 ℃. The heating rates were 10 ℃/min and nitrogen gas was used as the sweeping gas in their experiments. In this current work, we explore a fast pyrolytic conversion of waste Polyethylene terephthalate (PET) water bottles into useful fuels using a simple stainless steel reactor system under pressure of 0.1 bar without the use of any inert the sweeping gas.EXPERIMENTAL
Materials and Methods
The pyrolysis setup consisted of a 5kg capacity stainless-steel batch cylindrical reactor sealed at one end and a copper tube (80 cm long) outlet at other end leading to reservoirs for liquid and gas products collection. The reactor was equipped with a pressure gauge and heated externally via a gas burner, with a Cr-Al:K-type thermocouple fixed inside the reactor and connected to an external PID controller.
Waste PET plastic bottle materials were shredded into pieces (2-3cm) and then oven dried at 50°C for three (3) hours to get rid of any moisture. One (1kg) kilogram of the as-dried raw plastic waste materials were then fed into the pyrolysis reactor and air tightly closed for the pyrolysis process. The temperature in the reactor operating at atmospheric pressure was quickly increased from room temperature to a temperature range of 450 °C to 580 °C at a rate of 20 °C/min. At this point in the pyrolysis process the waste plastic quickly changed into hazy gaseous vapour flowing at 0.05 bar, that condensed to produce a liquid hydrocarbon fuel at atmospheric pressure. The condensation process of the gaseous vapour went through pressured air system and through ice cubes cooled system. The condensed liquid fuel and gases were collected for analysis. The percentage yield of fuel production, light gases and residue was also determined.
Characterisation of Pyrolysis Products: Gas and Oils
A Micro gas chromatograph (MyGC Agilent) fast gas analyser was used to quantify the major components in the permanent gas (H2, O2, N2, CO, CO2, CH)
recovered. The liquid fuel was analysed on a Shimadzu GCMS-TQ8030 triple quadrupole GC/MS/MS spectrometer equipped with a flame ionization detector, an AOC 5000 plus autosampler and GCMS Solution 4.2 software with SmartMRM and MRM Optimization Tool. Typically, 0.1 g liquid sample was diluted in 2 mL N-heptane, sonicated for 2 min and 0.1 μL of the solution was injected in an RXI-5Sil-MS (Restek 13623) column (L =30 m, Ø =0.25 mm, e =0.25 μm). The oven was heated from 80 °C to 220 °C with a heating ramp of 10 °C/min, then to 320 °C with a heating ramp of 5 °C/min and held for 10 min at 320 °C, carrier gas was helium (1 mL/ min). Injection was executed in splitless mode. For the Mass spectra detection, the ion source and quadrupole analyser temperatures were maintained at 250°C with a selected solvent delay time of 6 min. Mass spectrometric ionization was undertaken in electron ionization (EI) mode with an EI voltage of 70 eV. Multiple reaction monitoring (MRM) scan mode was performed
initially within the mass range of 50–600 amu and the data collected and analyzed using the NIST library software. FTIR of the pyrolysis oil samples obtained on a Nicolet iS10 FT-IR Spectrometer (Thermo Fisher Scientific) equipped with an OMNIC Spectra multi-component search tool software with resolution of 4 cm−1, in the range of 400–4000 cm−1 using Sodium chloride IR spectroscopy plates.
RESULTS AND DISCUSSIONS
Percentage pyrolysis products yield and Physical Properties of Oil Samples.
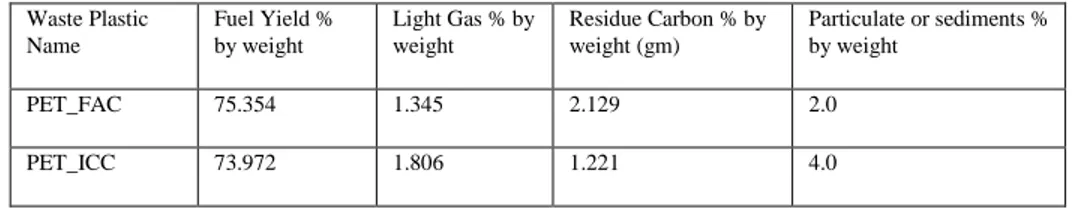
After each experiment, the percentage yields of fuel production, light gases and residue was calculated. Typically, the liquid fuel yields for the forced-air cooled and Ice-cooled conversions were ~75.35 % and 73.97 % respectively as shown in table1a. It is worth noting that, in the PET pyrolysis work of Cepeliogullar and Putun [13], It was observed that the liquid oil yield was lesser than the gaseous product. The liquid oil obtained was 23.1 wt% while the gaseous product was 76.9 wt % with no solid residue left. Similarly, even though Fakhrhoseini and Dastanian [14] found slightly higher liquid oil yield at the same operating temperature and heating rate; the liquid yield was 39.89 wt%, 52.13 wt% gaseous and 8.98 wt% solid residue. This led to a conclusion that PET might be the most suitable plastic to be used in pyrolysis if gaseous product became a preference, for instance to provide energy supply to heat up the reactor at the desired temperature. Hence the pyrolysis approach adopted in this paper is very efficiency on liquid fuel production.
Table 1a. showing the fuel production yield percentage Waste Plastic Name Fuel Yield % by weight Light Gas % by weight Residue Carbon % by weight (gm) Particulate or sediments % by weight PET_FAC 75.354 1.345 2.129 2.0 PET_ICC 73.972 1.806 1.221 4.0
The physical properties of each fuel such as fuel density, specific gravity, fuel colour and fuel appearance respectively are shown in table 1b. The appearance of the oils was yellow for the forced air cooled and dark red for the iced cooled: they were free from visible sediments. The density and viscosity of the liquid product can be modified by blending it with commercial transportation products. The analysis was done using ASTM protocol by Ghana Standards Authority.
Table1b: physical characteristics of plastic fuel under forced air conversion (PET-FAC) and under ice cooled conversion (PET-ICC), Ghana Standards Authority
Fuel Density @ 15°C (kg/m3) Colour Final Boiling Point (oC) Distillation (oC) Residue (% vol) Research Octane Number 10% evaporated 50% evaporated 90% evaporated PET-FAC 751 yellow 336 104 180 316 2.5 99 PET-ICC 825 Dark red 342 122 262 342 4.0 -
The flash point of the liquid product is in a comparable range, and a pour point of 20° C is acceptable for most geographic regions. PET pyrolytic oil has GCV of about 44 MJ/kg which is more as compared to that of gasoline and diesel; therefore, this liquid product would perform relatively superior in engines. From the distillation report of the oil, it is observed that the boiling range of the oil is ≈100 °C – 364 °C infers the presence of mixture of different oil components such as gasoline, kerosene, and diesel in the oil. The liquid product contains substantial number of volatiles as its initial boiling point is around 100°C. Hence, these could be possible feed stocks for further upgrading or use of lighter compounds as a diesel product.
Characterization of the Liquid and Gas Products
GC-MS of the Oil Sample.
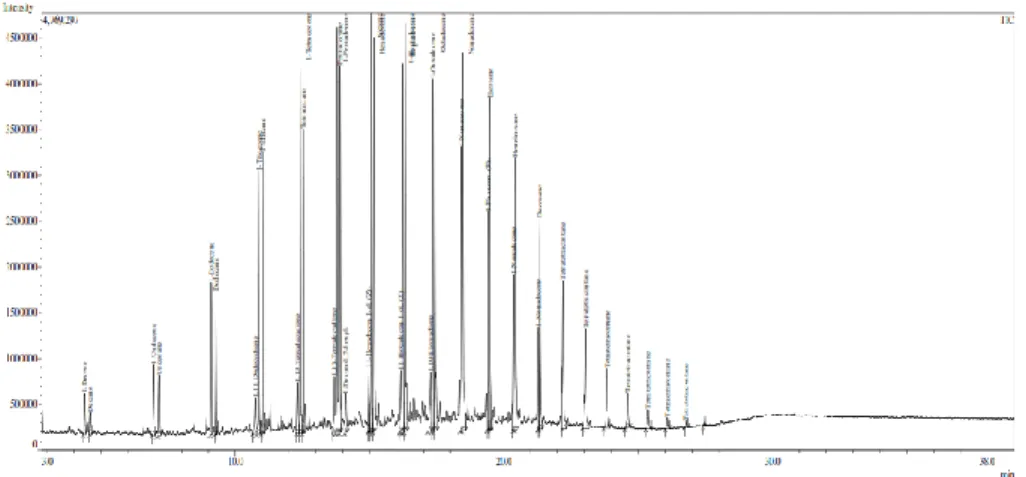
The GC-MS analysis of the oil sample obtained by the thermal pyrolysis of plastic bottles under the two conditions was carried out to know the compounds present in the final fuel oil (Figure 2a and b).
Figure 2a: GC-MS analysis of the PET-FAC oil sample
It has been observed that the pyrolytic oil contains around 34 compounds. Taking into account the concentrations (mg/Nm3), the highest concentrations of the total ion chromatogram (TIC) of the compounds were 1-Tetradecene, 1-Pentadecene, Cetene, Hexadecane, 1-Heptadecene, Heptadecane, Octadecane, Nonadecane, Eicosane, Tetratetracontane, 1-Undecene, 1-Decene. The components present in PET based fuels are mostly the aliphatic hydrocarbons (alkanes and alkenes) with carbon number C9– C20.
FT-IR of the Oil Sample Obtained at 580 °C.
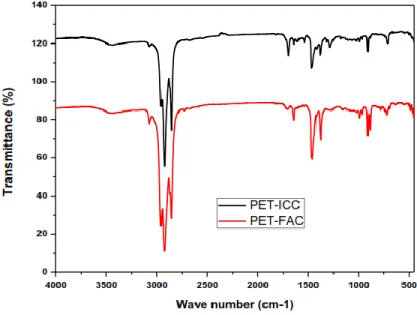
Fourier transform infrared spectroscopy (FTIR) is an important analysis technique which detects various characteristic functional groups present in oil. On interaction of an infrared light with oil, chemical bond will stretch, contract, and absorb infrared radiation in a specific wave length range regardless of the structure of the rest of the molecules. Figure 7 shows the FTIR spectra of PET based plastic oil.
Figure 3: FTIR of the liquid products.
The C–H stretching vibrations at frequency 3078.11 cm-1 indicate the presence of alkenes. The presence of alkanes is detected at 2918.68 cm-1 with C–H stretching vibrations. The C=C stretching vibrations at frequency 1647.39 cm-1 indicate the presence of alkenes. The presence of alkanes was detected C–H scissoring and bending vibrations at 1440.22 cm-1. The presence of alcohols, ethers, carboxylic acids, and esters is detected by C–O stretching vibrations at 907.61 cm−1, and the C–H bending vibrations at frequency 719.92 cm−1 indicates the presence of phenyl ring substitution bands. The results were found consistent when compared with the results of GC-MS.
Micro Gas Chromatography Analysis of the non-condensable Pyrolysis Gases.
Plastics have carbon and hydrogen in their polymer backbone; hence, thermal degradation at elevated temperatures leads to the production of significant amount of hydrocarbons gases. The gaseous products collected during the pyrolysis were identified
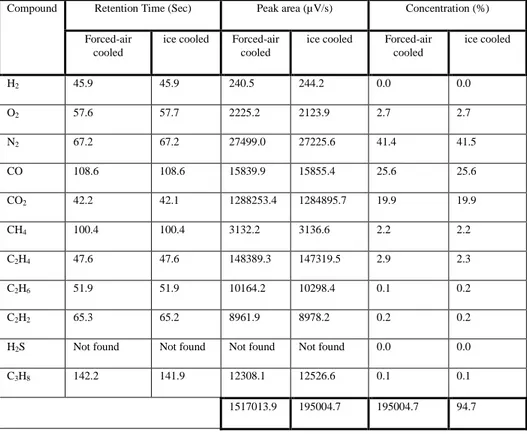
Table 2 Non-condensible gas composition from the forced-air cooled and ice cooled conversion techniques
Compound Retention Time (Sec) Peak area (µV/s) Concentration (%)
Forced-air cooled
ice cooled Forced-air cooled
ice cooled Forced-air cooled ice cooled H2 45.9 45.9 240.5 244.2 0.0 0.0 O2 57.6 57.7 2225.2 2123.9 2.7 2.7 N2 67.2 67.2 27499.0 27225.6 41.4 41.5 CO 108.6 108.6 15839.9 15855.4 25.6 25.6 CO2 42.2 42.1 1288253.4 1284895.7 19.9 19.9 CH4 100.4 100.4 3132.2 3136.6 2.2 2.2 C2H4 47.6 47.6 148389.3 147319.5 2.9 2.3 C2H6 51.9 51.9 10164.2 10298.4 0.1 0.2 C2H2 65.3 65.2 8961.9 8978.2 0.2 0.2
H2S Not found Not found Not found Not found 0.0 0.0
C3H8 142.2 141.9 12308.1 12526.6 0.1 0.1
1517013.9 195004.7 195004.7 94.7
and the average volume % are reported in Table 3 which shows that gaseous hydrocarbon fraction mainly consisted of alkanes and alkenes. The Cracking of the PET structure in this pyrolysis appears to favour the formation of lighter hydrocarbons, mainly methane and ethene, which are the hydrocarbons produced in significant quantities. The unsaturated hydrocarbons like ethene possibly were produced due to the random scission degradation mechanism of the plastics followed by stabilization of the intermediate radicals. A high amount of permanent gases like Nitrogen (41%), hydrogen (0.03%), Oxygen (2.7%), carbon monoxide (26%) and carbon dioxide (20%) were also present, possibly due to the PET polymeric structure, the presence of additives and impurity in the feed.
CONCLUSION
Thermal pyrolysis of waste PET bottles was performed in a stainless-steel batch reactor at temperature range from 400°C to 550°C (±20 °C) and at a heating rate of 20°C/min. The liquid yield is highest at 450°C, highly volatile products were obtained at low temperature, and the products obtained at 550 °C were viscous liquids. Reaction time decreases with increase in temperature. The functional group present in the PET based pyrolytic oil is similar to the other plastic pyrolytic oils given in several literatures. It was found that the pyrolytic oil contains around 34 types of compounds having carbon chain length in the range of C9-C20. The physical properties of pyrolytic oil obtained were in
the range of other pyrolytic oils and moderate-quality products. It has been shown that a simple batch pyrolysis method can convert waste PET bottle into useful liquid hydrocarbon products under low pressure without inert sweeping gases, but with a significant yield and high-octane number which varies with temperature and pyrolysis conditions. The obtained results are promising in improving other low-grade fuels and can be maximized by additional techniques such as hydrogenation and hydrodeoxygenation to obtain value-added products. This simple pyrolysis approach adopted in this paper is very efficiency on liquid fuel production in comparison with other literature approaches in which the PET pyrolysis leads to higher gaseous products.
ACKNOWLEDGEMENT
Authors acknowledge support from the University of Ghana BANGA-Africa Programme, the petroleum laboratory of the Ghana Standards Authority and Louise Roques of Centre RAPSODEE, CNRS, Mines Albi, France.
References
1. Plastics industry - Statistics & Facts. Available at:
https://www.statista.com/statistics/282732/global-production-of-plastics-since-1950/.(accessed 24 December 2019)
2. Mazzeo, N., (Ed.), Chemistry, Emission Control, Radioactive Pollution and Indoor Air Quality, ISBN:978-953-307-316-3, InTech,
3. Joshi, C., & Seay, J. (2016). An Appropriate Technology Based Solution to Convert Waste Plastic into Fuel Oil in Underdeveloped Regions. Journal of Sustainable
Development, 9(4), 133-143.
4. Hazeltine, B., & Bull, C. (1999). Appropriate Technology: Tools, Choices, and Implications. New York: Academic Press. pp. 3, 270.
5. Miezah, K., Obiri-Danso, Kwasi., Kádár, Z., Fei-Baffoe. B., Mensah. M., (2015). Municipal solid waste characterization and quantification as a measure towards effective waste management in Ghana. Waste Management 46, 15-27.
6. Geyer, R., Jambeck, J. R., & Law, K. L. (2017). Production, use, and fate of all plastics ever made. Science Advances, 3(7), e1700782.
7. Li, W. C., Tse, H. F., & Fok, L. (2016). Plastic waste in the marine environment: A review of sources, occurrence and effects. Science of the Total Environment, 566, 333-349.
8. . Green, D. S., Boots, B., Blockley, D. J., Rocha, C., & Thompson, R. (2015). Impacts of Discarded Plastic Bags on Marine Assemblages and Ecosystem Functioning. Environ.
Sci. and Technol., 49, 5380-5389.
9. Sarker, M., Rashid, M. M., Rahman, M. S., & Molla, M. (2012). Production of Valuable Heavy Hydrocarbon Fuel Oil by Thermal Degradation Process of Post-Consumer Municipal Polystyrene (PS) Waste Plastic in Steel Reactor. Energy and Power, 2[5], 89-95.
10. Pinto, F., Costa, P., Gulyurtlu, I., & Cabrita, I. (1999). Pyrolysis of Plastic Wastes: Effect of Plastic Waste Composition on Product Yield. Journal of Analytical and Applied
Pyrolysis, 51, 39-55.
11. Sharma, B. K., Moser, B. R., Vermillion, K. E., Doll, K. M., & Rajagopalan, N. (2014). Production, characterization and fuel properties of alternative diesel fuel from pyrolysis of waste plastic grocery bags. Fuel Processing Technology, 122, 79-90.
12. Singh, R. K., & Ruj, B. (2016). Time and temperature depended fuel gas generation from pyrolysis of real-world municipal plastic waste. Fuel, 174, 164-171.
13. Cepeliogullar, O., Putun, A.E. Utilization of two different types of plastic wastes from daily and industrial life. In: Ozdemir, C., Sahinkaya, S., Kalipci, E., Oden, M.K, editors. ICOEST Cappadocia 2013. Turkey: ICOEST Cappadocia; 2013. p. 1–13.
14. Fakhrhoseini, S.M, Dastanian, M. Predicting pyrolysis products of PE, PP, and PET using NRTL activity coefficient model. Hindawi Publishing Corporation; 2013. p. 1–5.