1
The economic and environmental feasibility of biogas buses in Liège
Martine MOSTERT1
Sabine Limbourg2
Abstract: Everyday, many students at the University of Liège have to drive to the Sart-Tilman village to attend their courses. These journeys are responsible for the emission of harmful particles which have negative impacts on climate and human health. This paper analyzes the economic and environmental feasibility of using biogas buses for public transport in Liège. The idea of implementing biogas buses is based on the proposed recycling of organic waste by the company INTRADEL, which manages and treats waste in the region. The economic and environmental advantages and drawbacks of biogas buses are developed and compared with those of the current diesel bus fleet. The main conclusion of this study is that, while internalizing external costs due to pollution, the use of biogas buses becomes an attractive option compared with classical diesel buses. Nevertheless, it requires investment and might lead to resistance to change. However, it remains a good solution for the reduction of CO2
emissions.
Keywords: Biogas, alternative fuel, passenger transport, carbon footprint
1. Introduction
The transport sector developed a lot during the last decades, bringing some benefits to the society but also leading to environmental damages. Pollution, global warming, congestion and noise are some examples of the external effects of transport. An external cost is defined as a cost that is supported by another agent than the one who engendered this cost. The European Commission (2008) tries to internalize those external costs by transferring them on the transportation price. The objective is to encourage the user to change his habits in order to use environmentally-friendly modes of transport.
Efforts for reducing the bad impacts of transport must be done at both people and freight transportation levels. In this paper, we focus on people transportation in the city of Liège in Belgium. Following a study performed by the University of Liège over its environmental impact, we try to determine whether a change in the bus technology that transports the students may have positive effects on the environment. Moreover, we check the economic consequences of such a change and therefore compare the classical diesel buses with the new biogas buses technology.
The first part of this paper describes the motivations as well as the general framework of our work. The second section is dedicated to the analysis of the advantages and drawbacks of the use of biogas buses. The next chapter deals with the potential for biogas production in the region of Liège. The analysis of the economic and environmental effects of biogas buses is then performed. Finally some conclusions are drawn in the last section of this work.
2. Motivations and research framework
This study has been carried out following a record at the University of Liège: after heating, the transportation of students is the second source of CO2 emissions of the University.
1 HEC-ULg, QuantOM 2
2 Different ways of dealing with the global warming problem exist. Two main types of measures can be applied.
The first one consists in the reduction of the demand for transport. In the case of the University, this solution might be undertaken by relocating the main lecture halls (which are currently situated in the Sart-Tilman village) to the city center. This would lead to a decrease in the utilization of the main transportation mode for students i.e. public buses. Taking act of this decision, the bus operator in Liège might retrieve some buses from this specific line (bus line number: 48), which could bring a reduction of the CO2 emissions. We have estimated that
this solution might avoid roughly 104,000 kg of CO2 per year. This estimation is based on the
assumption that all the buses used by the students to make the travel between the city-center and the Sart-Tilman village are removed from the road, which is not totally true in reality. This first solution could therefore help in reducing the environmental impact of the University of Liège. However the quantity of CO2 that would be avoided using this solution is quite
uncertain. Indeed it is rather difficult to estimate the effect of the relocation on students who do not currently use the bus for joining the Sart-Tilman village. Finally, this first solution also raises the issues of the possible increased congestion in the city center and the availability of the infrastructures to welcome the students.
A second solution that is therefore considered is the change in the buses technology. Several opportunities exist such as electrical buses, buses using bioethanol or biodiesel, hybrid vehicles, etc. Even if these solutions allow reducing the CO2 emissions of transportation, they
also present some disadvantages. Electrical vehicles do not reject any CO2 during their
utilization phase but it is not always the case during the production of the electricity or of the battery. A study of Ma et al. (2012) states that the performance of electrical personal vehicles in terms of greenhouse gas emissions compared to classical internal combustion vehicles vary according to different parameters. The paper also establishes that for the emissions related to the production of the vehicle, electrical vehicles are less efficient than internal combustion ones. Electrical vehicles can thus sometimes lead to only a shift of the emissions and not really a reduction of them. Biodiesel or bioethanol fuels present the drawback of being in competition with the agriculture for the production of food. It is a great disadvantage when one knows that still in 2010, 925 millions of persons were underfed in the world (FAO, 2010). For all these reasons, we decided to focus on the alternative which suggests the replacement of the current diesel buses by biogas buses. This type of buses presents some advantages that are described in the following section. Moreover, this choice is also supported by the possible valorization of organic and green waste by the company INTRADEL, which manages and treats waste in the region of Liège.
3. Advantages and drawbacks of biogas buses
Biogas is a type of biofuel produced from organic waste. Biogas is the result of the degradation of organic waste in anaerobic conditions, i.e. in absence of oxygen (Léonard, 2002). The proportion of the elements contained in biogas is variable but biogas is mainly constituted by methane, carbon dioxide, water and sulfur dioxide.
Biogas is the particular form of compressed natural gas (CNG) that is produced thanks to the recycling of organic waste. The advantages and drawbacks of CNG therefore also apply to biogas.
Diesel buses are less efficient in terms of pollutants than CNG buses. Rabl (2002) compares the lifecycle of two types of buses: a first one runs with diesel, a second one with CNG. After having valued the external effects linked to global warming, impact on human health and damages over cultures, the author determines that the external costs in euros per kilometer of a diesel bus represent between two and five times the ones of CNG buses.
3 CNG buses are also less noisy than their equivalent diesel buses. Tzeng et al. (2005) compare several types of buses according to different criteria. Each bus receives a grade which corresponds to the arithmetic mean of the evaluations performed by several professional experts. The value attributed to the biogas buses is higher than the one for diesel buses, which means, according to the type of function that is used, that biogas buses are less noisy than their equivalent diesel buses.
The costs generated to produce the same amount of energy are higher for diesel buses than for CNG buses. In the same filling station in Brussels (DATS, 2012), the diesel price on the 12th April 2012 was 1.403 euros per liter, whereas the CNG price was at 0.89 euros per kg. The net calorific value for gas is 37 MJ per normal m³ (Nm³). One normal cubic meter corresponds to one m³ of gas in normal temperature and pressure conditions (zero Celsius degree and one atmosphere). It is necessary to use 0.97 l of diesel (net calorific value: 38 MJ per liter) to reach the same amount of released energy as one Nm³ of CNG. Under normal conditions, one m³ contains 0.714 kg of CNG. For obtaining 37 MJ of energy, a consumer will have to spend 0.714*0.89 = 0.64 euro for CNG, against 0.97*1.403 = 1.36 euros for diesel. For the same amount of energy produced, the cost of using diesel is more or less twice as high as the cost of using CNG.
The existence of a well-developed distribution network for CNG in Belgium is also an advantage that must be taken into account when dealing with biogas issues. Since CNG and biogas only differ by their raw material (they are chemically identical), the distribution network represents an easy and cheap way of storing biogas.
Biogas is produced based on waste. It is thus a renewable energy that can represent an alternative in the search for solutions concerning the fossil fuel dependency. It also helps in managing better waste and does not enter in competition with agriculture.
Finally, the main advantage of biogas lies in the CO2 emissions issue. Biogas combustion is
CO2 neutral. As biogas comes from organic waste, the emissions resulting from the burning of
biogas have already been compensated by the absorption of CO2 by the organic waste. Biogas
burning therefore does not contribute to the additional warming effect. This property is specific to biogas and does not hold for CNG. In this case, CO2 contained in the ground is
released into the atmosphere, which increases the amount of greenhouse gases in this area. The main drawbacks of CNG/biogas are related to the perceived risk of gas. This fear is not really rational since the flash point of CNG (540°C) is twice as high as the one of diesel (235°C). Moreover, CNG remains as a gas, whatever the temperature, which avoids the risk of Boiling Liquid Expanding Vapor Explosion (BLEVE).
The second related problem that might be encountered is the possible social reluctances due to the perceived risk. However, those elements could also be counterbalanced by some positive effects, such as for instance, the proudness of bus drivers to run buses that are more environmentally-friendly.
4. Potential for biogas production in the region of Liège
When dealing with biogas buses, biogas production in the same region is a key issue to consider. Actually, even if biogas is CO2 neutral from the combustion point of view, the move
of waste by trucks to the biogas production and distribution center is clearly responsible for some emissions that must be taken into account. The travels between all those sites should be reduced as much as possible. This is the reason why we now try to evaluate the potential of biogas production in the region of Liège.
In 2010, around 11,800 tons of organic waste (fermentable fraction of household waste) and 54,100 tons of green waste were collected by the waste treatment corporation (INTRADEL, 2011).
4 Pöschl et al. (2012) have determined that a ton of green waste generates a quantity of biogas equivalent to an energy yield of 2,385 MJ, while a ton of organic waste generates an energy yield of 2,649 MJ. The biogas generated has the same chemical composition as natural gas and therefore has a heat capacity estimated at between 37 and 44 MJ per Nm³ (Bordeaux Gas, 2012). In this work, the average value of 40.5 MJ/Nm³ is considered. A ton of green waste therefore generates 59 Nm³ of biogas against 65 Nm³ for an equivalent quantity of organic waste. In Liège, the maximum producible annual quantity of biogas is therefore estimated at 3,951,800 Nm³ and is equivalent to 2,821,600 kg of biogas. One the basis of a fuel consumption of about 52 kg per 100 km and a traveled distance of 45,000 km per year, this production would allow the bus operator to run 150 buses annually.
The organic waste is already used to produce biogas. It is treated in a biomethanization station in other cities of Belgium. Biogas is then used to produce electricity and heat (cogeneration process). The utilization of biogas as fuel should therefore be done by using the current biogas production for the buses instead of using it for electricity and heat generation. It is interesting to notice that the use of biogas as fuel is more efficient than the use of biogas for producing electricity or heat. A report of EDC-Environnement (2007) for ADEME states that the best utilization of biogas regarding four indicators (greenhouse effect, acidification, eutrophication and energy) lies in the channel in which biogas is used as fuel for bus and dumpster.
5. Economic and environmental analysis of biogas buses
5.1. Economic comparison between a biogas and a diesel bus
The point of view adopted in this analysis is the one of the bus operator in Liège. We thus consider only the costs that are related to this company.
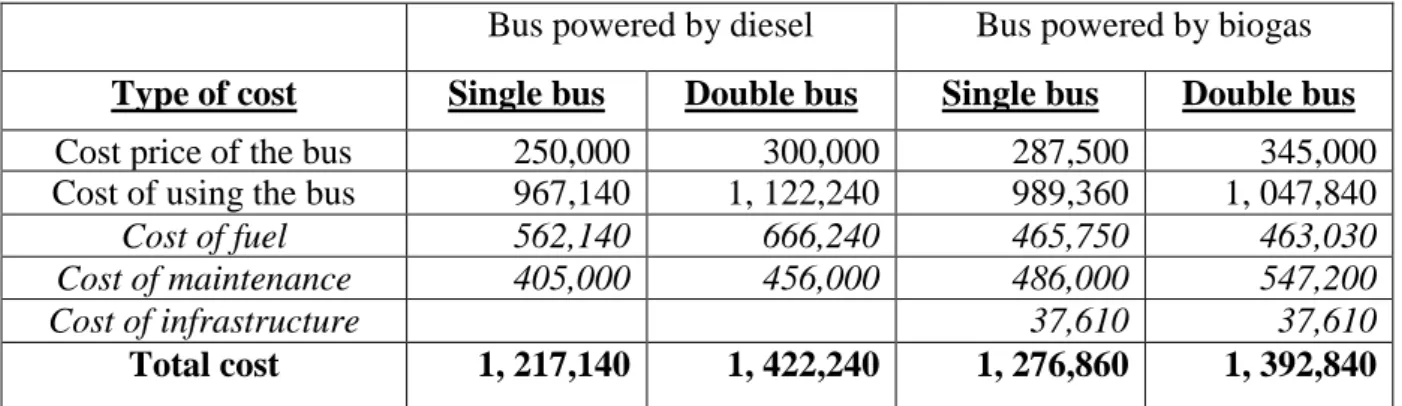
We obtained the information about the diesel buses from the bus operator in Liège, the TECs Liège-Verviers. The time period considered is the average life span of a bus. It is estimated at around twenty years and corresponds to a mileage of 45,000 km per year for a small standard bus and 40,000 km per year for a double bus (articulated bus). The different costs to be taken into consideration are listed in Table 1.
Bus powered by diesel Bus powered by biogas
Type of cost Single bus Double bus Single bus Double bus
Cost price of the bus 250,000 300,000 287,500 345,000 Cost of using the bus 967,140 1, 122,240 989,360 1, 047,840
Cost of fuel 562,140 666,240 465,750 463,030 Cost of maintenance 405,000 456,000 486,000 547,200
Cost of infrastructure 37,610 37,610
Total cost 1, 217,140 1, 422,240 1, 276,860 1, 392,840
Table 1: List of costs (in euros) related to the use of a bus: small-type and double
Transbus (2009) estimates that the purchase cost of a bus powered by natural gas is on average €38,000 more expensive than its diesel equivalent. This represents an increased cost of around 15% compared with diesel buses supplied by the TECs. This additional cost must be added to the budget of using a bus powered by natural gas.
The computed fuel costs are based on the average use of the buses of the current fleet of the TECs Liège-Verviers, and on the price of diesel which is estimated at €1.388 per liter. The price per liter of diesel is the one at the DATS station in Anderlecht on the 23rd of April 2012. The prices used for the cost per kilogram of Natural Gas for Vehicle (NGV) also come from
5 this same service station. Those prices are used to compare in a coherent way diesel and NGV, even if it is clear that the real amounts paid by the bus operators are discounted thanks to the quantity ordered. For a bus powered by biogas, the information relating to the cost of fuel is based on the average consumption data supplied by the company IVECO. According to the manufacturers, a small-type bus requires 45 kg of natural gas to complete a journey of 100 km. A double-type bus requires 59 kg of natural gas in order to complete the same journey. However, the consumption announced by the manufacturers is generally less important than the actual consumption. During our search for information for a small-type bus, the IVECO company quoted a consumption level of 39 liters per 100 km for diesel technology, while the TECs, based on real consumption, reported a figure of 45 liters per 100 km. There is a difference of 15% between these two figures. With a view to rationalization, we thus increase the theoretical consumption levels for small-type biogas buses by 15%. Since a difference of about 9% has been observed between expected and real consumption for the double-type bus, the real consumption levels are therefore estimated to be 1.09 times the stated levels. Under these conditions, the consumption of a small-type bus is calculated at 51.75 kg per 100 km, against 64.31 kg for a double-type bus.
As it is difficult to obtain the exact price per kilogram of biogas, we suppose that its cost is similar to that of natural gas for vehicle. In order not to underestimate the cost of biogas, we include a safety margin of 10% on the price per kilo and estimate the price of biogas to be €1 per kg.
The company IVECO states that the maintenance costs for gas buses are more or less 20% higher than the ones for classic diesel bus. However, these different costs can vary from one situation to another and depend on a lot of parameters. This is the reason why a sensitivity analysis of the results to the variation of the maintenance costs is developed in the following section (results and discussion).
The costs related to the installation of a filling station and the modification of the warehouse must be spread over the number of buses using gas propulsion. According to the data of the U.S. Department of Transportation (2007), the total costs of infrastructure can be estimated at €2,181,300. The TECs Liège-Verviers (2012) use 648 buses spread over 11 depots. A cost of €37,610 must thus be attributed to each biogas bus for the biogas distribution infrastructure. Note that the costs of infrastructure for diesel buses are not considered since the filling station is supposed to be already operational and that there is therefore no investment to make.
Compared to the costs of acquiring the bus (a difference of 15% in favor of diesel), the costs of using the bus are not very different from a diesel to a biogas type of bus (2.3% for a single bus in favor of diesel and 6.6% for a double bus in favor of biogas). These results are similar to the ones obtained by Yarime (2009) in the city of Tokyo: “The running cost of CNG vehicles, which is approximately 14–18 Japanese yen per kilometer, is not significantly different from that of diesel vehicles”.
There is no significant difference between the quantities and types of materials required for the manufacture of a bus powered by gas or diesel which would justify an important inequality between costs during the recycling of buses. Consequently, the costs during the recycling phase of the buses are supposed to be equivalent for both biogas and diesel buses. This is the reason why they are not considered in this analysis.
With regard to the small-type bus, the total cost of use for the entire life-cycle is lower for the diesel bus than for the bus powered by biogas. According to our data, there is a difference of 5% between the two technologies. The extra costs generated by using a biogas bus are the maintenance costs as well as the current depreciation costs for the installation of a gas filling station. The fuel costs are lower when biogas is used. This difference can be explained by the cost of fuel, 40% higher for diesel than for biogas.
6
5.2. Environmental comparison between a biogas and a diesel bus
The life-cycle analysis is made up of four phases: bus construction phase, pre-utilization phase, utilization phase and bus recycling phase.
The main element which could slightly make vary the impact of the first phase, the bus
construction phase, is the quantity of raw materials required for the fabrication of the buses.
Pelkmans et al. (2002) established that a bus powered by natural gas weighs two tons more than a diesel bus because of the extra mass of the gas cylinders. This difference causes negligible emissions compared to those generated when the bus is used for transporting people. The manufacturing operations for assembly and parts are considered to vary little from one bus to another. We therefore assume this first phase to be equivalent for both types of buses, and we do not false the results of the comparison if we do not take them into account.
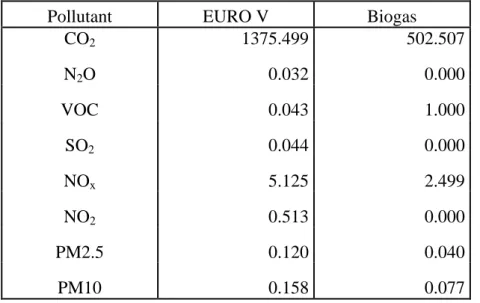
The analysis of the following phases, pre-utilization phase and utilization phase, is based on the data collected by Ryan and Caulfield (2010), for a bus fleet in the city of Dublin. Two groups of buses are compared: the diesel buses respecting the EURO V norm and buses powered by biogas. From their results, we can deduce the emissions generated per kilometer by a single bus (Table 2).
Pollutant EURO V Biogas
CO2 1375.499 502.507 N2O 0.032 0.000 VOC 0.043 1.000 SO2 0.044 0.000 NOx 5.125 2.499 NO2 0.513 0.000 PM2.5 0.120 0.040 PM10 0.158 0.077
Table 2: The emissions of pollutants generated by a bus in grams per kilometer
Based on data from the University of Liège, we know that around 1,600 students who attend their courses in the large lecture halls use the 48 bus line for the daily journeys between the town center and the Sart Tilman village (15 kilometers per trip). For the purpose of our study, we assume that the students make this journey twice a day, mainly between 7 a.m. and 9 a.m. in the morning and between 4 p.m. and 6 p.m. in the evening when the buses are 100% full. A small-type bus has a maximum capacity of 100 persons. The last hypothesis is that there are 180/365 scholar days in a year.
Under those assumptions and using the data of Ryan and Caulfield (2010), the annual emissions avoided by using biogas buses instead of classical diesel buses are equivalent to 75,400 kg of CO2. The quantities of nitrous oxide (N2O), sulphur dioxide (SO2) and nitrogen
dioxide (NO2) emitted when using biogas buses are nil while the other pollutants are
significantly reduced, with the exception of volatile organic compounds (VOCs).
Like Rabl (2002), we do not take the last phase of the process, the bus recycling phase, into account since we also think that the difference in emissions between the diesel bus and the natural gas bus recycling process is negligible.
7
5.3. External costs assessment
Internalization, the topic of this section, involves reflecting the external costs in the transport costs. For the evaluation of the costs of CO2, our analysis is based on a study performed by
INFRAS/IWW (2004). The costs incurred by the emissions of NOx, PM2.5, SO2 and VOC are
taken from the CAFE study carried out for the Directorate General for the Environment of the European Commission (2005). The external costs connected with PM10 particles come from the report of the European Commission (2008) and are based case analyses during the HEATCO study (Bickel et al. 2006). The costs connected with N2O emissions are based on
data published by Sutton et al. (2011). The results obtained are summarized in Table 3. Minimum external costs (€) Maximum external costs (€) Pollutant EURO V diesel Biogas EURO V diesel Biogas
CO2 24,759 9,045 173, 312.85 63,316 N2O 175 0 524.55 0 VOC 97 2,250 274.35 6,390 SO2 432 0 1,217.82 0 NOx 23,986 11,696 64,578.14 31,489 NO2 2,403 0 6,469.08 0 PM2.5 6,590 2,170 19,445.89 6,405 PM10 5,189 2,539 24, 153.88 11,817 TOTAL 63,631 27,700 289,977 119,417
Table 3: The external costs of emission of pollutants while using fuel over the life-cycle of a small-type bus
External costs are very difficult to determine precisely by economists. It is the reason why a range of values (minimum and maximum values) and not a specific value is provided in this analysis. The values attributed to the external costs depend on the hypotheses considered and on the methodology used. For instance, for evaluating the cost of CO2 emissions, two
different assumptions are considered in the INFRAS/IWW (2004) study, which leads to two different values for external costs. The first hypothesis evaluates the external costs as the money that must be spent for achieving the objectives of CO2 emissions reduction of 50%
between 1990 and 2030. This leads to the maximum external cost evaluation. The second hypothesis takes into account the money that must be spent for achieving the Kyoto Protocol objectives of CO2 emissions reduction (8% for the European Community until 2012). The
second hypothesis gives rise to the minimum external cost evaluation.
The total costs obtained during the use of minimum external costs are 4.5 times less important than those generated when maximum external costs are taken into consideration. The group powered by biogas generates around half of the external costs of its diesel technology equivalents. The emissions of CO2 and NOx are the main causes of the external costs
generated. Between the use of a diesel bus and the use of a biogas bus, the biggest proportionate reduction is that connected with the costs of the emissions of particles whose diameter is less than 2.5 micrometers. The only case where the external costs of the bus powered by biogas are higher than those of the diesel-powered bus concerns the emissions of VOC.
5.4. Results and discussion
For a life-span of 20 years, and when minimum external costs are considered, the total (economic and environmental) cost of using a small-type bus powered by biogas is €1,304,560 and that of a small-type diesel bus is €1,280,771 if the minimum external costs are
8 considered. The difference between these two buses is 2%. If the maximum external costs are taken into consideration, the total cost for the use of a small-type bus using biogas is €1,396,277 and that of a small-type diesel bus is €1,507,117, which is 8% higher than that of the biogas bus. This value changes the trend of the results. The value of the external costs taken into consideration plays a key role in the analysis of the profitability of the two solutions.
With regard to the double-type bus, by adding the environmental costs to the economic costs, the difference observed between the two solutions is higher than for the small-type buses, still in favor of biogas.
5.4.1. Performance of combustion technology
According to the data collected, a biogas bus causes an overconsumption of 22.8% in relation to a diesel bus. Studies carried out by ADEME (Coroller, 2009) assess the real overconsumption of NGVs in relation to diesel as between 20 and 45%. These results support the hypotheses that we adopted for the different consumption levels.
To do the same work, the use of biogas therefore necessitates more energy than when diesel is used. The difference between these two values must be interpreted as the difference in the efficiency of the two technologies. Indeed, the mechanical constraints (friction forces on the ground and in the air, weight of the bus to be moved) are the same for the two modes of propulsion. The only variations which could be noticed from one bus to another are the weight of the engine or extra weight linked to the weight of the gas bottles. The performance of the biogas technology is thus worse than the one of diesel. A hypothetical future improvement in the efficiency of the diesel engines could reduce the environmental impact of diesel in relation to biogas. However, as Ryan and Caulfield (2010) suggest, this improvement remains small while assessing for instance the reduction of greenhouse gas emissions between engines respecting Euro V and previous Euro standards.
5.4.2. Sensitivity analysis
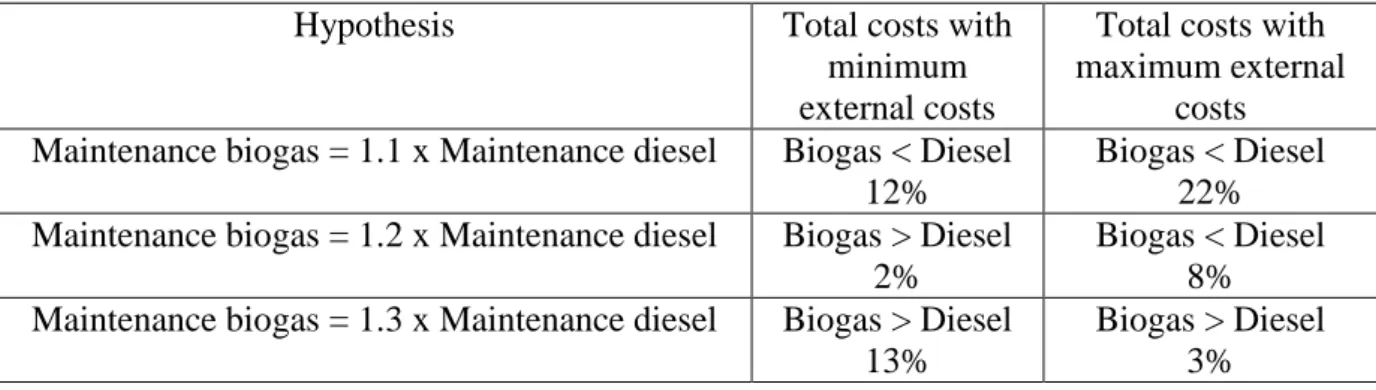
As the maintenance costs can vary from one situation to another, a sensitivity analysis of the results in relation to these costs is developed. Table 4 provides a summary of the conclusions obtained.
Hypothesis Total costs with
minimum external costs
Total costs with maximum external
costs Maintenance biogas = 1.1 x Maintenance diesel Biogas < Diesel
12%
Biogas < Diesel 22% Maintenance biogas = 1.2 x Maintenance diesel Biogas > Diesel
2%
Biogas < Diesel 8% Maintenance biogas = 1.3 x Maintenance diesel Biogas > Diesel
13%
Biogas > Diesel 3% Table 4: Sensitivity analysis of the maintenance costs of a biogas bus
In the cases that favor biogas, the difference between the two technologies reaches a maximum of 22%. In the cases that do not favor biogas, a maximum variation of 13% is noted between the two types of propulsion.
Some other elements need to be analyzed. If the price per unit of diesel increases more than proportionally with regard to that of biogas, the difference in cost between the two technologies becomes less important and facilitates investment in the transition towards biogas propulsion. A short overview of this issue is reviewed in the next section “Price evolution of biogas and diesel”.
9 The quality of the substrate is also a determining factor of the analysis. Indeed, the greater the quantity of substrate per unit produced and the higher the methane concentration in biogas, the lighter the post-fabrication treatments tasks, which helps to reduce the costs as well as the emissions generated.
The location of the different members of the logistical chain can also influence the quantity of CO2 emissions produced. If the waste is transported over long distances before arriving at the
biogas generation plant, the forms of transport used to shift the raw materials generate more emissions and therefore reduce the carbon neutrality of biogas. If the waste generated in the region of Liège is used for the fabrication of biogas, no extra transport needs to be taken into consideration in the analysis of the life-cycle of the bus. Indeed, whether they are transformed into biogas or not, the waste from the region of Liège must be anyway transported and treated at the INTRADEL treatment station.
By using the network already in place, the transportation of biogas between the place of fabrication and the place of use does not generate any extra CO2 emissions. However, the
pipelines holding natural gas must contain gas with similar chemical composition as that of biogas fuel.
5.4.3. Price evolution of biogas and diesel
Since we compute the costs of using diesel or biogas buses over a time horizon of 20 years, it is interesting to assess the evolution of the respective prices of biogas and diesel, because it may impact the conclusions drawn from the analysis. Indeed, if the price of one of the fuels increases or decreases proportionally more than the other, the total cost of the solution might be altered in a one way or another. In order to check for this issue, we try to identify the ratio between the costs of using biogas and diesel fuels for approximately the ten coming years. We respectively use the price evolution of oil and natural gas as a proxy for evaluating the trend of the diesel and biogas prices.
The price of one barrel of crude oil is estimated at $101.5 and the price of natural gas in Europe at $10.0/mmbtu (Million British Thermal Unit) for 2025 (World Bank, 2013). Based on a calorific value of 33 MJ/liter (Jatro, 2010 and Claverton Energy, 2011), one barrel of oil, which almost contains 159 liters, represents an amount of energy of 5247 MJ. One mmbtu represents 1,055 MJ. When comparing the price of oil and gas per GJ, one notices that oil price ($19.46) is estimated to be 2.04 times higher than gas price ($9.48) in 2025. This cost ratio for 2025 is a little bit less than the cost ratio obtained for 2012 by dividing the cost per unit of energy of diesel by the cost per unit of energy of CNG (see section 3: Advantages and drawbacks of biogas buses). For 2012, this ratio was equal to 1.36/0.64 = 2.12.
Between 2012 and 2025, it is thus supposed that the difference between diesel and biogas costs of fuel reduces a little bit in favor of diesel.
However this slight difference might be counterbalanced by other elements. The taxation policy of the country is one of those elements. Actually, as it already exists nowadays, it might be expected that, in the future, different taxation systems will be held according to the used technology. Those different taxation policies are expected to be in favor of biofuels (and therefore in favor of biogas compared to diesel), which would compensate the cost reduction of diesel compared to biogas.
European countries apply currently fiscal incentives in order to promote the use of biofuels. “Tax exemptions or tax reliefs are the most widespread fiscal incentives used to promote biofuels because they have an additional advantage compared to other alternative fiscal measures” since they “allow the member states to apply different biofuel strategies, favoring specific types of biofuels depending on the objectives underlying their own biofuel support policy” (Cansino et al., 2012). Mayeres and Proost (2013) address another element of taxation and highlight the current disequilibrium of fuel taxation systems between diesel and gasoline. They state that a regular diesel car is taxed €278 less than a gasoline car while it generates higher external costs than gasoline (between €14 and €23 more per year). This
awareness-10 raising might lead to some changes in the taxation system. An increase of the taxes applied to diesel might counterbalance the price evolution of biogas that is more important than the one of diesel.
Those elements are based on price forecasts. They must thus be considered cautiously but they give an overview of how the profitability of the diesel and biogas technologies may evolve in the future.
6. Conclusions
In order to reduce CO2 emissions while transporting students from the University of Liège,
the relocation of the big lecture halls would make for a reduction of around 104 tons of CO2
emissions per year. The uncertainty surrounding the impact of this relocation has led us to examine another proposal: the replacement of the current buses with biogas buses in the context of the use and potential recycling of the waste treated by INTRADEL. The reduction of CO2 achieved by developing this second solution is estimated at about 75 tons per year.
This amount is lower than the solution which proposed the relocation of the main lecture halls but it is more reliable. This is the reason why we prefer this solution to the first one.
The environmental results are clearly in favor of the biogas bus, particularly if we take CO2
emissions into consideration. The economic results are more nuanced in relation to the different theories put forward. When the diesel bus is seen to be financially cheaper than the biogas bus, the difference in cost between the two technologies is small.
In addition, the more ecological aspect of biogas can be an asset for the TECs in terms of brand image. However, it is evident that the use of this type of bus involves investments such as the refitting of the depots in order to install NGV filling stations. The use of biogas also presupposes the replacement of the current fleet of diesel buses by buses powered by natural gas. This change can be adjusted at the same rate as the buses are currently being replaced. In addition, the possible reluctance of drivers to use gas and their interest in driving vehicles which respect more the environment must be taken into consideration. An analysis on the investment to be made in order to construct a biomethanization plant and a feasibility study in order to determine whether the conditions necessary for the fabrication of biogas are available in Liège should still be carried out.
The availability of waste in order to produce biogas in the region of Liège would make it possible to generate the quantity of biogas necessary for the supply of 150 buses annually. However, if all the buses were to be powered by biogas, it would become interesting to study other possible origins for the supplying of waste (the amount available in Liège is not sufficient to cover the whole demand).
Finally, the organic waste is currently used for the production of biogas destined to cogeneration while the green waste is burned in an incinerator. The question of the reallocation of this waste to the production of biogas for use as fuel is also raised.
11
Bibliography
Bickel P., Friedrich R., Hunt A., De Jong G., Laird J., Lieb Chr., Lindberg G., Mackie P., Navrud S., Odgaard Th., Shires J. and Tavasszy L., Developing Harmonised European
Approaches for Transport Costing and Project Assessment (HEATCO). Deliverable D6: Case Study Results, IER : University of Stuttgart, Stuttgart, 2006
Bordeaux Gas, Les caractéristiques du gaz naturel véhicules, online
http://www.gazdebordeaux.fr/professionnels/caracteristiques-gaz-naturel-vehicule.php, 2012 Cansino J.M., Pablo-Romero M., Román R. and Yñiguez R., Promotion of biofuel
consumption in the transport sector: An EU-27 perspective, Renewable and Sustainable
Energy Reviews, 16, pp. 6013-6021, 2012
Claverton Energy, The Energy and Fuel Data Sheet, online http://www.claverton-energy.com/wp-content/uploads/2012/08/the_energy_and_fuel_data_sheet.pdf, 2011
Clean Air For Europe (CAFE) – Cost Benefit analysis, Damages per tonne emission of
PM2.5, NH3, SO2, NOx and VOCs from each EU25 Member State (excluding Cyprus) and surrounding seas. Commissioned by: European Commission DG Environment, online
http://www.cafe-cba.org/assets/marginal_damage_03-05.pdf, 2005
Coroller P., 24èmes journées AGIR Toulouse, les 18 et 19 Juin 2009, online http://www.agir-transport.org/ImgPDF/72-7coroller.pdf, 2009
DATS 24, Station Anderlecht, online http://www.dats24.be/dats/static/station_anderlecht_f. shtml, 2012
EDC-Environnement, Analyse du Cycle de Vie des modes de valorisation énergétique du
biogaz issu de méthanisation de la Fraction Fermentescible des ordures ménagères collectée sélectivement en France, online http://www2.ademe.fr/servlet/getDoc?sort=-1&cid=96&m=3&id=48358&ref=14226&nocache=yes&p1=111, 2007
European Commission, Handbook on estimation of external costs in the transport sector, online http://ec.europa.eu/transport/sustainable/doc/2008_costs_handbook.pdf, 2008
Food and Agriculture Organization of the United Nations, Global hunger declining, but still
unacceptably high., online http://www.fao.org/docrep/012/al390e/al390e00.pdf, 2010
INFRAS/IWW, External Costs of Transport: Update study, University of Karlsruhe, Zürich/Karlsruhe, 2004
INTRADEL, Présentation des résultats statistiques 2010 et du Plan Stratégique 2011 – 2013, online http://www.intradel.be/media/cms/Conferencedepresse25.02.2011%20(2).pdf, 2011 Jatro, Calorific values, online http://www.jatrofuels.com/170-0-Calorific+Values.html, 2013 Léonard A., Biométhanisation. Département de Chimie Appliquée de l’Université de Liège, Liège, 2002
Ma H., Balthasar F., Tait N., Riera-Palou X. and Harrison A., A new comparison between the
life cycle greenhouse gas emissions of battery electric vehicles and internal combustion vehicles. Energy Policy, 44, pp. 160-173, 2012
Mayeres I. and Proost S., The taxation of diesel cars in Belgium – revisited, Energy Policy, 54, pp. 33-41, 2013
Pelkmans L., Lenaers G. and De Keukeleere D., Evaluation of Emissions and Fuel
Consumption of Heavy Duty Natural Gas Vehicles in Real City Traffic, Vito Flemish Institute
for Technological Research, Belgium, 2002
Pöschl M., Ward S. and Owende P., Environmental impacts of biogas deployment - Part II:
life cycle assessment of multiple production and utilization pathways. Journal of Cleaner
Production, 24, pp. 184-201, 2012
Rabl H., Environmental benefits of natural gas for buses, Transportation Research Part D, 7, pp. 391-405, 2002
12 Ryan F. and Caulfield B., Examining the benefits of using bio-CNG in urban bus operations,
Transportation Research Part D, 15, pp. 362–365, 2010
Sutton M., Howard C. and Erisman J., The European Nitrogen Assessment: Sources,
effects and policy perspectives, Cambridge University Press, 2010
TEC Transport En Commun en Wallonie. (2012). TEC Liège-Verviers, online
http://www.infotec.be/index.aspx?PageId=633021251308109456, 2012
Transbus, Le GNV, Gaz Naturel pour Véhicules, online http://www.transbus.org/dossiers/gnv. html, 2009
Tzeng G.H., Lin C.W. and Opricovic S., Multi-criteria analysis of alternative-fuel buses for
public transportation, Energy Policy, 33, pp. 1373-1383, 2005
U.S. Department of transportation, Transit Bus Life Cycle Cost And Year 2007 Emissions
Estimation, online http://www.fta.dot.gov/documents/WVU_FTA_LCC_Final_Report_07-23-2007.pdf, 2007
Yarime M., Public coordination for escaping from technological lock-in: its possibilities and
limits in replacing diesel vehicles with compressed natural gas vehicles in Tokyo. Journal of
Clearer Production, 17, pp. 1281-1288, 2009
World Bank, Commodity Price Forecast Update, online http://siteresources.worldbank.org/ INTPROSPECTS/Resources/334934-1304428586133/Price_Forecast.pdf, 2013