www.biogeosciences.net/10/6911/2013/ doi:10.5194/bg-10-6911-2013
© Author(s) 2013. CC Attribution 3.0 License.
Biogeosciences
Dynamics of dissolved inorganic carbon and aquatic metabolism in
the Tana River basin, Kenya
F. Tamooh1,2, A. V. Borges3, F. J. R. Meysman4,5, K. Van Den Meersche4,*, F. Dehairs4, R. Merckx1, and S. Bouillon1 1Katholieke Universiteit Leuven, Department of Earth and Environmental Sciences, Celestijnenlaan 200E, 3001 Leuven,
Belgium
22Kenya Wildlife Service, P.O. Box 82144-80100, Mombasa, Kenya
3Université de Liège, Unité d’Océanographie Chimique, Allée du 6 Août, 17, 4000, Belgium
4Vrije Universiteit Brussel, Department of Analytical and Environmental Chemistry, Pleinlaan 2, 1050 Brussel, Belgium 5Royal Netherlands Institute of Sea Research, Korringaweg 7, 4401 NT Yerseke, the Netherlands
*current address: French Agricultural Research Centre for International Development, UMR Eco & Sols, SUP AGRO Bât. 12,
2 Place Viala, 34060 Montpellier Cedex 2, France
Correspondence to: F. Tamooh (fredrick.tamooh@ees.kuleuven.be)
Received: 28 February 2013 – Published in Biogeosciences Discuss.: 14 March 2013 Revised: 21 September 2013 – Accepted: 27 September 2013 – Published: 4 November 2013
Abstract. A basin-wide study was conducted in the
Tana River basin (Kenya) in February 2008 (dry sea-son), September–November 2009 (wet season) and June– July 2010 (end of the wet season) to assess the dynam-ics and sources of dissolved inorganic carbon (DIC) as well as to quantify CO2 fluxes, community respiration
(R), and primary production (P ). Samples were collected along the altitudinal gradient (from 3600 to 8 m) in sev-eral headwater streams, reservoirs (Kamburu and Masinga), and the Tana River mainstream. DIC concentrations ranged from 0.2 to 4.8 mmol L−1, with exceptionally high values (3.5 ± 1.6 mmol L−1) in Nyambene Hills tributaries. The wide range of δ13CDIC values (−15.0 to −2.4 ‰) indicate
variable sources of DIC, with headwater streams recording more positive signatures compared to the Tana River main-stream. With with only a few exceptions, the entire riverine network was supersaturated in CO2, implying the system is
a net source of CO2to the atmosphere. pCO2values were
generally higher in the lower Tana River mainstream com-pared to headwater tributaries, opposite to the pattern typi-cally observed in other river networks. This was attributed to high suspended sediment in the Tana River mainstream fuelling in-stream community respiration and net heterotro-phy. This was particularly evident during the 2009 wet sea-son campaign (median pCO2of 1432 ppm) compared to the
2010 end of the wet season (1002 ppm) and 2008 dry season
(579 ppm). First-order estimates show that in-stream com-munity respiration was responsible for the bulk of total CO2
evasion (77 to 114 %) in the Tana River mainstream, while in the tributaries, this could only account for 5 to 68 % of total CO2 evasion. This suggests that CO2 evasion in the
tribu-taries was to a substantial degree sustained by benthic miner-alisation and/or lateral inputs of CO2-oversaturated
ground-water. While sediment loads increased downstream and thus light availability decreased in the water column, both chloro-phyll a (0.2 to 9.6 µg L−1) and primary production (0.004 to 7.38 µmol C L−1h−1) increased consistently downstream. Diurnal fluctuations of biogeochemical processes were ex-amined at three different sites along the river continuum (headwater, reservoir and mainstream), and were found to be substantial only in the headwater stream, moderate in the reservoir and not detectable in the Tana River mainstream. The pronounced diurnal fluctuations observed in the headwa-ter stream were largely regulated by periphyton as deduced from the low chlorophyll a in the water column.
1 Introduction
Rivers are becoming increasingly more recognised as im-portant not only in the transport of carbon (C) between the terrestrial and marine environments but also in terms of C
storage and processing. River systems are typically a source of CO2to the atmosphere, partly due to receiving CO2-rich
groundwater and partly due to heterotrophic processes within the system. Thus, dissolved inorganic carbon (DIC, com-prising HCO−3, CO2−3 and CO2) is an important component
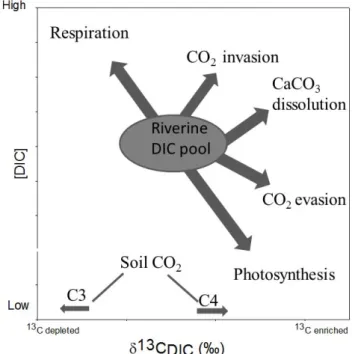
in river biogeochemistry. The dynamics of riverine DIC are primarily controlled by watershed inputs and in-stream pro-cesses, which lead to either addition or removal of carbon from the DIC pool and which also change the δ13CDIC
val-ues of riverine water (Fig. 1). The input of terrestrial organic matter (and the relative contribution of C3 over C4 plants to this), the weathering of carbonate/silicate minerals within the bedrock and the ratio of groundwater discharge to sur-face runoff are the main watershed processes controlling the dynamics of riverine DIC and its δ13C signature. Additional in-stream processes impacting DIC dynamics include CO2
exchange with the atmosphere, in-stream dissolution or pre-cipitation of carbonate/silicate minerals, primary production (P ) and community respiration (R) (McConnaughey et al., 1994; Amiotte-Suchet et al., 1999; Abril et al., 2003; Fin-lay and Kendall, 2007). The strength of each of these pro-cesses depends on the size of the river and its productivity (Finlay, 2003) as well as the geology and hydrology of the basin (Bullen and Kendall, 1998), and varies seasonally as a function of temperature and discharge. The complexity of all these processes and their interplay makes it difficult to con-strain the sources of riverine DIC.
Riverine carbon undergoes a high degree of transformation and some degree of retention as it cycles from the terrestrial biosphere to the ocean (Cole et al., 2007; Aufdenkampe et al., 2011). In most cases, this results in supersaturation of CO2in fluvial systems and significant CO2evasion to the
at-mosphere (Kempe 1984; Telmer and Veizer, 1999; Cole and Caraco, 2001; Richey et al. 2002; Cole et al., 2007; Auf-denkampe et al., 2011). Quantitative assessment of riverine CO2 degassing in tropical rivers is critical in the context of
carbon cycling, particularly considering that tropical systems account for ∼ 70 % of global riverine carbon fluxes, partly owing to their large areal extent, varying climatic condi-tions and diverse land-use covers (Milliman and Farnsworth, 2011).
In recent papers (Aufdenkampe et al., 2011; Butman and Raymond, 2011), the global freshwater systems CO2evasion
to the atmosphere has been estimated to be of the order of
∼3.3 Pg C yr−1, three-fold greater than total carbon trans-port (∼ 0.9 Pg C yr−1) to the global ocean. Such high CO
2
evasion necessitates improved understanding of DIC dynam-ics in both local and regional systems as well as underlying drivers of carbon cycling. The above CO2evasion estimate is
prone to large uncertainty, and a range of estimates has been proposed, with Cole et al. (2007) giving a much more con-servative number of 0.75 Pg C yr−1. This is partly due to the lack of sufficient data to provide a representative and correct scaled flux, particularly in tropical systems (Regnier et al., 2013).
Fig. 1. Conceptual model showing the main watershed and in-stream biogeochemical processes controlling riverine DIC concen-tration and δ13CDICsignatures.
In recent years, the application of isotopic proxies has be-come invaluable in understanding riverine carbon cycling. Based on the premise that various carbon sources have dis-tinct δ13C values, δ13CDIC signatures have been used in a
wide range of fluvial systems to constrain the biological and geological sources of DIC (Amiotte-Suchet et al., 1999; Fin-lay, 2003; Doctor et al., 2008; Brunet et al., 2005, 2009). For instance, riverine DIC predominantly derived from oxidation of organic matter will have δ13C values of about −28 and
−13 ‰ for by C3 and C4 plants respectively, or −8 ‰ if derived from atmospheric air exchange. On the other hand, CaCO3dissolution will shift δ13C signatures to heavier
val-ues (δ13C value of carbonate is close to 0 ‰ if from marine origin) (Finlay, 2003; Brunet et al., 2005, 2009).
In order to quantify the predominant riverine metabolic activity, application of both the δ18ODO technique
(DO = dissolved oxygen) and light and dark bottle in-cubation experiments have effectively been employed in past studies (Sinada and Karim, 1984; Cole and Caraco, 2006; Gazeau et al., 2007). The global average δ18O of atmospheric oxygen is +23.5 ‰, but fractionation during gas exchange across the air–water interface results in DO that is ∼ 0.7 ‰ heavier than atmospheric oxygen, and thus DO in isotopic equilibrium with air will have δ18O of +24.2 ‰ (Nimick et al., 2011). Aquatic photosynthesis lowers the isotopic composition of source water since it produces DO that is similar in isotopic composition to source water, while aquatic respiration causes a kinetic isotopic fractionation of molecular oxygen, and hence enriching water with heavier
isotope (Parker et al., 2005). δ18ODO can be used to
quan-tify the rates of photosynthesis and respiration in aquatic systems. In addition, monitoring of diurnal fluctuations in riverine biogeochemical proxies can equally provide quantitative information on river metabolism (Odum, 1956; Staehr et al., 2010).
According to the river continuum concept (RCC; Vannote et al., 1980), rivers show a predictable downstream varia-tion in the linkage with the terrestrial environment. Thus, forested headwater streams (1st–3rd order) would be pre-dominantly heterotrophic since metabolism is fuelled by al-lochthonous subsidies, whereas mid-order (4th–6th) streams would be predominantly autotrophic without significant ri-parian canopy cover. Large rivers (> 7th order) revert to het-erotrophy since P would be limited by increased turbid-ity and depth; thus R exceeds P . Riverine P and R rates are rarely quantitatively assessed at basin-wide scale despite their significance in understanding the functioning of river-ine systems, yet it can be safely stated that most large rivers do not conform with the original tenets of the RCC due to altered lateral exchange with floodplains and flow disconti-nuities (Maiolini and Bruno, 2007). Since the RCC, a variety of alternative concepts to describe matter and energy flow have been developed, as reviewed by Bouwman et al. (2013). The metabolic balance between riverine P and R defines whether an ecosystem is net heterotrophic (P : R < 1) or net autotrophic (P : R > 1) (Odum 1956; Venkiteswaran et al., 2007). Most heterotrophic freshwater aquatic systems are sustained by subsidies of organic materials input from terrestrial biome (Cole and Caraco, 2001), which decom-pose within the riverine system, and as such influence car-bon concentrations and their isotopic composition. The pre-dominant metabolic activity thus depends on the magnitude of allochthonous inputs and the subsequent fraction respired versus autochthonous production (Cole and Caraco, 2001).
With this background, the present study examines the riverine DIC dynamics and δ13CDICvalues in the Tana River
basin (Kenya), based on three basin-wide sampling cam-paigns covering the dry season, wet season and end of the wet season in order to constrain main sources of DIC. To quantify the strength of the riverine CO2 sources, we estimated both
pCO2and CO2fluxes in an attempt to identify the primary
CO2 evasion hotspots within the Tana River basin. In
addi-tion, the study also examines the longitudinal changes in the magnitude of riverine P and R rates. We further examined to what extent pelagic respiration sustained the CO2evasion.
Finally, we monitored biogeochemical parameters during di-urnal cycles at three different sites along the river contin-uum representing headwater streams, reservoirs and the Tana River mainstream.
2 Materials and methods
2.1 Study area
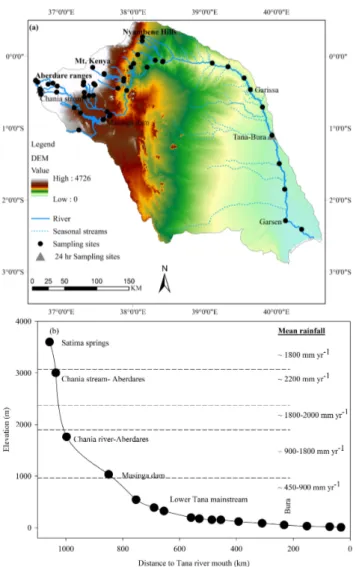
The Tana River is the longest river in Kenya (∼ 1100 km), with a total catchment area of ∼ 96 000 km2(Fig. 2a). The river system can be separated into two main parts, here re-ferred to as “Tana headwaters” and the “lower Tana main-stream”. The Tana headwaters consists of numerous tribu-taries, which originate from the Aberdare Range in the cen-tral highlands of Kenya, the highlands around Mt Kenya, and the Nyambene Hills in eastern Kenya (Fig. 2a). The lower Tana mainstream encompasses the section downstream of the Nyambene Hills, where the river flows southeast for about 700 km through semiarid plains. Along this stretch, tribu-taries only discharge in short pulses during the wet season. As a result, the lower Tana mainstream forms a single trans-port channel during the dry season, delivering material to the Indian Ocean (Maingi and Marsh, 2002). The lower Tana River has extensive floodplains between the towns of Garissa and Garsen, but floodplain inundation has been irregular in recent decades due to the river flow regulation by five hydro-electric dams upstream (Maingi and Marsh, 2002). The asso-ciated reservoirs have a combined surface area of ∼ 150 km2, and a significant amount of sediment is trapped by these dams (Dunne and Ongweny, 1976; Brown and Schneider, 1998). Masinga is the largest reservoir (commissioned in 1981), and has a surface area of ∼ 120 km2 and a stor-age capacity of ∼ 1560 × 106m3, while the Kamburu Reser-voir (the third largest, commissioned in 1974) has a surface area of ∼ 15 km2 and a storage capacity of ∼ 123 × 106m3 (GOK, TARDA, 1982). The Tana River basin includes dif-ferent ecological zones experiencing difdif-ferent rainfall pat-terns, decreasing from the headwaters (altitude > 3050 m, annual precipitation ∼ 1800 mm yr−1), upper highlands (al-titude 2450–3050 m, annual precipitation ∼ 2200 mm yr−1) and mid-altitude catchments (altitude 1850–900 m, annual precipitation between 900 and 1800 mm yr−1) to the lower semiarid Tana catchment (altitude 900–10 m, annual precip-itation between 450 and 900 mm yr−1) (Brown and Schnei-der, 1998, Fig. 2b). The basin experiences a bimodal hydro-logical cycle, with long rains between March and May, and short rains between October and December, which also leads to a clear bimodal pattern in the river discharge (Fig. 3). The mean annual river discharge at the Garissa gauging station is 156 m3s−1 over the period 1934 to 1975 (daily
data from the Global River Discharge Database, available at http://daac.ornl.gov/RIVDIS/rivdis.shtml). The high-altitude headwaters (Aberdare Range, Mt Kenya) are characterised by mountainous forest vegetation and moorlands at the high-est elevations, giving way to more intense agricultural activi-ties in mid-altitude regions. The semiarid lower Tana is dom-inated by open to wooded savannah grassland, with some riverine gallery forests along the Tana River.
Fig. 2. (a) Digital elevation model (DEM) of the Tana River basin, which consists of two main geographical units – the Tana head-waters and the lower Tana mainstream. The 57 sampling sites are indicated by black dots. (b) Profile of the Tana River from headwa-ters to Tana mouth. Sampling stations for the lower Tana River are indicated, as well as a selected number of headwater sampling sites to show their overall position. Note: Chania Stream, Masinga Dam (close to intake) and Tana-Bura are 24 h cycle sampling sites.
2.2 Sampling and analytical techniques
Sampling was carried out during the three campaigns of February 2008 (dry season), September–November 2009 (wet season) and June–July 2010 (end of the wet season) (Fig. 3). The average river discharge measured at Garissa station during the wet season (209 m3s−1) was 1.7 times higher than during the dry season (123 m3s−1) and 1.4 times higher that of the end of the wet season (145 m3s−1) (Fig. 3). Samples were taken throughout the river basin (Fig. 2a, Sup-plement Table 1); sampling sites included a subset of small streams in the headwater regions, an approximately equidis-tant set of locations along the lower Tana River mainstream,
Fig. 3. Discharge measurements for the Tana River (2008–2010) as recorded at Garissa station. (Data source: Water Resource Manage-ment Authority.) Horizontal lines indicate the duration of the three field investigations, while vertical dashed lines separate different years. Dry season data have already been presented in Bouillon et al. (2009).
and depth profiles at two of the five hydroelectric reservoirs (Masinga and Kamburu). The dry season campaign in Febru-ary 2008 only covered a subset of these field sites; these data have already been presented in Bouillon et al. (2009), and are used here for comparison purposes. In both the 2009 and 2010 campaigns, an extensive basin-wide survey was carried out. In addition, three sampling sites (Chania Stream in the Aberdare Range, Masinga Reservoir and the Tana River at Bura) were selected for a 24 h cycle sampling (Fig. 2a).
During the dry season and the wet season campaigns, wa-ter temperature and DO were measured in situ with a polaro-graphic electrode (WTW Oxi-340) calibrated on saturated air, with an accuracy of 0.1 %, while pH was measured us-ing a combined potentiometric electrode (Metrohm Thermo Orion model 230). A YSI ProPlus multimeter was used dur-ing the end of the wet season campaign. The pH probe was calibrated using United States National Bureau of Standards buffer solutions (4 and 7). Water samples for the analysis of δ13CDICand δ18ODO were taken with a Niskin bottle at
∼0.5 m below the water surface by gently overfilling 12 mL glass headspace vials, and poisoned with 20 µL of a satu-rated HgCl2 solution. For the analysis of δ13CDIC, a 2 mL
helium (He) headspace was created, and H3PO4was added
to convert all DIC species to CO2. After overnight
equilibra-tion, part of the headspace was injected in the stream of an elemental analyser – isotope ratio mass spectrometer (EA-IRMS: Thermo Finnigan Flash HT and Thermo Finnigan Delta V Advantage) for δ13C measurements. The obtained
δ13C data were corrected for the isotopic equilibration be-tween gaseous and dissolved CO2 as described in Gillikin
certified reference materials LSVEC and either NBS-19 or IAEA-CO-1. For δ18ODO, a similar headspace was created,
after which samples were left to equilibrate for 2 h. δ18ODO
was then measured using the same EA-IRMS setup by mon-itoring m/z 32, 33 and 34 and using a molecular sieve (5 Å) column to separate N2from O2. Outside air was used as the
internal standard to correct all δ18O data.
Water samples for total alkalinity (TA) were obtained by prefiltering surface water through pre-combusted GF/F fil-ters (0.7 µm), with further filtration through 0.2 µm syringe filters in high-density polyethylene bottles. TA was anal-ysed by automated electro-titration on 50 mL samples with 0.1 mol L−1HCl as the titrant (reproducibility estimated as better than ±3 µmol kg−1based on replicate analyses). The partial pressure of CO2(pCO2) and DIC concentrations were
computed from pH and TA measurements using the carbonic acid dissociation constants for freshwater from Millero et al. (1979). The accuracy of computed DIC and pCO2
val-ues was estimated at ±5 µmol L−1and ±5 ppm, respectively. Water samples for major elements and nutrient (NO−3) were obtained in 20 mL scintillation vials in the same way as TA samples, but were preserved with 20 µL of ultra-pure HNO3
and 20 µL of a saturated HgCl2solution for major elements
and nutrients, respectively. The concentrations of major el-ements (Ca, Mg, Na, Si) were measured using inductively coupled plasma-atomic emission spectroscopy (Iris Advan-tage, Thermo Jarrel-Ash), while nutrients were measured us-ing standard chromatographic techniques (ICS-900, Dionex). Water–air CO2 fluxes were measured using a
custom-made floating chamber with a surface area and volume of ap-proximately 0.045 m2 and 5.2 L, respectively, coupled with an infrared CO2analyser (Licor-820) and data logger. The
floating chamber was placed on the surface of the water and kept stationary for ∼ 10 min. The slope of the linear regres-sion between pCO2and time was obtained and used to
cal-culate the CO2flux per unit area and per unit time based on
the equation
FCO2=(dpCO2/dt (V /RT S), (1)
where dpCO2/dt is the slope of the CO2 accumulation in
the chamber (atm s−1), V is the chamber volume (L), T is air temperature (K), S is the surface area of the cham-ber at the water surface (m2) and R is the gas constant (L atm K−1mol−1).
Samples for phytoplankton pigment analysis were ob-tained by filtering a known volume of surface water on pre-combusted 47 mm GF/F filters, which were immediately packed into cryotubes and stored in liquid N2. Upon
re-turn to the laboratory, the samples were stored at −20◦C until further analysis. Pigments were extracted in 10 mL of an acetone : water mixture (90 : 10), and a subsample was separated by high-performance liquid chromatography on a C18 reverse-phase column. Calibration was performed with working standards prepared from commercially available pure compounds.
The R rates were determined by quantifying the decrease in DO (using the polarographic electrode WTW Oxi-340) of river water incubated in a dark, cool box filled with water to retain ambient temperature for approximately 24 h using 250 mL bottles (2–3 replicates) with airtight polyconic caps. The P rates were quantified by determining the uptake of DIC after short-term (1–3 h) in situ incubations of river wa-ter during the day using 1 L polycarbonate bottle spiked with
13C-labelled sodium bicarbonate (NaH13CO
3). A subsample
for δ13CDICof the spiked water was sampled for the purpose
of computations. Samples for analysis of particulate organic carbon (POC) and δ13CPOC were obtained at the start
(nat-ural abundance values) and at the end of the incubation by filtering a known volume of surface water on pre-combusted (overnight at 450◦C) 25 mm GF/F filters (0.7 µm). Filters were decarbonated with HCl fumes for 4 h, re-dried and then packed into Ag cups. POC and δ13CPOCwere determined on
a Thermo elemental analyser – isotope ratio mass spectrom-eter (EA-IRMS) system (Flash HT with Delta V Advantage), using the TCD signal of the EA to quantify POC and by monitoring m/z 44, 45 and 46 on the IRMS. Quantification and calibration of δ13C data were performed with IAEA-C6 and acetanilide that was calibrated against international stan-dards. Reproducibility of δ13CPOCmeasurements was
typi-cally better than 0.2 ‰. The P data here refer only to surface water (∼ 0.5 m deep) measurements (not depth integrated). Calculations to quantify the rates were made as described in Dauchez et al. (1995).
3 Results
3.1 In situ measurements, dissolved inorganic carbon and δ13CDIC
Generally, temperature, pH and specific conductivity in-creased consistently downstream (Pearson correlation: r2=
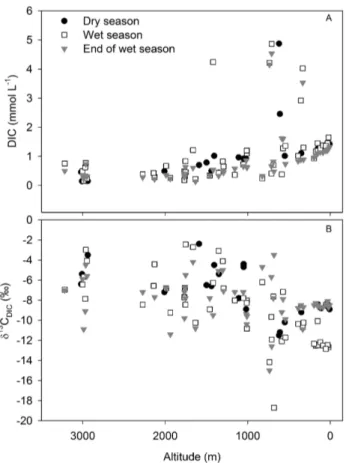
0.90, 0.41 and 0.47 for temperature, pH and specific con-ductivity, respectively; p < 0.05; n = 132) with water tem-perature ranging from 10.6 to 32.1◦C, pH from 6.61 to 8.71, specific conductivity from 11 to 582 µS cm−1 and DO from 41 to 134 % during the 2008 dry season, 2009 wet season and 2010 end of the wet season campaigns (Supplement Table 1, Supplement Figs. 1 and 2). DIC concentrations ranged from 0.2 to 4.8 mmol L−1 with an overall mean of 1.1 ± 1.0 mmol L−1. Exceptionally high
values (3.5 ± 1.6 mmol L−1) were systematically recorded
in Nyambene Hills tributaries during all three campaigns (Fig. 4). DIC concentrations increased consistently down-stream (Pearson correlation: p < 0.01, r2=0.67; n = 108) when excluding values from Nyambene Hills tributaries. The DIC concentrations within different tributaries were similar (paired t test, p > 0.05) during the three campaigns. In con-trast, DIC concentrations in the Tana River mainstream were significantly higher (ANOVA, p < 0.05) during the 2009 wet
Fig. 4. Altitudinal profiles of (A) dissolved inorganic carbon con-centrations and (B) δ13CDICalong the Tana River basin during all three sampling seasons. Dry season data have already been pre-sented in Bouillon et al. (2009).
season campaign (1.3 ± 0.2 mmol L−1) and lowest during the 2010 end of the wet season campaign (1.1 ± 0.2 mmol L−1).
δ13CDICsignatures ranged from −20.8 to −2.4 ‰ during
the three campaigns. δ13CDIC values within different
tribu-taries were similar (paired t test, p > 0.05) during all three campaigns, but the Tana River mainstream recorded rela-tively depleted values (−11.2 ± 1.8 ‰) during the 2009 wet season campaign compared to the 2008 dry season and 2010 end of wet season campaigns combined (−8.7 ± 0.7 ‰). Overall, δ13CDIC showed a negative correlation with DIC
concentrations (Pearson correlation: p < 0.01, r2=0.49;
n =122) during all three campaigns, with tributaries from the Aberdare and Mt Kenya regions recording the lowest DIC concentrations (0.6 ± 0.3 mmol L−1) and highest δ13C
DIC
signatures (−6.9 ± 2.7 ‰) and the Tana River mainstream intermediate DIC concentrations (1.2 ± 0.2 mmol L−1) and
δ13CDIC signatures (−9.7 ± 1.7 ‰), whereas Nyambene
Hills tributaries recorded the highest DIC concentrations (3.5 ± 1.6 mmol L−1) and the lowest δ13CDIC signatures
(−11.3 ± 2.4 ‰). Substantially higher δ13CDICvalues were
observed at Masinga Reservoir (−4.5 ± 0.1 ‰) during the
dry season, but this decreased rapidly to −8.9 ‰ less than 5 km downstream.
3.2 Dynamics of riverine pCO2and CO2fluxes
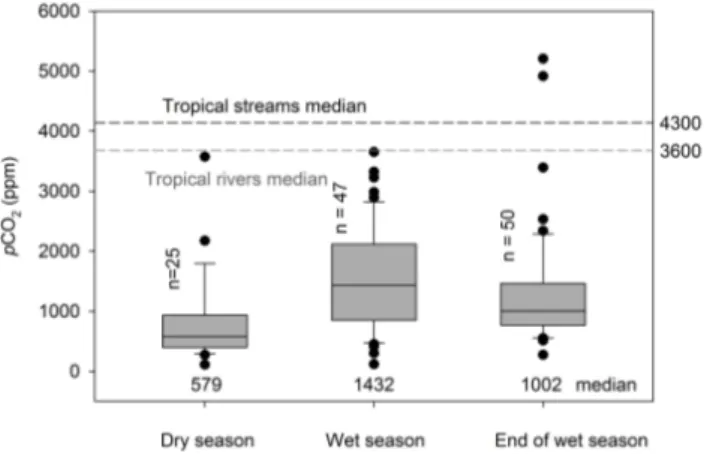
The whole river network, with a few exceptions, was supersaturated with CO2 (pCO2 values between 110
and 5204 ppm) with respect to atmospheric equilibrium (385 ppm), with an overall median of 1002 ppm. Higher val-ues were recorded during the 2009 wet season campaign (median 1432 ppm) compared to the 2010 end of the wet sea-son (median 1002 ppm), whereas the 2008 dry seasea-son was two-fold lower (median 579 ppm, Fig. 5). Tributaries from the Aberdare and Mt Kenya regions recorded low pCO2
concentrations (median 867 ppm) compared to those from Nyambene Hills tributaries and the Tana River mainstream (median 1220 ppm, ANOVA p < 0.05, Fig. 6b). During the 2009 wet season campaign, tributaries from Mt Kenya re-gion recorded higher pCO2concentrations (t test, p < 0.05),
particularly those in mid-altitude catchments (1850–900 m), characterised by intensive agricultural practises. During the 2009 wet season campaign, sampling at Kamburu Dam was done shortly before the actual onset of the wet season. Sur-face waters were highly undersaturated in CO2during both
the wet (pCO2= 118 ppm) and end of the wet season
cam-paigns (pCO2= 305 ppm). Surface waters of Masinga
Reser-voir were similarly undersaturated in CO2 during the 2008
dry season campaign (pCO2 from 313 to 443 ppm,
Bouil-lon et al., 2009) but relatively oversaturated in CO2during
the end of the wet season campaign (pCO2 from 2629 to
3389 ppm). However, pCO2was elevated downstream of the
Masinga Reservoir exit (2303 to 5204 ppm at Tana River– Masinga Bridge) during all three campaigns, but the con-centrations decreased rapidly downstream (Supplement Ta-ble 1). pCO2 showed a negative correlation with δ13CDIC
values (Pearson correlation: p < 0.01, r2=0.52; n = 125; Fig. 6a) during all three campaigns.
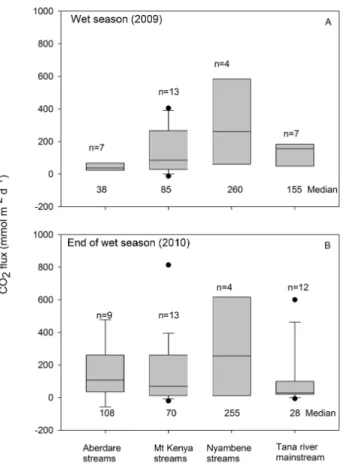
CO2 fluxes between the river and the atmosphere based
on floating chamber measurements ranged from −12.4 to 639.0 mmol m−2d−1 during the wet season campaign and from −57.1 to 813.7 mmol m−2d−1during the end of the wet season campaign. The CO2 fluxes were similar during the
two seasons (Paired t test, p > 0.05). Similar to pCO2,
dis-proportionately high water–air evasion was recorded during the end of the wet season campaign downstream of Masinga Reservoir exit (Masinga Bridge, 600 mmol m−2d−1). On
av-erage, Nyambene Hills tributaries recorded the highest CO2
evasion (−4.2 to 617 mmol m−2d−1) during both seasons
(Fig. 7) corresponding with higher pCO2 values (806 to
4915 ppm). Generally, CO2fluxes showed a positive
corre-lation with pCO2(Pearson correlation: p < 0.01, r2=0.61;
Fig. 5. Boxplots of pCO2 during the three sampling campaigns. The centre line, box extent, error bars, and dots denote the 50th percentile, 25th and 75th percentiles, 10th and 90th percentiles, and outliers of estimates, respectively. Horizontal dashed lines represent tropical medians for rivers and streams (Aufdenkampe et al., 2011).
3.3 Nitrate, chlorophyll a, primary production and respiration measurements
Nitrate concentrations ranged from 0.4 to 146 µmol L−1 dur-ing all three seasons (Supplement Table 2). The concentra-tions increased consistently downstream during both the wet season (Pearson correlation: p < 0.01, r2=0.75; n = 50) and end of the wet season (Pearson correlation: p < 0.01,
r2=0.50; n = 50; Fig. 8b), but during the dry season, nitrate did not show a systematic pattern with altitude. The highest mean concentrations (78.6 to 96.3 µmol L−1) were recorded
in Nyambene Hills tributaries during all three seasons. Chlorophyll a concentration ranged from 0.18 to 9.60 µg L−1 with means of 2.74 ± 2.52, 1.94 ± 1.94 and 2.20 ± 2.75 µg L−1during the dry season, the wet season and end of the wet season respectively (Supplement Table 2). The chlorophyll a concentration increased consistently down-stream (Pearson correlation: p < 0.01, r2=0.55; n = 117; Fig. 9b), and values during different seasons were not sig-nificantly different (paired t test, p > 0.05). Elevated chloro-phyll a concentrations (3.2 to 20.6 µg L−1) were recorded in the Kamburu and Masinga reservoirs during all three sam-pling campaigns.
The primary production rates ranged from 0.004 to 7.38 µmol C L−1h−1 with means of 0.42 ± 0.46 and 0.83 ± 1.58 µmol C L−1h−1 for the wet and the end of
the wet season campaign, respectively. The primary pro-duction rates increased consistently downstream (Pearson correlation: r2=0.55, p < 0.01; n = 84; Fig. 9a) during both campaigns. Disproportionately high values ranging between 10.28 and 18.28 µmol C L−1h−1 were recorded in the Kamburu and Masinga reservoirs (Supplement Ta-ble 2). The means for different seasons were similar (paired
t test, p > 0.05), but Mt Kenya and Nyambene Hills tribu-taries recorded significantly higher values (0.19 ± 0.22 and
Fig. 6. (A) Plot of δ13CDICvs. pCO2along the Tana River basin,
(B) Boxplots of pCO2along the Tana River basin. The centre line, box extent, error bars, and dots denote the 50th percentile, 25th and 75th percentiles, 10th and 90th percentiles, and outliers of esti-mates, respectively.
0.79 ± 0.45 µmol C L−1h−1, respectively) during the 2009 wet season campaign (paired t test, p < 0.05) compared to the 2010 end of the wet season campaign (0.07 ± 0.07 and 0.26 ± 0.28 µmol C L−1h−1, respectively).
Riverine R rates were measured only during the 2009 wet season campaign and ranged from 0.20 ± 0.07 to 3.64 ± 0.03 µmol O2L−1h−1 with a basin-wide mean of
1.43 ± 0.91 µmol O2L−1h−1 (Supplement Table 2). The
R rates increased downstream (Pearson correlation: p < 0.01, r2=0.38; n = 33; Fig. 8a), with Aberdare and Nyambene Hills tributaries recording the lowest mean (0.84 ± 0.84 µmol O2L−1h−1) and Mt Kenya tributaries
an intermediate one (1.37 ± 0.90 µmol O2L−1h−1), while
the lower Tana River mainstream stretch had the highest (1.92 ± 0.72 µmol O2L−1h−1). The R rates also showed a
positive correlation with temperature (Pearson correlation:
Fig. 7. Boxplots of CO2effluxes along the Tana River basin during
(A) the wet season, (B) end of the wet season. The centre line, box extent, error bars, and dots denote the 50th percentile, 25th and 75th percentiles, 10th and 90th percentiles, and outliers of estimates, re-spectively.
3.4 Diurnal biogeochemical processes
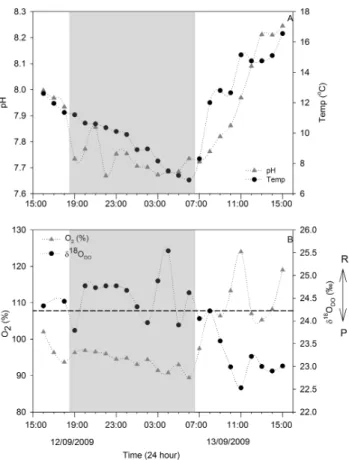
During the diurnal cycles, water temperature fluctuated by 9.7 (6.9–16.6◦C), 2.1 (21.8–23.9◦C) and 1.5◦C (24.6– 26.1◦C), while pH fluctuated by ∼ 0.58 (7.67–8.25), 0.14 (6.98–7.12) and 0.05 units (7.83–7.88) at Chania Stream, Masinga Dam and Tana River mainstream, respectively (Table 1). The DO saturation fluctuated by 34.6 (89.4– 124.0 %), 10.6 (63.0–73.6 %) and 3.2 % (96.7–99.9 %) at Chania Stream, Masinga Dam and Tana River mainstream, respectively (Table 1). The in situ field measurements of pH, temperature and DO increased steadily during daytime and decreased at night at Chania Stream (Fig. 10), while no dis-cernible trends were observed at Masinga Dam and the Tana River mainstream.
δ18ODO signatures at Chania Stream ranged from +22.5
to +25.5 ‰ (Supplement Table 3), with a diurnal mean of +24.0 ± 0.8 ‰. Although the magnitude of change was small, the values decreased during day time and increased at night time (Fig. 10). δ18ODO signatures showed a strong
negative correlation with DO saturation (Pearson correlation:
Fig. 8. Altitudinal profile of (A) respiration rate during the 2009 wet season, and (B) nitrate concentrations along the Tana River basin during the three sampling seasons.
p <0.01, r2=0.84; n = 23; Fig. 11a). Masinga Dam val-ues (+25.4 to +28.2 ‰) showed moderate diurnal fluctuation, while the Tana River mainstream (+24.6 to +25.5 ‰) values did not exhibit clear diurnal fluctuations. The δ18ODO
val-ues at both the Masinga Dam and Tana River mainstream remained above the atmospheric equilibrium (+24.2 ‰) dur-ing the whole diurnal cycle, but values at Chania Stream os-cillated above and below atmospheric equilibrium, though with a pronounced diurnal cycle (Fig. 10b). The maximum
δ18ODO value (+25.5 ‰) at Chania Stream was recorded at
04:00 LT (all times mentioned are in local time) correspond-ing with lowest DO saturation (90.8 %). Generally, δ18ODO
values at Chania Stream were below atmospheric equilibrium (+24.2 ‰) during daytime (07:00 to 17:00) and above atmo-spheric equilibrium at night (18:00 to 06:00).
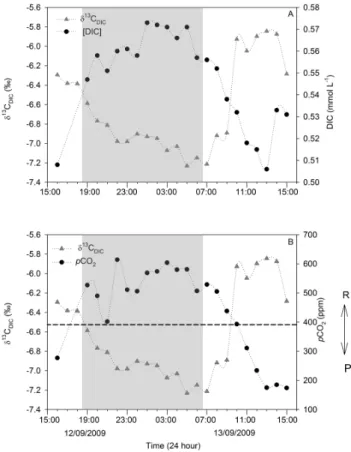
The DIC values during the diurnal cycles ranged from 0.506 to 0.573 mmol L−1, 0.603 to 0.719 mmol L−1, and 1.152 to 1.224 mmol L−1, whereas δ13CDIC ranged from
−7.2 to −5.8 ‰, −10.4 to −9.6 ‰, and −8.9 to −8.0 ‰ for Chania Stream, Masinga Dam and the Tana River main-stream, respectively (Supplement Table 3). The latter two
Fig. 9. Altitudinal profile of (A) primary production and (B) chloro-phyll a along the Tana River basin during different sampling sea-sons.
sites showed minimal δ13CDICdiurnal amplitude (∼ 0.9 ‰)
compared to Chania Stream (1.4 ‰). δ13CDIC values at
Chania Stream typically increased during daytime and de-creased at night (Fig. 12a). While the amplitudes of both DIC and δ13CDICat Chania Stream were small, their
diur-nal cycles were pronounced but showed reversed patterns (Fig. 12a). In contrast, both the Masinga Dam and Tana River mainstream did not exhibit clear diurnal patterns for either δ13CDICor DIC. However, the DIC concentrations at
the Tana River mainstream (1.191 ± 0.020 mmol L−1) were significantly high (ANOVA, p < 0.01) compared to those of Chania Stream (0.547 ± 0.021 mmol L−1) and Masinga
Reservoir (0.666 ± 0.027 mmol L−1).
During the diurnal cycles, pCO2values ranged from 174
to 614 ppm, 2621 to 3684 ppm, and 980 to 1131 ppm at Chania Stream, Masinga Dam and Tana River mainstream, respectively (Supplement Table 3). pCO2 showed
system-atic diurnal fluctuations at Chania Stream, increasing consis-tently at night above the atmospheric equilibrium (385 ppm) to a maximum of 614 ppm at 22:00 (Fig. 13a). From 06:00,
Fig. 10. Diurnal fluctuations of (A) pH and temperature, and (B)
δ18O-DO and % saturation of dissolved oxygen at Chania Stream. Night-time is indicated in grey.
the pCO2 values started to decrease, attaining a minimum
plateau of ∼ 180 ppm at 13:00. In contrast, pCO2
val-ues at Masinga Dam (2621 to 3684 ppm) and Tana River mainstream (980 to 1131 ppm) were consistently above at-mospheric equilibrium (385 ppm) during the whole diurnal cycle, with no clear diurnal fluctuation pattern. Similarly, CO2 fluxes ranged from −52 to 41 mmol m−2d−1, 95 to
331 mmol m−2d−1, and 2 to 16 mmol m−2d−1 at Chania Stream, Masinga Dam and Tana River mainstream, respec-tively (Supplement Table 3). CO2fluxes and pCO2showed
an identical diurnal pattern at Chania Stream (Fig. 13a), but CO2fluxes at Masinga Dam and Tana River mainstream were
consistently high throughout diurnal cycle and did not exhibit clear diurnal patterns.
The gas transfer velocity (k600) computed from the flux CO2 and the air–water pCO2 gradient was on average
much higher at Chania Stream (25.6 ± 13.0 cm h−1) than at Masinga Reservoir (7.7 ± 2.4 cm h−1) and at Tana River at Bura (1.3 ± 0.4 cm h−1) (Supplement Table 3).
Fig. 11. Cross-plots showing behaviour of different biogeochemical parameters during the diurnal cycle at Chania Stream between 12 and 13 September 2009.
4 Discussion
4.1 Longitudinal patterns of dissolved inorganic carbon and δ13CDIC
In the Tana River basin, DIC generally increased downstream during all three seasons, a strong indication of DIC build-up possibly contributed by rock weathering. This is partic-ularly evident along the Tana River mainstream, where DIC strongly increased downstream during all seasons (Fig. 4a), which corresponded to an increase in suspended matter (Bouillon et al., 2009; Tamooh et al., 2012). Nyambene Hills tributaries recorded exceptionally high DIC concentrations (Fig. 4a) during all three seasons, a phenomenon we as-sociate with a high rate of rock weathering. The lithology of the Nyambene Hills subcatchment mainly includes Qua-ternary volcanic rocks. The high rate of chemical weather-ing could result from the presence of ashes and pyroclas-tic rocks, as these have much higher weathering rates than basalts and trachytes (Hughes et al., 2012). HCO−3 in rivers is mainly derived from the weathering of carbonate and sili-cate rocks. The relative proportion of HCO−3 in rivers derived from weathering of carbonate and silicate rocks depends to a very large extent on the lithology of the drainage basin (Gar-rels and Mackenzie 1971; Meybeck 1987). In Kenya, sed-imentary carbonate rocks are associated with the Mozam-bique Belt, south of the Tana drainage basin (Warden and Horkel 1984). The Tana drainage basin is rich in silicate
Fig. 12. Diurnal fluctuations of (A) δ13CDICand DIC concentra-tions, and (B) δ13CDICand pCO2at Chania Stream. Night-time is indicated in grey.
rocks as it is mainly composed of Tertiary and Quaternary volcanic rocks, mainly basalt and a broad spectrum of alka-line rocks (e.g. Baker, 1987). Also, Kenya is extremely rich in alkaline rocks and carbonates (Woolley, 2001), including calcite carbonate (Rosatelli et al., 2003). Finally, saline and sodic soils characterise the dry lands in Kenya (Dijkshoorn et al., 2010), and the latter soils are rich in carbonates.
TA is well correlated with dissolved silicate (DSi) and the sum of Ca2+ and Mg2+ (Fig. 14), suggesting that HCO−3 in the Tana originates from both carbonate and silicate rock weathering. The strong correlation between TA and Na+ pro-vides additional evidence for silicate weathering, which is the main source of Na+ in rivers (data not shown). To dis-criminate the origin of HCO−3, we applied the simple stoi-chiometric model of Garrels and Mackenzie (1971), whereby the contribution to TA from carbonate weathering (TAcarb) is
computed from Ca2+and Mg2+, and the contribution to TA from silicate weathering (TAsil) is computed from DSi
ac-cording to
TAcarb=2 × ([Ca2+] + [Mg2+] − [SO2−4 ]), (2)
Fig. 13. Diurnal fluctuations of (A) CO2 effluxes and pCO2 and
(B) TA and specific conductivity at Chania Stream. Night-time is indicated in grey.
SO2−4 allows for Ca originating from the dissolution of gyp-sum (CaSO4) to be accounted for. However, SO2−4 data were
only available for the 2009 wet season campaign, so we did not apply this correction. For the 2009 wet season campaign, SO2−4 corresponded on average to 11 % of Ca2+. The result-ing estimated relative contributions of silicate weatherresult-ing to total rock weathering ranges between 7 and 78 % and aver-ages 28 %, close to the overall average of 24 % for African rivers reported by Garrels and Mackenzie (1971). Modelled TA (TAcarb+ TAsil) is very close to measured TA, as most
data points fall on the 1 : 1 line, with the exception of eight outliers (Fig. 15), which are mostly from the three rivers in the Nyambene Hills (Murera, Rojewero and Mutundu).
As previously reported by Hughes et al. (2012), the Nyam-bene Hills region is characterised by high silicate weathering, with DSi values up to 1148 µmol L−1(Supplement Table 1),
above the maximum of 958 µmol L−1previously reported by Hughes et al. (2012). In the absence of detailed lithologi-cal information of the drainage basin in Nyambene Hills, it is difficult to explain the discrepancy between modelled and observed TA. Precipitation of hydrous sodium silicates and zeolites (Sebag et al., 2001) could explain the discrep-ancy because it would lead to a removal of DSi but
leav-Fig. 14. Total alkalinity against (A) the sum of Ca2+and Mg2+ concentrations along the Tana River basin and (B) dissolved silicate along the Tana River basin.
ing HCO−3 unaffected. The stoichiometric model of Garrels and Mackenzie (1971) assumes that the weathering of sili-cate rocks leads to a release of HCO−3 and DSi according to a 1 : 2 ratio. However, the dissolution of certain silicates such as plagioclase feldspar (NaCaAl3Si5O16) may lead to
the release of HCO−3 and DSi according to a 6 : 4 ratio. When we apply this ratio to the data points of Nyambene Hills rivers, the recomputed modelled TA is in better agreement with observed TA than based on the HCO−3 : DSi ratio of 1 : 2 (Fig. 15).
The dynamics of riverine δ13CDICare primarily controlled
by both in-stream and watershed processes (Finlay and Kendall, 2007). The wide range of δ13CDICvalues recorded
in the present study (−15.0 to −2.4 ‰) suggests variable carbon sources. The δ13CDICvalues of the Aberdare Range
(−6.8 ± 1.6 ‰) and Mt Kenya (−6.7 ± 2.4 ‰) tributaries, and particularly those in high-altitude regions (>1700 m), were characterised by high δ13CDIC values consistent with
carbonate mineral weathering. These high values may be re-inforced by the fact that high-altitude tributaries are char-acterised by fast and turbulent flows, thus enhancing CO2
Fig. 15. Observed total alkalinity against modelled total alkalinity along the Tana River basin.
evasion to the atmosphere. Since the CO2 fraction is
iso-topically depleted relative to HCO−3 and CO2−3 , this pro-cess leads to a gradual enrichment of the remaining DIC pool (e.g. Doctor et al., 2008). We investigated the down-stream (< 1 km) gradients from the Satima springs, a high-altitude stream in the Aberdare Range (3600 m). We noticed a rapid increase in δ13CDICvalues (−20.8 to −8.8 ‰) over
the first 200 m, corresponding to a fast decrease in pCO2
(4789 to 468 ppm) due to rapid CO2degassing into the
atmo-sphere (Fig. 16). High δ13CDICvalues (−4.5 ± 0.1 ‰, n = 4)
were recorded at Masinga Reservoir during the dry season campaign (Bouillon et al., 2009), consistent with CO2
de-gassing combined with CO2 consumption by primary
pro-duction. The increase in water residence time at the reservoir also favours CO2exchange with the atmosphere. High
pri-mary production was demonstrated by high chlorophyll a concentrations in the Masinga Reservoir. Similar observa-tions have been reported in other dammed rivers (Brunet et al., 2005; Zeng et al., 2011). δ13CDICvalues were relatively
depleted in the lower Tana mainstream during the three sea-sons. Lower δ13CDICvalues correlated with an increase in
to-tal suspended matter (TSM) (Bouillon et al., 2009; Tamooh et al., 2012), suggesting that degradation of laterally derived organic matter plays an important role in controlling δ13CDIC
values along the lower Tana River mainstream. When ex-cluding values from Nyambene Hills tributaries, the negative relationship between δ13CDICvalues and DIC concentration
(Pearson correlation: p < 0.01, r2=0.62; n = 39) and the positive correlation between δ13CDIC values and DO
(Pear-son correlation: p < 0.01, r2=0.52; n = 39) during the wet season campaign further suggests the contribution of organic matter degradation.
Fig. 16. A plot showing behaviour of CO2 concentration and
δ13CDICat the Satima springs groundwater source in the headwa-ters of the Aberdare Range.
4.2 Factors regulating pCO2and CO2fluxes
As reported for other tropical rivers (Richey et al., 2002; Mayorga et al., 2005; Aufdenkampe et al., 2011), the Tana River was generally supersaturated in CO2 with respect
to atmospheric equilibrium. This was the case during all three seasons. The overall median pCO2for the Tana River
(1002 ppm) is, however, relatively low compared to the global median of ∼ 3600 and ∼ 4300 ppm for tropical rivers and streams, respectively (Aufdenkampe et al., 2011). The Tana River tributaries at high altitudes were characterised by relatively low pCO2concentrations compared to other
tropi-cal high-altitude streams, e.g. 11 000 to 25 000 ppm for Ama-zon headwaters (Davidson et al., 2010). One possible expla-nation is relatively low in-stream respiration as Tana River headwater streams are characterised by low suspended sed-iment (Bouillon et al., 2009; Tamooh et al., 2012) and low temperatures, resulting in lower CO2 production from
or-ganic matter degradation. In addition, the CO2 carried by
groundwater inputs rapidly degasses to the atmosphere, as observed in the Aberdare Range headwaters. The CO2from
groundwater at Satima springs rapidly degassed (4789 to 468 ppm) with increasing distance from the spring source (Fig. 16), resulting in ∼ 90 % CO2 evasion over a distance
of a few hundred metres. Similar observations have been re-ported from both temperate (Doctor et al., 2008; Wallin et al., 2012) and tropical headwater streams (Johnson et al., 2008; Davidson et al., 2010), thus depicting small streams as hotspots for CO2evasion. Further, we observed a strong
cou-pling between isotopic signatures of DIC andpCO2 where
δ13CDICvalues (−20.8 to −8.8 ‰) became rapidly enriched
downstream, thus providing further evidence of rapid de-gassing downstream from groundwater inputs (Fig. 16). In contrast to Aberdare and Mt Kenya streams, Nyambene Hills tributaries recorded relatively high pCO2 values (median
1377 ppm, n = 12; Fig. 6b) as well as high CO2evasion
(me-dian ∼ 260 mmol m−2d−1, Fig. 7, Supplement Table 1),
no-tably in Murera and Mutundu tributaries during both the wet and end of wet season campaigns. However, Nyambene Hills tributaries were characterised by a cover of high organic mat-ter on the river bed up to 17 % (Tamooh et al., 2012), possibly contributing to additional generation of CO2through
respira-tion. This way, Nyambene Hills subcatchment emerges as a major hotspot for CO2emissions within the Tana River basin.
Primary production strongly controlled pCO2in the
reser-voirs, as demonstrated by low pCO2 values during the dry
season at Masinga Reservoir (313 to 443 ppm) and Kamburu Dam during both the wet (118 ppm) and end of the wet sea-son (305 ppm) campaigns (Supplement Table 1). Low turbid-ity coupled with high water residence time and temperatures (∼ 30◦C) in the reservoirs enhanced phytoplankton produc-tion, thus consuming CO2. In contrast, the depth profile data
obtained at Masinga Dam (up to 15 m deep) recorded consis-tently high pCO2values (3385 ± 212 ppm, n = 5) during the
end of the wet season campaign. This suggests that the dam water was vertically mixed owing to the fact that this sam-pling campaign coincided with an unusual dam infilling (fol-lowing high precipitation in headwaters) and excess outflow at the spillway, thus enhancing upwelling. Furthermore, a maximal pCO2value (5059 ppm) was recorded at 20 m depth
(Supplement Table 1). Conversely, Kamburu Dam recorded highly stratified pCO2 values during both the wet season
(118 ppm at surface waters and 2556 ppm at 20 m depth) and end of the wet season campaigns (305 ppm at surface waters and 3270 ppm at 20 m depth) (Supplement Table 1). In ad-dition, consistently high pCO2values (up to 5204 ppm) and
CO2flux (600 mmol m−2d−1) were recorded downstream of
the Masinga Reservoir exit (Masinga Bridge), a phenomenon we attribute to the release of hypolimnetic, CO2-rich
wa-ter. However, the CO2degassed rapidly < 5 km downstream,
where we observe ∼ 90 % of CO2 being degassed before
reaching the entrance of Kamburu Dam (Supplement Ta-ble 1). Thus, Masinga Reservoir contributes significantly to CO2emission downstream, consistent with observations
re-ported in some tropical reservoirs where CO2fluxes ranging
from 412 to 1494 mmol m−2d−1were recorded immediately downstream of the reservoirs (Guérin et al., 2006; Abril et al., 2005).
While different in-stream and watershed processes reg-ulate riverine pCO2 dynamics, organic matter respiration
within the river seemed to be the major controlling process in the Tana River mainstream, as reflected by high pCO2
val-ues during the 2009 wet season campaign. Furthermore, the lower Tana River mainstream was characterised by high sus-pended sediment and dissolved organic carbon, thus fuelling in-stream respiration (Tamooh et al., 2012). This is further corroborated by the general negative correlation observed be-tween δ13CDICvalues and pCO2values (Fig. 6a). In-stream
processing and decomposition of terrestrially derived organic carbon have been reported to primarily regulate CO2evasion
in most large tropical rivers (Richey et al., 2002; Mayorga et al., 2005).
4.3 Dynamics of aquatic metabolism
River metabolism is primarily influenced by the availabil-ity of light, nutrients, temperature and organic matter subsi-dies. Both primary production rates and chlorophyll a con-centrations increased consistently downstream in the Tana River basin (Fig. 9), contrary to expectation, as the turbid-ity increased downstream (Bouillon et al., 2009; Tamooh et al., 2012). However, primary production rates here are based on incubations of surface water within the euphotic zone (∼ 0.5 m deep) and do not represent depth-integrated values (deeper in the water column light is obviously extinct). The downstream increase in primary production can be attributed to higher temperatures coupled with higher water residence time in the lower Tana River mainstream. In addition, during the wet season, the nitrate concentrations increased down-stream (Pearson correlation: r2=0.75, p < 0.01; n = 50; Fig. 8b), particularly along the lower Tana River mainstream, thus potentially enhancing primary production. This coun-terintuitive observation of high productivity in turbid rivers has also been reported for some large temperate rivers, such as the Mississippi (Kendall et al., 2001; Delong and Thorp, 2006) and Meuse (Descry and Gosselain, 1994), as well as in the White Nile (Sinada and Karim, 1984). While most headwater tributaries are characterised by low suspended matter, primary production rates were low owing to nutri-ent limitation, low temperature and high stream flow veloc-ity – factors unfavourable for efficient phytoplankton pro-duction. Generally, primary production in tropical rivers has been reported to be quite variable ranging from lows of 10– 200 mg C m−2d−1to over 1000 mg C m−2d−1 in relatively unpolluted systems, but can exceed 6000 mg C m−2d−1 in polluted systems (Davies et al., 2008).
The mean river depth between Kora Bridge and the Tana River mouth during the wet season ranges between 2.0 and 3.0 m, while the average respiration rate along the same stretch was 1.92 ± 0.72 µmol O2L−1h−1. This would
trans-late to a depth-integrated pelagic respiration ranging between 92 and 138 mmol m−2d−1, while the median CO2efflux was
156 mmol C m−2d−1 (Table 2, Fig. 7a). Assuming the net primary production is negligible; this suggests that the bulk of CO2evasion (77 to 114 %) along the lower Tana
main-stream can be accounted for by in-main-stream respiration (Ta-ble 2, Fig. 7a). These estimates are based on the assump-tion that the respiraassump-tion quotient between O2and CO2is 1.3,
as suggested by Richardson et al. (2013). Similar observa-tions have been reported in the Amazon Basin, where in-stream respiration was highly variable but could account for up to ∼ 100 % of the CO2evasion in some rivers (Ellis et al.,
2012).
In contrast, most headwater tributaries in the Tana River basin are shallow (∼ 0.5–1 m deep), with
Table 1. Summary of the ranges in physico-chemical parameters for diurnal sampling sites.
Site Sampling Mean depth DO pH T SC
date (m) (%) (◦C) (µS cm−1)
Chania Stream 12/09/2009 0.5 98.4–124.0 7.67–8.25 6.9–16.6 50–53 Masinga Dam 27/06/2010 20 63.0–73.6 6.98–7.12 22.0–23.4 71–75 Tana mainstream 20/07/2010 3 96.7–99.9 7.83–7.88 24.6–25.8 134–137 Range for each parameter – DO = dissolved oxygen saturation; T = temperature; SC = specific conductivity
Table 2. Comparison between CO2flux evasion and depth-integrated R during the 2009 wet season campaign.
Site Mean river Median CO2flux Depth-integrated R % of CO2evasion depth (m) (mmol C m−2d−1) (mmol C m−2d−1) accounted for by R
Aberdares streams ∼0.5–1.0 38 13–26 34–68
Mt Kenya streams ∼0.5–1.0 85 21–43 25–51
Nyambene Hills streams ∼0.5–1.0 260 14–27 5–10
Tana River mainstream ∼2.0–3.0 156 120–179 77–114
depth-integrated respiration rates ranging between ∼ 10 and 33 mmol m−2d−1, while the median CO2fluxes ranged
between 38 and 260 mmol m−2d−1(Table 2, Fig. 7a). This implies that in-stream respiration accounts for a smaller fraction of total CO2 evasion (5 to 68 %) in the studied
tributaries compared to the Tana River mainstream. This is particularly the case for the Nyambene Hills tributaries, whose pelagic respiration accounts for only 5 to 10 % of total CO2evasion (Table 2, Fig. 7a). This suggests the excess
bulk CO2evasion must be sustained by other processes such
as inputs of groundwater (highly CO2 oversaturated to soil
and root respiration) and/or in-stream benthic respiration. The latter hypothesis is in agreement with the fact that most Nyambene Hills tributaries were characterised by high organic matter on the bottom of the river bed possibly fuelling respiration.
4.4 Factors regulating diurnal variations in surface water biogeochemistry
Diurnal fluctuations of biogeochemical variables were sub-stantial in the Chania headwater stream, moderate at Masinga Reservoir and not detectable within the lower Tana main-stream. Dissolved oxygen was supersaturated with respect to atmospheric equilibrium at the headwaters site (Chania Stream), reaching a maximum value of 124.0 % during day-time (11:00) and minimum saturation of 89.4 % at 06:00, shortly before sunrise. Similarly, the pH increased during daytime (indicative of CO2consumption by photosynthesis)
and decreased at night (indicative of CO2 release by
res-piration). These patterns were absent at both the Masinga Dam and lower Tana River mainstream, where biogeochem-ical parameters remained nearly constant during the whole diurnal cycle. Masinga Dam surface waters were particularly undersaturated in DO (63.0 to 73.6 %, Table 1), suggesting
the dominance of respiration and net heterotrophy. The ab-sence and/or small fluctuation of DO at Masinga and the Tana River mainstream may be attributed to high suspended loads (Bouillon et al., 2009; Tamooh et al., 2012), which attenuate photosynthetic light, as opposed to the headwaters site (Cha-nia Stream), which is characterized by low suspended matter concentrations.
The δ18ODOsignatures fluctuated by ∼ 3.0, 2.8, and 0.9 ‰
at Chania Stream headwaters, Masinga Reservoir and Tana River mainstream, respectively. The signatures at Chania Stream were isotopically light during daytime and enriched at night, fluctuating slightly below and above the atmospheric equilibrium value (+24.2 ‰). This suggests that aquatic P dominated riverine biological activities during the day but reversed to R dominance at night. Similar observations have been reported in small streams elsewhere (Parker et al., 2005; Waldron et al., 2007; Gammons et al., 2011; Parker et al., 2010; Nimick et al., 2011). In contrast, Masinga Dam and Tana River mainstream δ18ODOsignatures were consistently
above atmospheric equilibrium (+24.2 ‰), suggesting the two sites were dominated by R and thus predominantly het-erotrophic during the whole diurnal period.
Precipitation and dissolution of CaCO3in freshwaters can
be deduced from changes in TA (e.g. McConnaughey et al., 1994). At Masinga Dam and Tana River mainstream, TA did not show a distinct pattern during the diurnal cycle. For Cha-nia Stream, the TA values followed a regular pattern, with a decrease from 01:00 to 13:00 of about 0.035 mmol L−1, (Fig. 13b) inconsistent with the one expected from daily cy-cles of precipitation/dissolution of CaCO3 (increase of TA
during night-time and decrease of TA during daytime; de Montety et al., 2011; Gammons et al., 2011). The changes of TA at Chania Stream followed those of conductivity, suggest-ing overall changes in the chemistry of flowsuggest-ing waters rather
than in-stream processes affecting TA. We conclude that changes in DIC can be ascribed to P and R and that precipita-tion/dissolution of CaCO3was not a major process
contribut-ing to daily changes of DIC. The DIC concentration showed a fluctuation of ∼ 0.067, 0.116, and 0.072 mmol L−1at Cha-nia Stream, Masinga Reservoir and Tana River mainstream, respectively. However, DIC concentrations and δ13CDIC
val-ues showed a strong inverse relationship (Pearson correla-tion: p < 0.01, r2=0.87; n = 22; Fig. 11c) characterised by a pronounced diurnal cycle at Chania Stream only. DIC concentrations at Chania Stream increased at night due to aquatic community respiration, and decreased during day-time due to CO2uptake by photosynthesis. Studies elsewhere
have reported substantial diurnal changes in DIC concentra-tions ranging from 0.300 to 0.420 mmol L−1 (Poulson and Sullivan, 2010; Gammons et al., 2011) with a record fluctu-ation of ∼ 1.133 mmol L−1reported by Parker et al. (2010).
However, this large diurnal change in DIC concentration is reported to have been driven by unique calcite precipitation and not in-stream P or R (Gammons et al., 2007; Nimick et al., 2011).
Similarly, δ13CDIC values at Chania Stream showed a
modest fluctuation of ∼ 1.4 ‰, with signatures increasing during daytime as 12CO2 was preferentially utilised by
aquatic periphyton phototrophs at a faster rate than13CO2.
At night, δ13CDIC signatures were isotopically depleted as
CO2was released as a result of aquatic community
respira-tion. In contrast, δ13CDICat Masinga Dam and the Tana River
mainstream showed minor fluctuations (∼ 0.8 and 0.9 ‰, re-spectively) and did not exhibit systematic diurnal patterns.
Chania Stream showed strong diurnal cycles for both
pCO2 and CO2fluxes, with in-stream P and R as the
ma-jor drivers as reflected by a strong negative correlation be-tween DO and pCO2 (Pearson correlation: p < 0.01, r2=
0.74; Fig. 11e). In contrast, pCO2 at Masinga Dam (2621
to 3684 ppm) and Tana River mainstream (980 to 1131 ppm) was consistently above atmospheric equilibrium (385 ppm), and the two sites were sources of CO2to the atmosphere
dur-ing the whole diurnal period (95 to 331 mmol CO2m−2d−1
at Masinga; 2 to 16 mmol CO2m−2d−1 in the lower Tana
River). While the general observation is that in-stream P and R control biogeochemical processes in Chania Stream, it is worth mentioning that P is largely driven by periphy-ton as outlined below. We computed net community pro-duction (NCP), gross primary propro-duction (GPP) and respi-ration (R) at community level based on the diurnal changes of O2, using an oxygen mass balance, the so-called Odum
method (Odum, 1956). Accordingly, the hourly change of O2
in surface waters during night-time corresponds to the hourly rate of community respiration (CR); the hourly change of O2
in surface waters during daytime corresponds to the hourly rate of net community production. Assuming that the hourly rate of community respiration is constant through the daily cycle, the hourly rate of GPP is computed as NCP + CR. In order to account for the effect of changes of
tempera-ture on the solubility of O2, we used apparent oxygen
util-isation (AOU) night-time temporal changes to compute R during the 24 h cycle at Chania from the linear regression of AOU versus time. The change of AOU as a function of time was very linear (r2=0.84) and yielded an R value of 2.44 ± 0.33 µmol O2L−1h−1. The change of oxygen during
daytime corresponds to the difference between gross primary production (GPP) and R. If the rate of R during night-time is considered to be the same as during daytime, then this al-lows for GPP to be computed. The daytime temporal change of AOU computed by linear regression at Chania allowed for computation of a GPP value of 6.41 ± 3.92 µmol O2L−1h−1.
The error on the GPP estimate is higher than on the R esti-mate because the AOU data showed more scatter during day-time (r2=0.19). The oxygen mass balance approach pro-vides estimates of metabolic rates (GPP and R) at commu-nity level, integrating both planktonic and benthic compart-ments. Both GPP and R based on the oxygen mass balance have rates (6.41 and 2.44 µmol O2L−1h−1) that are one to
three orders of magnitude higher than those derived from planktonic incubations (0.006 and 0.40 µmol O2L−1h−1).
This can be due to the strong contribution to community metabolism of periphyton and benthic bacterial respiration.
The CO2 flux measurements with floating domes in
aquatic environments have been criticised in the past for a variety of possible biases (Raymond and Cole 2001), al-though there is evidence that these measurements provide reasonable estimates of k600 (Guérin et al., 2007; Vachon et al., 2010). The k600 values we obtained are consistent with those typically reported for streams (Wanninkhof et al., 1990), rivers (Raymond and Cole 2001) and lakes (Cole and Caraco, 1998). The higher k600 values at Chania Stream compared to Tana River fit the pattern described by Raymond et al. (2012) of k600 decreasing with increasing stream order. The higher k600 at Masinga Reservoir compared to the Tana River might be related to lower fetch limitation and more exposure leading to higher contribution of wind-induced tur-bulence to k600 (Borges and Abril, 2011).
5 Conclusions
While the wide range of δ13CDICvalues (−20.8 to −2.4 ‰)
in the Tana River basin suggests variable DIC sources, the primary process regulating of DIC concentrations is weather-ing, as clearly demonstrated by a strong correlation between TA and the sum of Ca2+and Mg2+concentration. However, Nyambene Hills subcatchment is lithologically distinct from the rest of the basin, as reflected by its systematically high TA during all seasons. Global syntheses suggest that streams are generally characterised by higher pCO2than large rivers, but
our data show the opposite pattern with higher concentrations of CO2recorded at the Tana River mainstream compared to
headwater streams. Chlorophyll a and primary production in-creased consistently downstream, contrary to what could be
expected from the RCC and from high TSM concentrations, due to favourable conditions for phytoplankton development such as high nutrients, temperature and water residence time. In-stream R in the lower Tana River mainstream accounted for the bulk of total CO2 evasion (77 to 114 %) to the
at-mosphere, while it could only account for 5 to 68 % of CO2
evasion in headwaters, thus pointing toward greater contri-butions by other watershed processes or in-stream processes such as benthic respiration. Focusing on a depth-integrated primary production measurement in future is critical in order to give an accurate estimate of P : R ratios for Tana River. The diurnal biogeochemical fluctuations were substantial in headwater streams, moderate at Masinga Reservoir and not detectable at Tana River mainstream Masinga Reservoir and Tana River mainstream. However, the timing for Masinga Reservoir sampling was unusual due to infilling of the reser-voir resulting in high water turbulence associated with high turbidity and vertical mixing of water, thus diurnal biogeo-chemical fluctuations at Masinga Dam were not representa-tive of a typical situation. Hence, there is a need to focus on a more representative diurnal sampling in the reservoirs in future studies, particularly the during dry season, when phy-toplankton production is expected to be significant.
Supplementary material related to this article is available online at http://www.biogeosciences.net/10/ 6911/2013/bg-10-6911-2013-supplement.pdf.
Acknowledgements. Funding for this work was provided by
the Research Foundation Flanders (FWO-Vlaanderen, project G.0651.09 and travel grants to F. Tamooh, K. Van Den Meersche, and S. Bouillon), and the European Research Council (ERC-StG 24002, AFRIVAL – African river basins: catchment-scale carbon fluxes and transformations, http://ees.kuleuven.be/project/afrival/). A. V. Borges is a senior research associate at the FRS-FNRS. We thank Pieter van Rijswijk (NIOZ), Peter van Breugel (NIOZ), Zita Kelemen (KU Leuven) and Marc-Vincent Commarieu (ULg) for technical and laboratory assistance; and the Kenya Wildlife Service for logistical support during sampling. Three anonymous reviewers provided insightful comments and suggestions which greatly improved the manuscript.
Edited by: K. Fennel
References
Abril, G., Etcheber, H., Delille, B., Frankignoulle, M., and Borges, A. V.: Carbonate dissolution in the turbid and eutrophic Loire estuary, Mar. Ecol.-Prog. Ser., 259, 129–138, 2003.
Abril, G., Guérin, F., Richard, S., Delmas, R., Galy-Lacaux, C., Gosse, P., Tremblay, A., Varfalvy, L., dos Santos, M. A., and Matvienko, B.: Carbon dioxide and methane emissions and the carbon budget of a 10-year old tropical reservoir (Petit
Saut, French Guiana), Global Biogeochem. Cy., 19, GB4007, doi:10.1029/2005GB002457, 2005.
Amiotte-Suchet, P., Aubert, D., Probst, J. L., Gauthier-Lafaye, F., Probst, A., Andreux, F., and Viville. D.: δ13C pattern of dissolved inorganic carbon in a small granitic catchment: the Strengbach case study (Vosges mountains, France), Chem. Geol., 159, 129– 145, 1999.
Aufdenkampe, K. A., Mayorga, E., Raymond, A P., Melack, M J., Doney, C. S., Alin, R. S., Aalto, E. R., and Yoo, K.: Riverine coupling of biogeochemical cycles between land, oceans, and at-mosphere, Front. Ecol. Environ., 9, 53–60, 2011.
Baker, B. H.: Outline of the petrology of the Kenya rift alkaline province, Geol. Soc. Spec. Publ., 30, 293–311, doi:10.1144/GSL.SP.1987.030.01.14, 1987.
Borges, A. V. and Abril G.: Carbon Dioxide and Methane Dynamics in Estuaries, in: Treatise on Estuarine and Coastal Science Edited by: Wolanski, E. and McLusky, D., Biogeochemistry, Academic Press, Waltham, 5, 119–161, 2011.
Bouillon, S., Abril, G., Borges, A. V., Dehairs, F., Govers, G., Hughes, H. J., Merckx, R., Meysman, F. J. R., Nyunja, J., Os-burn, C., and Middelburg, J. J.: Distribution, origin and cycling of carbon in the Tana River (Kenya): a dry season basin-scale sur-vey from headwaters to the delta, Biogeosciences, 6, 2475–2493, doi:10.5194/bg-6-2475-2009, 2009.
Bouwman, A. F., Bierkens, M. F. P., Griffioen, J., Hefting, M. M., Middelburg, J. J., Middelkoop, H., and Slomp, C. P.: Nutrient dynamics, transfer and retention along the aquatic continuum from land to ocean: towards integration of ecological and bio-geochemical models, Biogeosciences, 10, 1–22, doi:10.5194/bg-10-1-2013, 2013.
Brown, T. and Schneider, H.: From plot to basin: the scale problem in studies of soil erosion and sediment yield, in: The Sustainable Management of Tropical Catchments, edited by: Harper, D. and Brown, T., John Wiley and Sons, Chichester, England, 1998. Brunet, F., Gaiero, D., Probst, J. L., Depetris, P. J., Gauthier, Lafaye,
F., and Stille, P.: δ13C tracing of dissolved inorganic carbon sources in Patagonian rivers (Argentina), Hydrol. Process., 19, 3321–44, 2005.
Brunet, F., Dubois, K., Veizer, J., Nkoue Ndondo, G. R., Ndam Ngoupayou, J. R., Boeglin, J. L., and Probst, J. L.: Terrestrial and fluvial carbon fluxes in a tropical watershed: Nyong basin, Cameroon, Chem. Geol., 265, 563–572, 2009.
Bullen, T. D. and Kendall, C.: Tracing of weathering reactions and water flowpaths: a multi-isotope approach, in: Isotope Tracers in Catchment Hydrology, edited by: Kendall, C. and McDonnell, J. J., Elsevier, Amsterdam, 611-646, 1998.
Butman, D. and Raymond, P. A.: Significant efflux of carbon diox-ide from streams and rivers in the United States, Nat. Geosci., 4, 839–842, doi:10.1038/ngeo1294, 2011.
Cole, J. J. and Caraco, N. F.: Atmospheric exchange of carbon diox-ide in a low-wind oligotrophic lake measured by the addition of SF6, Limnol. Oceanogr., 43, 647–656, 1998.
Cole, J. J. and Caraco, N. F.: Carbon in catchments: connecting ter-restrial carbon losses with aquatic metabolism, Mar. Freshwater Res., 52, 101–110, 2001.
Cole, J. J. and Caraco, N. F.: Primary production and its regulation in the tidal-freshwater Hudson River, in: The Hudson River es-tuary, edited by: Levinton, J. S. and Waldman, J. R., Cambridge University Press, New York, 107–120, 2006.