Contents lists available atScienceDirect
Sustainable Energy, Grids and Networks
journal homepage:www.elsevier.com/locate/segan
DSIMA: A testbed for the quantitative analysis of interaction models
within distribution networks
S. Mathieu
∗, Q. Louveaux, D. Ernst, B. Cornélusse
Department of Electrical Engineering and Computer Science, University of Liège, Liège 4000, Belgium
a r t i c l e i n f o
Article history:
Received 21 May 2015 Received in revised form 6 October 2015
Accepted 11 November 2015 Available online 28 November 2015
Keywords: Market design Load flexibility Demand-side management Agent-based model
a b s t r a c t
This article proposes an open-source testbed to simulate interaction models governing the exchange of flexibility services located within a distribution network. The testbed is an agent-based system in which the distribution system operator, the transmission system operator, producers and retailers make their decisions based on mixed-integer linear programs. This testbed helps to highlight the characteristics of an interaction model, the benefits for the agents and eases the detection of unwanted or abusive behaviors which decreases the welfare. The testbed is implemented in Python and the optimization problems are encoded in the modeling language ZIMPL. A web interface is coupled with an instance generator using macroscopic parameters of the system such as the total power production. This testbed is, therefore, well suited to test the implemented interaction models on various scenarios and to extend the implementation to other models. Five interaction models developed with industrial partners are simulated over a year on a 75-bus test system. Simulations show that interaction models relying on active network management, as they have been developed, lead to substantial welfare even though they suffer from a lack of coordination between the DSO and the TSO. A conservative interaction model restricting grid users to an access range that is computed ahead of time to prevent any congestion, avoids shedding distributed generation but considerably restrains the amount of distributed production.
© 2015 Elsevier Ltd. All rights reserved.
1. Introduction
In previous decades, the operation of the distribution network did not rely on the flexibility of production or consumption. With the ongoing trend toward renewable energy, the need for invest-ments to increase the distribution network capacity could become too expensive to realize. Distribution System Operators (DSO) need to have access to flexibility services in order to reduce their invest-ment needs. The literature contains many papers showing the ben-efits of using such flexibility in distribution networks [1–4] and the methods to deliver this flexibility [5–8]. However, few studies have been performed on the way that the flexibility in distribution net-work can be exchanged as a commodity in an unbundled electric system. Since the DSO does not own the assets which are able to provide flexibility, it has to procure flexibility by contracting with a Flexibility Services Provider (FSP) which may be producer, retailer, aggregator, etc. One current challenge faced by regulators is to
∗Corresponding author.
E-mail addresses:[email protected](S. Mathieu), [email protected](Q. Louveaux),[email protected](D. Ernst), [email protected](B. Cornélusse).
design the legislative framework or interaction model in which ac-tors exchange flexibility services located within a distribution net-work.
This paper proposes an open-source testbed to simulate candi-date interaction models and to perform this kind of comparison. In this testbed, the distribution network is modeled up to its interface to the high voltage network and down to medium voltage-low volt-age transformers, i.e. low voltvolt-age sub-networks are aggregated. We work in a short term context, from a few days ahead until set-tlement. We, therefore, do not consider structural changes of the system. The simulation is performed by an agent-based method considering as agents the distribution system operator, transmis-sion system operator, producers and retailers with the consumers they serve. Every agent solves an optimization problem at every decision stage in order to maximize its individual objective. The system operators desire to ensure the safety of their system at the minimum costs while producers and retailers maximize their profit by selling or retailing electricity and providing flexibility services. The major contribution of this paper is the complete formalization and simulation of the interactions between the stakeholders of a distribution system exchanging flexibility. These exchanges are described by five interaction models devised with industrial partners and their impact is evaluated through a http://dx.doi.org/10.1016/j.segan.2015.11.004
Fig. 1. ZIMPL code of one optimization problem solved by a retailer.
measure of the social welfare, the repartition of the welfare be-tween the actors, and a measure of the service level that is reached. The behavior of each agent under a specific interaction model can be observed and weaknesses or abuses of an interaction model can be highlighted.
The complex interactions that happen in electricity markets de-mand a flexible computational environment where designs can be tested and sensitivities to power system and market rule changes can be explored [9]. Agent-based modeling has been extensively used in the literature to model electric systems [10–13]. The OPTI-MATE open platform is an example of an agent-based tool used in power systems. It can be used for evaluating and comparing vari-ous existing and potential new market designs in several regional European power markets [14]. Another example uses an agent based approach for evaluating the effects of the integration of flex-ible loads in the secondary reserve market [15]. Alternative tech-niques carrying quantitative analysis in power systems are based on the computation of market equilibria. For instance, the PRIMES model computes a market equilibrium solution in the European Union member states taking into consideration market economics, industry structure, energy/environmental policies and regulation [16]. Note that the references above are related to the wholesale energy market, whereas the present paper applies agent-based modeling to interaction models within distribution systems.
Several European projects study the interactions models to integrate flexibility services in the present electric system. The
ADDRESS project aims at developing a comprehensive commercial
and technical framework for the development of active demand in the smart grids of the future [17]. This project focuses on questions such as which information should be available for each actor or which reference consumption to choose. Other projects in Europe rely on the deployment of demand side management such as GREDOR [18], iPower [19], EvolvDSO [20], LINEAR [21], ADINE [22], Local Load Management [23], Nice Grid [24] and Optimate [25]. The testbed introduced in this paper is a convenient tool to test the ideas proposed in the previous projects.
The name of the testbed, DSIMA, stands for Distribution
Sys-tem Interaction Model Analysis. This testbed is a framework that
is composed of an instance generator, a simulator and a web-based user interface. These three modules allow various compro-mises between versatility and ease of modification. For instance, the behavior of an agent can easily be changed by changing its optimization problems written in the user-friendly modeling lan-guage ZIMPL, seeFig. 1for an example. More flexibility can be ob-tained by modifying the open-source Python 3 code available at the addresshttp://www.montefiore.ulg.ac.be/~dsima/. In this testbed, the network is modeled as a network flow model. This model only
considers active power flows and therefore cannot grasp voltage is-sues. The extension to an optimal power flow model over multiple time periods leads to non-linear and non-convex problems. These problems are computationally challenging, see [26] for a review of the current techniques to solve this kind of dynamic optimal power flows. Integrating OPF would make the testbed more complex to use, increase the computational power needed to perform the sim-ulations, and further increase the quantity of input data.
The paper is organized as follows. Section2presents the system studied and the roles that each agent can take. Five possibilities of interaction models are described in Section3. The agents of the system are described in Section4. This section refers extensively toAppendixcontaining the optimization problems characterizing the behavior of the agents. Section5describes the implementation of the testbed as a simulator, an instance generator and a user interface. Section6discusses the simulation results, and Section7 concludes.
2. General view of the system
Our analysis is focused on the short term operation of the medium-voltage (MV) network. In this time frame, active network management (ANM) consists in the coordination for the usage of flexibility to operate the distribution system [27]. In the scope of this paper, we consider the short-term flexibility exchanges in an operational planning phase. These exchanges are governed by the interaction model that the agents must follow.
In the sequel of this document, we make the distinction between the roles and the actors. The roles considered in this paper are balance responsible parties (BRP), flexibility services providers (FSP) and flexibility services users (FSU). The actors simulated in this paper are the DSO, the TSO, producers and retailers, and may fulfill more than one role, depending on the interaction model. To operate its network, the DSO may act as a FSU. The TSO is, from the point of view of this simulation, a FSU with given needs of flexibility services. Producers and retailers both act simultaneously as BRPs, FSPs and FSUs.
All of the interaction models we consider follow the procedure below.
1. DSO analysis and TSO imbalance settlement are based on reference baselines for every bus. On the day ahead, after the clearing of day-ahead energy market, BRPs submit their baselines to the DSO and the TSO.
2. The DSO assesses the state of the system and announces its flexibility needs to the FSPs. Other FSUs also announce their needs to the FSPs.
Fig. 2. Definition of access bounds.
3. FSPs provide flexibility offers sequentially to each potential FSU, the first FSU being the DSO.
4. FSUs contract some proposed flexibility offers for their needs. 5. Closer to real-time, FSUs request the activation of their
flexibility services.
6. Right before real-time, each FSP optimizes its realization taking into account the request of its FSUs, the penalty if a flexibility service is not provided and its imbalance with respect to the BRPs of the loads it controls.
7. The distribution network is operated using these realizations taking last resort actions if necessary, such as shedding buses. If such actions are needed and FSPs did not provide their service to the DSO, the FSPs are penalized at a regulated price. We assume that there is an access contract between a BRP a and the DSO for each bus n that the BRP has access to. A contract specifies a full access range
[
la,n,
La,n]
and a wider flexible accessrange
[
ka,n,
Ka,n]
, cf.Fig. 2. The BRP can produce or consumewith-out any restriction within the full access range
[
la,n,
La,n]
, but in theflexibility intervals
[
ka,n,
la,n]
and[
La,n,
Ka,n]
the DSO can order are-striction of the production or consumption, if necessary. In general, stakeholders are free to exchange flexibility services among them, but if the profile of a BRP is within the flexibility intervals, it has to propose flexibility offers to the DSO via FSPs.
The following subsections detail the information exchanged and action taken by an actor with a given role. The index a is used for an agent, n for a bus and t for a period. The set of buses considered by an agent a is denotedNaand is a subset of the total
set of busesN.
2.1. Balance responsible party
Each BRP is responsible for its local and global baseline and performs the following actions:
1. Submits its global baseline to the TSO. 2. Submits its local baselines to the DSO.
3. Notifies FSPs of the obligation to provide flexibility services, if the local baseline is not in the full access range.
4. Pays the TSO for its global imbalance.
5. Pays the DSO for the local imbalance, if a FSP for which the BRP is responsible did not provide a flexibility service.
The local baseline, pba,n,t, which is positive for a production and negative for a consumption, is provided on a day-ahead basis by the BRP a for each MV bus n and each period t to the DSO. The global baseline Pb
a,tis provided by the BRP to the TSO. For the sake
of clarity and conciseness, we consider that the BRP only has assets in the simulated system such that Pab,t
=
n∈Nap
b a,n,t.
The global imbalance of the BRP, Ia,t, is computed considering
the actual realization Pa,t, the total amount of flexibility activated
Ua,tand the flexibility provided Ha,t:
Ia,t
=
Pa,t−
(
Pab,t+
Ua,t+
Ha,t).
(1)The imbalance cost to the BRP is given by
t∈T(π
I+ t I + a,t+
π
I− t I − a,t)
(2)where Ia+,t and Ia−,t are equal, respectively, to the positive and negative part of the imbalance in period t
,
Ia,t.If the local baseline of the BRP, pba,n,t is within a flexibility interval such that ka,n
≤
pba,n,t<
la,nor La,n<
pba,n,t≤
Ka,n, theBRP notifies the concerned FSPs that they must provide flexibility services such that the realization pa,n,tcan be included in the full
access range
[
la,n,
La,n]
. Note that in order to ensure that the FSPcan propose such a service, it probably has to optimize by itself the whole baseline
{
pa,n,t|∀
t∈
T}
.The local information of the day-ahead baseline pb
a,n,tis used by
the DSO to operate its system. If requests to activate flexibility are not satisfied, the BRP responsible for these FSPs is penalized at a regulated price proportional to the volume
π
n:
t∈T
n∈Naπ
n|
(
pb a,n,t+
ua,n,t+
ha,n,t) −
pa,n,t|
(3)where pa,n,t is the local realization, ua,n,t the local flexibility
activated in period t and ha,n,tthe local flexibility provided.
2.2. Flexibility services provider and user
The main interactions that the FSP conducts are:
1. Obtains the flexibility needs of the FSUs, the baselines and the obligations from the BRPs of the assets it controls.
2. Proposes flexibility services.
3. Activates flexibility upon the request of the FSUs.
Flexibility services need a reference in order to be quantified. In this paper, we chose a baseline pa,n,tprovided by the BRP. Note
that if the FSP is its own BRP, the agent with the combined roles can optimize its baseline to maximize the flexibility it provides. The other data at the FSP’s disposal is an indicator of the flexibility needs in each bus and each period upward and downward. The latter indicator is provided by the FSUs to help the FSP to quantify the action it is able to perform.
A FSP offers a service i at a reservation price
π
ri and an activation
price
π
ib. We consider two types of flexibility services which are represented inFig. 3: a single period flexibility service, tailored, for instance, for curtailment offers of wind generation units, which defines a modulation range[
mi,τi,
Mi,τi]
available for a given periodτ
i; and energy constrained flexibility service which defines foreach period t, a modulation range
[
mi,t,
Mi,t]
. A user of the latterservice may choose the modulation for each period under the constraint that the average modulation is zero. This service is well tailored for load modulation because the energy procured to the load is preserved over the time horizon with respect to the baseline consumption.
In the last part, FSUs that have contracted some services provide their activation requests to the FSPs. The total desired modulation at bus n and period t is denoted by ha,n,t. The FSP controls its
assets to provide the desired modulation with respect to the precomputed baseline.
A FSU has three main interactions with the system.
1. Computes and communicates an indicator of its upward and downward flexibility needs in adjustable power for each bus and each period.
2. Evaluates the flexibility offers from the FSP and selects the services to contract.
3. Requests the activation of the contracted flexibility services. How the needs are defined, the offers are evaluated and the activation requested depends on the agent acting as FSU, cf. Section4. For instance, the DSO computes its flexibility needs to overcome anticipated congestions.
(a) Single period. (b) Energy constrained.
Fig. 3. Flexibility services implemented.
(a) Base data. (b) Unrestricted access.Models 1and5.
(c) Restrictive access.Model 2. (d) Flexible acces.Models 3and4.
Fig. 4. Definition of the access bounds for each interaction model.
3. Interaction models
The differences between interaction models originate from the usage the stakeholders make of flexibility services, from the remuneration and financial compensations associated with the flexibility services, and from the terms of access contracts delivered to the grid users. Access contracts define whether and to which extent the DSO could require flexibility from its grid-users. We consider that a FSP first makes a request to the DSO to get access to a range
[
ga,n,
Ga,n] :
ga,n≤
0≤
Ga,n. Based on theserequested access bounds, the DSO computes safe access bounds
[
ba,n,
Ba,n] :
ba,n≤
0≤
Ba,n. The safe access range ensures thatno congestion occurs if every grid user accesses the network in the limits
[
ba,n,
Ba,n]
. These bounds are represented inFig. 4. A morecomprehensive definition of this procedure is outside the scope of this paper. Section4.1presents one simple method adopted for the simulation.
Given the previous definitions, the five proposed interaction models governing flexibility exchanges with the DSO are detailed below. Stakeholders are free to exchange flexibility services among them, but in Models 3–5, if the profile of a BRP is within the flexibility intervals, it has to propose flexibility offers to the DSO via FSPs.
Model 1. The DSO does not use any flexibility service and does not
restrict grid users:
[
la,n,
La,n] = [
ka,n,
Ka,n] = [
ga,n,
Ga,n]
.Model 2. The DSO does not use any flexibility service and allows
grid users to produce or consume only in the safe access bounds:
[
la,n,
La,n] = [
ka,n,
Ka,n] = [
ba,n,
Ba,n]
.Model 3. The DSO sets
[
la,n,
La,n] = [
ba,n,
Ba,n]
for each agent butallows access in the range
[
ka,n,
Ka,n] = [
ga,n,
Ga,n]
. The grid usersmay be restrained to keep their production/consumption in the range
[
la,n,
La,n]
upon request of the DSO. This restriction does not lead tofinancial compensation by the DSO except for the imbalance created by the request.
Model 4. This model is equivalent toModel 3but the DSO pays for the activation of the flexibility of the grid users. For instance, this case allows producers to recover from the loss of the subsidies for green energy generation.
Model 5. The DSO does not oblige grid-users to provide flexibility,
i.e.
[
ka,n,
Ka,n] = [
la,n,
La,n] = [
ga,n,
Ga,n]
. The DSO can, however,contract flexibility like any FSU.
The purpose of this paper is to provide a detailed explanation of the platform to reproduce the results, but it also enables the definition of other interaction models and the completion of additional analyses. New interaction models can be easily defined using the following six parameters. More advanced modification can be carried out by modifying the open-source code.
1. Is the DSO a FSU? Define if the DSO uses flexibility services. The value is
false
forModels 1and2andtrue
forModels 3–5. 2. What is the cost at which the DSO buys flexibility? Differentoptions are implemented in this testbed. First, the DSO may pay the same cost that a TSO or a BRP would pay. Another alternative is that the DSO only pays for the imbalance caused by the activation of the flexibility. A third option defines lower costs for downward modulation services. These alternative costs are used inModels 1–5. The activation cost of downward modulation flexibility services is set to the energy price in the corresponding period minus the marginal cost of the producer, which is approximately the benefits of the producer. At the stage of flexibility offers, the producer has already sold its energy and since the distribution network does not have enough capacity to carry the energy, the DSO must pay the imbalance tariff by the activation of flexibility services. In this setting, the benefits of the producer are attributed to the DSO to reduce these imbalance costs.
3. What is the imbalance price paid by the DSO compared to BRPs? In all interaction models described previously, the imbalance tariff paid by the DSO is the same as any BRP. A preferential tariff could be applied to the DSO since it can notify the TSO in advance of the flexibility services activated and, therefore, the resulting imbalance.
4. Does the DSO restrict the grid users? Three restriction patterns are implemented: restrictive, flexible and unrestricted access. These patterns are represented inFig. 4.
5. What is the frequency of the access bound computation? Prior to the day by day simulation of the system, the DSO computes the access bounds
[
ba,n,
Ban]
to its system. If every actor ofFig. 5. Timeline of the interaction between the agents.
the system accesses to the network within these bounds, no further actions need to be taken by the DSO to ensure the secure operation of its network. In a real system, this procedure would not be performed in one round, since access contracts are delivered with a certain delay after they were requested. The aggregation of contracts of the low voltage contributors should also be considered. A more realistic simulation would, therefore, consider the legacy of access contracts. In the framework of this simulation, two possibilities are available: a computation based on the installed capacity and one based on the maximum values observed by the grid user on the time horizon of the simulation. The first option is more realistic but the second might be considered in the future to increase the freedom of the grid users. InModels 1–5, the option chosen is the computation based on the installed capacity.
4. Agents
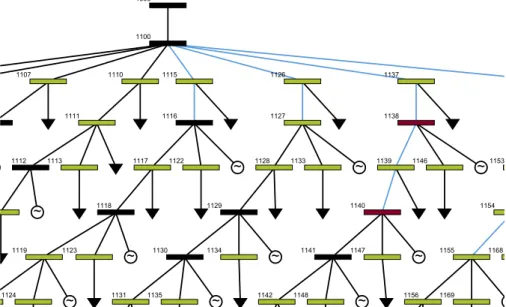
The agents simulated in this paper are the DSO, TSO, producers and retailers. They may fulfill more than one role depending on the interaction model. To operate its network, the DSO may act as a FSU, as inModel 5for instance. The TSO is, from the point of view of this simulation, a FSU with given needs of flexibility services. Producers and retailers both act simultaneously as BRPs, FSPs and FSUs. The complete optimization problems solved by the agents are provided in theAppendix. The global interactions between the actors are summarized in Fig. 5. The courses of the events are described from left to right going from short-term interactions to settlement. Each type of actor is represented by a horizontal line. Each vertical arrow represents an interaction between two types of actors. The actor on the heads of the arrow receives the information from the ones at the tails of the arrow indicated by the circles.
4.1. Distribution system operator
In our simulations, the DSO acts with the objective to reach the technical optimum of the system. Prior to the day by day simulation of the system, the DSO computes the access bounds
[
ba,n,
Ban]
to its system. If every actor of the system accesses to the network within these bounds, no further actions need to be takenby the DSO to ensure the secure operation of its network. These bounds are obtained by solving the optimization problem(5).
Next, the DSO acts as a FSU. Taking as input the baselines provided by the BRPs and the characteristics of the network, the DSO provides an indicator of its flexibility needs in MW for each bus and each period in order to alleviate congestion in the lines. These needs are obtained by solving problem(6).
For the flexibility procurement, the DSO solves problem (7). Note that even though the DSO is not a BRP, it pays imbalance fees caused by its usage of flexibility. This incentivizes the DSO to activate, when it uses one flexibility service downward to alleviate a congestion, to use another one upward to restore the balance.
The flexibility activation optimization problem is identical to(7) except that it considers only the contracted flexibility services and their activation costs. Note that as we use a deterministic simula-tion, nothing changes between the reservation phase and the acti-vation phase. As a result, the decisions taken in the actiacti-vation phase are identical to the ones foreseen in the reservation phase.
Finally, we opt for a simple real-time system control strategy based on the realizations of the agents, which mimics a protection scheme. If the flow in some lines is over their thermal capacity, the DSO sheds production or consumption according to the optimization problem(8).
4.2. Producer and retailer
A producer is a BRP, FSU and FSP. In order, a producer announces its baselines, requests flexibility services, offers flexibility services, buys and activates flexibility services, and finally regulates its balance. A retailer is an actor which retails energy to its customers and manages aggregated loads at the MV level. It fulfills the same roles as the producer and, therefore, follows exactly the same steps. For the sake of conciseness, we only detail the producer. The specific optimization problems of the retailer(13),(14),(16)and (17), are given in theAppendix.
The baselines of the producer are obtained by solving the optimization problem (9). In this stage, the producer already considers the possibility to be in imbalance considering the expected imbalance price. The problem takes as parameters the total upward and downward flexibility needs for each bus and
Table 1
Parameters of an interaction model.
Parameter Description
DSOIsFSU DSO is a FSU.
Value:TrueorFalse.
DSOFlexCost Sets the cost at which the DSO buys flexibility.
Value:imbalance,normalorfull.
DSOImbalancePriceRatio Ratio of the imbalance price that is paid by the DSO with respect to the one paid by BRPs.
Value: Number, default value is 1.0.
accessRestriction Restricted access to the DSO network following the access agreement step of the DSO.
Value:none,conservativeorflexible accessBoundsComputation Access bounds computation type.
Value:horizonorinstalled.
each period. These parameters could come from forecasts of the producer or FSUs. The first approach is utilized in this paper, where the forecast is based on the flexibility needs communicated by the FSU in the previous days. Note that the real needs of the flexibility users are communicated after the baselines are obtained according to the interaction models.
Once the producer is notified of the acceptance of its offers on the day-ahead energy market, it optimizes the flexibility it is able to provide with respect to the announced baseline. This step is modeled by the optimization problem(10). The producer procures and activates flexibility services based on the solution of problem (11).
Finally, the producer decides on the actual realizations for each bus and each period by solving problem(12) considering as a parameter the flexibility activation requests as a FSP and its flexibility requests as a FSU. The producer minimizes its imbalance in each period and also ensures that the realization in the bus in which it should deliver a flexibility service is equal to the expected value. The local imbalance is penalized at a regulated price.
4.3. Transmission system operator
The TSO is a pure FSU in this simulation. Its flexibility needs are taken as data and are not localized. Any FSP may, in principle, provide flexibility offers to the TSO. The flexibility contracted by the TSO is computed by optimization problem(18). Since the TSO can procure flexibility outside the distribution system, the surplus of this stage is taken as the amount of flexibility collected in this network weighted by a price representing the system benefits of contracting reserve into the considered distribution network.
When the TSO decides to activate flexibility services, the TSO solves an imbalance external to the considered distribution system. Note that the imbalance coming from the considered distribution system should not be solved by local flexibility services to avoid counterbalancing DSO actions. The benefits of the TSO coming from the activation of flexibility services in this part of the network are computed by optimization problem(19).
4.4. Flexibility platform
The flexibility platform is an intermediary between FSUs and FSPs. This platform could be operated either by a DSO, a TSO or an independent party. One could implement interaction models without a flexibility platform where FSUs and FSPs directly exchange their services. The flexibility platform facilitates the interaction and can anonymize the flexibility exchanges. Note that a pure market based platform would probably not be a good alternative due to the lack of liquidity as these services are highly dependent on the location.
In our settings, the flexibility platform collects the flexibility needs of the FSUs and communicates them to the FSPs. FSPs submit their offers to the platform which sequentially proposes them to the DSO, TSO and finally to other FSUs as depicted inFig. 5. As the
DSO solves local problems such as congestions, its needs can be satisfied by fewer services than the imbalance problems faced by the TSO or BRPs. This motivates the priority given to the DSO, but other rankings could be investigated.
5. Implementation
The testbed is divided into three parts: the simulator, an instance generator and a user interface. The first two are implemented in Python 3. The user interface is composed of a client in HTML5-Javascript and a server in Python 3 which facilitates the use of the generator and the simulator, and provides an interface to visualize the results.
5.1. Simulator
The simulator takes as input the parameters of all agents on the simulated horizon, i.e. one day. A one year simulation can be performed by simulating each day independently. All of the parameters of the optimization problems given in theAppendix should be provided by CSV files. A self detailed example is given in the implementation. An additional CSV file contains the parameters of the interaction model which are listed inTable 1. The specific combination of the parameters ofTable 1to obtain the models of Section3is encoded in the user interface of Section5.3. Based on all of the parameters, the simulator performs the simulation of one time horizon, e.g. one day. The simulation requires solving the optimization problems of the actors, which are encoded in ZIMPL and solved using the SCIP solver [28]. To conduct the simulation, some agents need predictions of some parameters such as the flexibility needs of the FSU (see Section4.2for more details). The simulation is initiated with these predictions set to zero. If the realizations do not match the predictions after one run, the simulation is reinitialized with the new realization. This process is repeated until the realizations match the predictions or after a predetermined number of iterations.
5.2. Instance generator
The instance generator allows a user to create an instance from high-level parameters instead of having to specify manually the assets of each agent. The reduced set of parameters is given in Table 2 to which we add the interaction model parameters of Table 1.
The instance generator takes as its basis, a network. The networks already integrated are given in Fig. 6. The ratio of installed production and consumption with respect to the one of the whole network is given along with their topology. We now detail the generation of the CSV parameter files for the simulator.
Generation of the producers. The producers are generated from
the data of a wind farm in 2013 scaled to the input mean and maximum production in the network. Each bus with production in the selected network is assigned randomly to one producer. The
Table 2
Parameters of the instance generator.
Parameter Type
Title of the instance String
Network Network name, seeFig. 6
Total production Mean and maximum value in MW
Production cost Price ine/MWh
Total consumption Mean and maximum value in MW
Retailing price Price ine/MWh
Energy price Mean and maximum value ine/MWh
Days of simulation Start and end day in{1, . . . ,365}
Interaction model parameters SeeTable 1
Number of periods by day Integer
Number of producers and retailers Integer
External imbalances of the producers and retailers Percentage of their total volume Retailers flexibility reservation cost Price ine/MWh
TSO flexibility needs Volume in MW
TSO reservation price Price ine/MWh
(a) Six buses example network. (b) 75 bus network from [29].
(c) Ylpic network.
Fig. 6. Networks available.
maximum production for each period is set to the scaled baseline value times the contribution of the bus with respect to the total production in the network. The minimum production is the latter value minus the flexibility of the producer. The external imbalance of the producer is generated uniformly between plus and minus its mean production.
Generation of the retailers. The consumption curve is built from the
Belgian total load consumption of 2013 [30]. The share of each retailer is randomly generated so that the shares sum up to one. The mean baseline consumption of a retailer in one bus is the total consumption curve times the retailer’s share and the ratio of the consumption with respect to the one of the total network. The sum in each period of the horizon of mean consumption provides the total energy to consume Va,n. The minimum and
maximum realization bounds, pmin
a,n,t and pmaxa,n,t, are given by the
mean consumption plus and minus the consumption flexibility.
Generation of the price curves. The prices are generated by scaling
concurrently the Belpex day-ahead energy market prices [31] and the Belgian imbalance tariffs of 2013 [30]. To ensure the coherence of the input parameters of the simulator, the generator sets the minimum imbalance tariff to the energy prices. If it was not done, an agent could sell energy to the market without producing and still get benefits from this controversial action.
Generation of the TSO. The flexibility needs of the TSO, R−t and
R+t, are constant values given as input parameters. The external imbalance that the TSO faces in each period is randomly generated following a uniform distribution between
−
R−t and R+t.(a) Homepage with the parameters of the instance. (b) Global results for the simulated horizon.
(c) Daily results. Each bus and line can be clicked on to display its specific information.
Fig. 7. Screenshots of the user interface.
Generation of the flexibility potential indicators. To operate its
system, the DSO needs an indication on where flexibility can be obtained in its network. This information could, for instance, come from access contracts or notification from the FSUs willing to sell their services to the DSO. In this testbed, the knowledge of potential availability of flexibility services is taken as a parameter in optimization problem(6)which allows the DSO to communicate its flexibility needs to the FSU based on the baselines of the BRPs. The indicators of upward and downward flexibility availability for each bus, respectively
α
+n and
α
−
n
∈ [
0, +∞[
are dimensionlessparameters. A 0 indicator indicates that no flexibility is available while a large value indicates that a large amount of flexibility can potentially be contracted in the bus with respect to the others.
In the instance generator, these indicators are arbitrarily computed by the following procedure. First, the generator computes the installed flexible production and consumption in each bus in terms of power. We denote them respectively
κ
+∈
[
0, +∞[
MW andκ
−∈] − ∞
,
0]
MW. Second, these data are usedto define the indicators:
α
+ n=
1κ
+/
10−
κ
−/
10 (4a)α
− n=
1κ
+/
1−
κ
−/
10 (4b)where the numeric coefficient gives more importance to down-ward flexibility by the production side.
5.3. User interface
The user interface simplifies the access to the instance generator described in Section5.2and the simulator of Section5.1. Screenshots of the interface are given inFig. 7. The home screen, shown in Fig. 7(a), allows the creation of an instance via the generator giving it parameters such as the interaction model or the total production in the network. The global results screen, seen
inFig. 7(b), provides a summary of the simulation results of an instance and graphs to see the evolution of the welfare or DSO costs day by day. Daily results can be seen in the screen ofFig. 7(c). The state of the network in each period is represented and specific results to each bus and line can be obtained by clicking on it in the network picture.
The webpage includes a Javascript client communicating with a Python server which can either be on the same computer or a different one. The server handles the requests of the user and executes the instance generator or simulator. Note that the server can handle multiple clients at the same time, queuing the simulation requests, if needed. The simulations of multiple days are performed efficiently by assigning the simulation of each day to a different thread.
6. Results
The test case for the results is described in Section6.1. A typical one-day run is presented for one interaction model in Section6.2. Finally, the comparison of the five interaction models over one year is presented in Section6.3. The experiments are carried out on a computer equipped with an Intel Core i7-3770 CPU at 3.40 GHz with 32 GB of RAM. The optimization problems are solved with SCIP [28].
6.1. Test case
The interaction models are tested on a generic 11 kV distribution network composed of 75 buses and hosting 22 distributed generation units [29]. The network topology is fixed. The simulation is run for a time horizon of one day divided into 24 periods. Production data of the 22 generation units are taken from a production curve of 2013 scaled such that the maximum production reaches 64.2 MW and the mean production is 16 MW. Distributed generation units are clustered into three portfolios,
(a) A bus is colored in green if flexibility is used locally for at least one period of the simulation horizon. Similarly, a bus is colored in red when shedding occurs, and a line is colored in blue when a thermal limit is reached.
(b) Total flexibility activated and imbalance for all agents in the system.
Fig. 8. Typical run on the test system. (For interpretation of the references to color in this figure legend, the reader is referred to the web version of this article.)
each managed by a different producer. The producers only ask for a remuneration of the activation of their flexibility services. The consumption of the 53 connected loads is built from the Belgian total load consumption of 2013 scaled to a mean of 10.8 MW and a maximum of 21 MW [30]. This consumption is divided into three parts, each belonging to one retailer. The consumption of a retailer is divided into a static part and a flexible part respectively, accounting for 80% and 20% of the total consumption of the load. The retailer proposes its flexibility with no activation fee but requires a reservation fee. The reservation fee of a demand side flexibility offer is assumed to be 5e/MWh. The TSO flexibility aims to contract a volume of flexibility equal to 2% of the total installed production capacity of the system in each period. We use the following reservation prices of secondary reserve:
π
S+t
=
−
π
tS−=
45e/MWh. The total activation request of the TSO is drawn using a zero mean Gaussian distribution with a variance equal to the target flexibility volume of the TSO. Energy prices are taken from the clearing of 2013 of the Belpex day-ahead energy market [31] scaled to a mean of 53.64e/MWh and a maximum of 93.03e/MWh, excluding the extreme 2.5% of the original data. The value of lost load taken into account in the case of shedding due to the tripping of a protection is set to 500e/MWh for the production and 1000e/MWh for the consumption. The imbalance prices come from the Belgian TSO [30]. A FSP not providing acontracted flexibility service or violating its dynamic range is penalized at 150% of the maximum imbalance price.
6.2. Typical run
We first provide illustrative results forModel 4applied to the test system based on the data of July 10, 2013.Fig. 8(a) illustrates the events happening in the course of the simulation. Shedding an MV bus disconnects only the devices connected to that bus, and does not impact the surrounding MV buses of the system. The maximum flow injected in the transmission network is 44.1 MW at period 20. The DSO sheds a total of 12.6 of the 913.44 MWh of generation potential, and activates 11.57 MWh of flexibility, on a total of 17.8 MWh, which causes an equal imbalance volume. The total imbalance, i.e. the sum of the imbalances over all agents in the system, is 25.8 MWh. The total flexibility activated as well as the imbalance of all agents in the system is given inFig. 8(b). The total welfare of the system is 32107e. The total DSO cost is 823eand does not consider remuneration for the shed quantities. However, the value of lost load and the value of lost production are taken into account in the welfare value. The total benefit of all retailers is 3340e. Benefits earned by the producers sum up to 29455e. The TSO obtains a welfare of 1400efrom the services acquired in the system. A one day simulation lasts 312 s.
Table 3 Comparison of the interaction models on one year. Model 1 Model 2 Model 3 Model 4 Model 5 Units min mean max min mean max min mean max min mean max min mean max Welfare − 162,550 29,077 121,971 − 7,727 27,411 6,8434 − 7,727 39,868 14,5420 − 7,727 39,692 146,987 − 7,727 39,665 146,793 e Shedding costs 0 12,071 248,409 0 0 0 0 914 19,340 0 1077 23,969 0 1103 23,382 e DSOs costs 0 0 0 0 0 0 0 443.9 10935.8 0 655.7 16493.8 0 655.7 16493.8 e TSOs surplus 832 2,878 3,850 832 2,878 3,850 832 2,874 3,850 832 2,873 3,850 832 2,873 3,850 e Producers surplus 0 37,743 162,939 0 24,005 68,265 0 37,825 164,104 0 38,024 164,160 0 38,023 164,117 e Retailers surplus − 14,750 527 9,852 − 14,750 527 9,852 − 14,750 528 9,852 − 14,750 528 9,852 − 14,750 528 9,852 e Total production 0 379.05 1294.54 0 247.33 622.26 0 387.07 1372.25 0 386.74 1371.54 0 386.69 1371.54 MWh Total consumption − 489.93 − 257.08 − 39.95 − 489.93 − 257.07 − 39.95 − 489.93 − 257.08 − 39.95 − 489.93 − 257.08 − 39.95 − 489.93 − 257.08 − 39.95 MWh Total imbalance 0.15 25.56 501.51 0.15 1.4 5.11 0.15 17.51 381.82 0.15 17.83 402.43 0.15 17.88 409.18 MWh Max. imbalance − 34.82 − 3.12 0.3 − 0.6 − 0.13 0.3 − 24.14 − 2.44 0.3 − 33.42 − 2.52 0.3 − 32.65 − 2.53 0.3 MW Total usage of flex. 0 14.93 65.1 0 14.94 65.1 0 29.44 380.42 0 29.39 380.42 0 29.4 380.42 MWh Total energy shed 0 24.14 496.82 0 0 0 0 1.83 38.68 0 2.15 47.94 0 2.21 46.76 MWh
6.3. Comparison of the interaction models
All of the models are simulated under the same conditions for 365 days individually, which amounts to 32 h of simulation by model. The main results are reported inTable 3.
Model 1highlights that leaving the network with no control leads to high shedding and impacts the welfare with a penalty of about 12,000eby day. OnlyModel 2yields no shedding but a lower welfare due to the conservative actions of the DSO to restrict the access of production units. This conservative strategy penalizes the producers which are not allowed to produce in situations where the network can handle higher injections. Using ANM strategies as it is proposed inModels 3–5, leads to equivalent and higher welfares even with average shedding penalties of 1000e per day. These models would be more efficient if shedding could be avoided. This necessity is caused by the activation of flexibility services by the TSO in an opposite direction to the directives of the DSO. The DSO activates flexibility services based on the baselines so that once the services are activated, congestion no longer occurs. However, the actual realization differs from the expectation since the DSO as it is not the only user of use flexibility services. A better coordination between the DSO and other FSUs would lead to even higher welfare and is necessary to ensure the safety of the system over the long term.
Only the TSO uses demand side flexibility in this simulation. Even though flexibility services from the demand side are cheaper, their usage is expensive for the DSO which must compensate the imbalance created to solve a congestion problem. In addition, an activation of an energy constrained flexibility offer in one period requires another activation in a different period and, therefore, up to a double imbalance compensation. A variant of these interaction models could allow a discount for the DSO on the imbalance tariff. Table 4compares the surpluses of the producers in the last four interaction models with respect to the first one. These results show thatModel 2significantly decreases the surplus of each producer. The smallest producer is the most sensitive to the choice of the interaction model but still the difference between Models 3–5 on its surplus is of the order of 1%. The two other producers are less impacted by the ANM interaction models. This result may motivate producers to bargain their flexibility for free, as long as the imbalance is paid, in order to obtain an increased access to the distribution network.
7. Conclusion
This paper proposes the open-source testbed DSIMA built to analyze quantitatively interaction models for the exchange of flexibility within distribution networks. The testbed simulates the interactions of the DSO, the TSO, producers and retailers in a medium-voltage distribution network. The simulation is per-formed in an agent based framework where each agent maximizes its individual objective. The testbed is composed of an instance generator, a simulator and a web-based user interface written in Python and HTML5/Javascript. These three modules allow various compromises between flexibility and ease of modification.
This paper completely formalizes the interactions between the stakeholders of a distribution system and all the interaction models. Our analysis of the simulation results tends to show that the active network management based interaction models lead to the larger welfare. However, these models, in their current version, cannot guarantee the operation of the network without shedding due to the lack of coordination between the DSO and the TSO. Restricting grid users to an access range computed ahead of time to prevent any congestion is the only option out of the proposed models to avoid shedding. The conservative interaction model is shown to penalize some producers more
than others, raising the question of fairness of access range allocation and flexibility activation. However, results show that in the ANM models, producers may have an incentive to bargain their flexibility for free, as long as the imbalance is paid, in order to obtain an increased access to the distribution network. Introducing a coordination mechanism to ensure a globally coherent activation of the flexibility would, therefore, lead to an interaction model with the largest welfare while avoiding shedding.
The work presented in this paper could be extended along several lines. In the proposed interaction models, the BRP is responsible of providing baselines for every medium-voltage bus. However, several stakeholders may forecast these references: the DSO, FSPs, BRPs, etc. and these choices should be further inves-tigated by implementing them in this testbed. Additional imple-mentation could add new interaction models or flexibility services. One could also refine the modeling level, for instance, considering alternating current power flow equations or alternative agent be-haviors. The open-source code needed to continue this work can be found at the addresshttp://www.montefiore.ulg.ac.be/~dsima/. Acknowledgments
This research was supported by the public service of Wallonia— Department of Energy and Sustainable Building, within the framework of the GREDOR project.
Appendix. Optimization problems of the agents
A.1. Nomenclature
In the following of the section the letters a
,
i,
t and n indexagents, flexibility services, time periods, and buses, respectively. Superscripts+and−depict an upward or a downward modulation.
Parameters
α
n Flexibility potential indicatorA Set of agents
Cn,m Capacity of the line
(
n,
m)
ca,n,t Marginal cost of producer units
dn Flexibility potential indicator
Ea,t External imbalance to the system
[
ba,n,
Ba,n]
Safe access bounds to the network[
ga,n,
Ga,n]
Requested access bounds to the networkN Total set of buses
Na Set of buses of agent a
N
(
n)
Set of neighbors of bus n[
pmina,n,t
,
pmaxa,n,t]
Minimum and maximum realizationπ
Et Energy marginal price
π
It Imbalance marginal price
π
St Reservation price of secondary reserve
π
l Penalty for a local imbalanceπ
ri Reservation price of a flexibility service
π
bi Activation price of a flexibility service
π
fa Retailing price
π
VSP Value of shed productionπ
VSC Value of shed consumptionT Set of periods
Va,n Total energy needs over the horizon
Variables
[
ba,n,
Ba,n]
Safe access bounds to the networkBa Set of buses where the agent is responsible for its local
Table 4
Comparison of the annual surpluses of the producers with respect toModel 1.
Model 1 Model 2 Model 3 Model 4 Model 5
Producer 1 20,647e −34.97 −0.09 0.43 0.52 %
Producer 2 3,287e −44.70 3.06 4.26 3.66 %
Producer 3 13,809e −36.56 −0.01 0.38 0.37 %
En Set of energy constrained flexibility offers
∆a,n,t Total flexibility offered by the FSP
ha,n,t Total requested modulation to the FSP
Ia,t Imbalance of an agent
It Total imbalance of the system
fn1,n2,t Active power flow in line
(
n1,
n2)
[
ka,n,
Ka,n]
Flexible access range of a FSP[
la,n,
La,n]
Full access range of a FSP[
mi,t,
Mi,t]
Modulation range of the flexibility servicepba,n,t Day-ahead baseline of an agent
Pb
n,t Aggregated day-ahead baseline of the agents
pa,n,t Realization of an agent
Pn,t Aggregated realization of the agents
ra,n,t Flexibility needs indicator
Sn Set of single period flexibility offers
Rt Flexibility activation needs of the TSO
St Flexibility contracted by the TSO
ua,n,t Total requested modulation by the FSU
v
a,i Modulation of flexibility service i∈
Sn[
w
a,i,
Wa,i]
Requested modulation range of flexibility service i∈
En
xa,i,t Modulation of the flexibility service i
∈
Enya,i Binary variable for the reservation of flexibility service
i
∈
Enzn,t Binary variable equal to 1, if the bus is shed
A.2. Optimization problems of the distribution system operator Access agreement. Optimization problem solved to obtain the safe
access interval
[
ba,n,
Ba,n]
from the access request[
ga,n,
Ga,n]
.The objective minimizes the maximum relative access restriction downward and upward,
δ
gandδ
G, subject to the operational limitsof the system, here the line capacities only. Worst case conditions are considered through the auxiliary variables f
n,mand fn,m. The
first case corresponds to no production and the consumption at its maximal allowed value for each agent and each bus, ba,n. The
second is equivalent to a case where there is no consumption and all production is at its maximum bound Ba,n.
min
δ
g+
δ
G (5a) subject to,∀
n,
m∈
N2,−
Cn,m≤
fn,m,
fn,m≤
Cn,m (5b)∀
n∈
N
a∈A(n) ba,n=
m∈N(n) f n,m (5c)
a∈A(n) Ba,n=
m∈N(n) fn,m (5d)∀
n∈
N,
a∈
A(
n)
δ
g≥
(
ga,n−
ba,n)/
ga,n (5e)δ
G≥
(
Ga,n−
Ba,n)/
Ga,n (5f) ga,n≤
ba,n≤
0≤
Ba,n≤
Ga,n.
(5g)Announcement of the flexibility needs. The flexibility needs of the
DSO in MW, rDSO+ ,n,tand rDSO− ,n,tare obtained by solving min
n∈N
α
+ n,tr + DSO,n,t+
α
− n,tr − DSO,n,t
(6a) subject to,−
Cn,m≤
fn,m,t≤
Cn,m∀
n,
m∈
N2 (6b)
a∈A pba,n,t+
rDSO+ ,n,t−
rDSO− ,n,t=
m∈N(n) fn,m,t∀
n∈
N (6c) rDSO+ ,n,t,
rDSO− ,n,t≥
0∀
n∈
N.
(6d)The positive parameters
α
+n and
α
−
n characterize the flexibility
potential at each bus and are obtained from the DSO knowledge of the system. In the implementation, these parameters are provided by the instance generator.
Flexibility procurement and activation. The DSO can procure a subset
of the proposed single period flexibility offers, Sn, and energy
constrained flexibility offers En. Let
v
a,i be the variable for themodulation of the single period flexibility service i and
[
w
a,i,
Wa,i]
the requested reservation range. Let x+a,i,t
,
x−a,i,t≥
0 be the variables for the upward and downward activation of the energy constrained flexibility service i∈
E. Note that an energy constraint bid cannot be partially contracted which is ensured by the binary variable ya,i.min
i∈Sn
π
ri
(
WDSO,i−
w
DSO,i) + π
ibv
DSO,i
+
i∈En
π
r iyDSO,i+
π
ib(
x + DSO,i,t+
x − DSO,i,t)
+
t∈T
n∈N zn,t
π
VSPmax{
0,
pb a,n,t} +
π
VSCmin{
0,
pb a,n,t}
+
t∈T(π
I+ t I + DSO,t+
π
I− t I − DSO,t)
(7a) subject to−
Cn,m≤
fn,m,t≤
Cn,m∀
n,
m∈
N2 (7b)(
1−
zn,t)
a∈A pba,n,t+
uDSO,n,t=
m∈N(n) fn,m,t∀
n∈
N,
t∈
T (7c) uDSO,n,t=
i∈Sn:τi=tv
DSO,i+
i∈En x+DSO,i,t−
x−DSO,i,t∀
n∈
N,
t∈
T (7d)mi
≤
w
DSO,i≤
v
DSO,i≤
WDSO,i≤
Mi∀
n∈
N,
i∈
Sn(7e) mi,tyDSO,i