Analysis of Risk Premium Behavior in the Tunisian Foreign Exchange Market
During Crisis Period
Sonia Kouki B. Lakhal*, Jamel Eddine Chichti
RIM-RAF Research Unit, Ecole Superieure de Commerce, University of Manouba, Tunisia, [email protected]
Abstract
In this paper, we empirically examine time-varying risk premiums in the Tunisian foreign exchange market by applying GARCH-M modeling to the TND/Euro and TND/USD parities for 1 to 12 months forecasting horizons. Our ultimate objective is to help better manage the parities and to help provide stability to a foreign exchange market where EMH is very weak. Our findings show 1) a heteroscedasticity of residuals for the TND/Euro (for all forecasting horizons) and the TND/USD (for 1 month) indicating an instability; 2) a non-significant standard deviation of the risk premium against the presence of ARCH and GACH in all cases. On the other hand, the descriptive analysis of risk premium and forward premium variables shows an asymmetric distribution. We used, therefore, the asymmetric GARCH model, E-GARCH. Our normality tests indicate that GARCH neither allows for residuals smoothing nor improves the AIC.
Keywords: Risk premium, Forward premium, Estimation, TND/Euro, TND/USD, CARCH-M, E-GARCH
Analyse du Comportement de La Prime de Risque Sur le Marché des Changes
Tunisien en Périodes de Crises
Résumé
Dans le cadre de ce travail de recherche, une modélisation GARCH-M a été appliquée pour les parités TND/Euro et TND/USD pour les horizons de prévision de 1 à 12 mois dans le but de mieux la maitriser et assurer une certaine stabilité du marché des changes tunisien où l’EHMC n’est pas retenue. Notre modélisation a permis de faire ressortir deux types de résultats : 1) une hétéroscédasticité des résidus impliquant une instabilité pour la TND/Euro (tous les horizons) et la TND/USD (1 mois) ; 2) une déviation standard de la prime de risque non significative contre une présence d’effets ARCH et GARCH pour toutes les situations envisagées. Or, l’analyse descriptive des variables objet de l’estimation (prime de risque et prime à terme) a permis de détecter une asymétrie des distributions d’où la nécessité de l’application d’un modèle GARCH asymétrique tel que le E-GARCH. En effet, les résultats fournis par les tests de normalité ont montré que le modèle E-GARCH ne permet pas toujours le lissage des résidus en plus d’un critère AIC du modèle non toujours retenu.
Mots clés : Prime de risque, Prime à terme, Modélisation, TND/Euro, TND/USD, GARCH-M, E-GARCH
1. Introduction
Agents behavior in a speculative market, such as stocks, commodity, and exchange, is subjective. Hence, classical economic models are often unsuitable for recent unstable and constantly changing financial markets. Assuming that agents are exceptionally qualified and extremely well informed, they would be able to properly anticipate future demand and supply functions. However, multiple unpredictable events, namely international financial crises, oil market fluctuations, and geopolitical crises, greatly affect foreign exchange market stability indicators. Such conditions favor the rejection of the efficient market hypothesis (EMH) that was proposed by Fama (1965).
An inefficient market indicates a disparity between spot and forward rates that is due to bias. Despite extensive empirical investigation, conclusive evidence of the real nature of bias has been subject to disagreement. Bilson (1981) and Miah (2018) argue that the dispersion of expectations tends to increase with the forecast horizon. On the other hand, Fama (1984), Hodrick and Srivastava (1984), Dos Santos (2016) and Kumar (2018) suggest that operators are rational and that they don’t make any anticipation mistakes. Hence, the forward rate is not an appropriate predictor of the future spot rate. The bias is, therefore, a time-varying risk premium (Benigno et al. 2011, Verdelhan, 2010, Engel, 2012, and Djeutem, 2014).
Rejection of the EMH due to time-varying risk premium has important implications for investors and policy makers. For instance, investors would require a risk premium in order to compensate for their risk aversion, and central banks would intervene to correct mispricing. Hence, time-varying risk premium analysis is of interest to researchers seeking to understand exchange rates behavior, investors who need to assess their portfolio and who are concerned about market inefficiencies, and policy makers who seek to ensure exchange rates stability.
The motivation of this study is two-fold. First, to our knowledge, no previous study has been undertaken to investigate time-varying risk premium in the Tunisian foreign exchange market. Second, this study seeks to model time-varying risk premium using two state-space models, GARCH-M and E-GARCH. Thus, this study aims to provide a better understanding of time-varying risk premiums that are essential to help determine the appropriate exchange rate during a financial crisis period. It also aims to provide a reference work for understanding challenges affecting emerging markets in their pursuit for an efficient exchange market.
The remainder of this paper is organized as follows. Section 2 provides an overview of the Tunisian foreign exchange market. Section 3 reviews the literature on risk premium in the foreign exchange market. Section 4 discusses the methodology employed for empirical analysis. Section 5 reports and discusses the empirical results of tests for modeling time varying risk premium in the Tunisian foreign exchange market. Section 6 elaborates on some practical implications of our findings. Section 7, summarizes and concludes the research. It also suggests some future research directions.
2.
The Tunisian foreign exchange market: an overview
With the collapse of the Bretton Wood agreement, the fixed parity system has been abandoned for a flexible system. The Tunisian dinar transitioned from a fixed system where 1 TND= 2,11588 grams of fine gold to a pegged exchange rate where 10 FRF= 0.94523 TND. The fixed parity period was characterized by very restrictive regulations that controlled domestic capital movements following their massive outflow. The implementation of pegged exchange rates, however, helped slow down capital flight.
On an international level, main currencies’ rates largely fluctuated due to market mechanisms. Central banks sought, therefore, to alleviate short term fluctuations. In order to guarantee the dinar’s stability, Tunisia opted for determining its exchange rate in function of a three then a seven-currency basket (Central Bank of Tunisia, 1999). This progressive policy allowed the Tunisian dinar to be relatively stable. In 1989, Tunisian policy makers allowed for the introduction of a new hedging
instrument: the foreign exchange currency contract. The Central Bank of Tunisia (CBoT) is the authority that is responsible for determining daily option premiums (Central Bank of Tunisia, 1999). In 1992, Tunisia introduced current account convertibility of the Tunisian dinar in order to facilitate Tunisian business integration in the global economy. Two years later, this convertibility was consolidated by the creation of spot interbank market to which a forward market has been added in 1997.
Due to the events that affected both benchmark currencies during the 2000-2001 period, the TND appreciated against the EURO and depreciated against the USD due to the USD’s devaluation against the Euro. During a subsequent period (2001-2002), the TND depreciated against the USD, the debt and investment currency, as well as the Euro to a lesser extent. The strong devaluation of the American dollar against the Euro during the 2007-2008 period resulted in a depreciation of the Tunisian Dinar against the USD to support exports and improve the TND’s coverage rate. It also resulted in the appreciation of the Dinar against the Euro, which resulted in lower exports and higher imports.
3. Literature review
The dominant viewpoint that emerged from research in the 1980’s is that the foreign exchange rate bias is a time-varying risk premium (Fama, 1984). The following equation was typically used as a starting point for the analysis of foreign exchange market efficiency and for exploring the existence of a risk premium:
𝑠 − 𝑠 = 𝛼 + 𝛽(𝑓 − 𝑠 ) + 𝜀 (1) Where 𝑠 − 𝑠 : Forecast error
𝑓 − 𝑠 : forward premium 𝜀 : error term
𝛼 and : parameters of the equation and H0: 𝛼 = 0 and =1
Most previous studies rejected the null hypothesis H0 whenever values are either close to zero or
negative (see for instance Fama, 1984, Hodrick and Srivastava, 1984, Dos Santos, 2016, Stocic et al., 2016, and Kumar, 2018). Even though they all concluded that there is a bias between forward rates and the corresponding future spot rates, they disagreed on whether the bias is a forecasting error or a risk premium. Proponents of the risk premium approach suggested that operators are rational and that they don’t make any anticipation mistakes (see Fama, 1984, Hodrick and Srivastava, 1984, Benigno et al. 2011, Engel, 2012, Djeutem, 2014 and Katusiime et al., 2015). Hence, the present spot rate is a better predictor of the future spot rate than the forward rate. The bias is, therefore, a time-varying risk premium.
With the confirmation of a time-varying risk premium, research has been focused on estimating the risk premium using one of two alternatives. The first alternative is economic modeling using the Computable General Equilibrium (CGE) model initiated by Lucas (1978-1982). It was later used by Engel (1992) who linked the risk premium to the increase in uncertainty and, hence, the risk aversion on the market that significantly affects economic activity (Kohler 2010). Some studies, however, concluded that CGE models do not allow the forecast of unexpected events on the market, even though they are used in macro-economic modeling (De Grauwe, 2010, Bertasiute, et al., 2018).
The second alternative for estimating risk premiums is econometric modeling based on data used in time series models (Sarno and Taylor, 2002, and Vural, 2018). Studies that successfully used econometric modeling were able to identify the predictable component of excess revenue in a foreign exchange transaction (Bailey and Chan, 1993, Kumar, 2018).
Bailey and Chan (1993) and De Oliveira (2019) are among many who applied econometric modeling. They asserted that most econometric models that estimated the risk premium used financial data, fundamental microcosmic variables, and regression equations. Financial analysts, however, faced challenges such as data availability and the ability to determine the reduced form equation derived from strong hypotheses. They, therefore, opted for arbitrary specifications. In order to avoid similar confusion, we suggest using state-space models.
State space models are, by definition, tools that detect signals. They use state variables to describe a system using linear regression of first or higher order. The peculiarity of these state variables is that they are not measurable. They are, rather, determined by measurable data (Devreux and Engel, 1999). Risk premium modeling studies initially applied the Autoregressive Conditional Heteroscedasticity (ARCH) state space models introduced by Lucas (1982) and the Generalized Autoregressive Conditional Heteroscedasticity in the Mean (GARCH-M) by Bollerslev (1986). ARCH models are used to characterize and to estimate financial time series data with variable volatilities. GARCH models, on the other hand, are used to estimate time series with non-constant conditional variance.
A commonly used version of GARCH has the distinctive feature of using heteroscedasticity in the mean equation of the GARCH model. Hence, its name GARCH in the Mean (GARCH-M) and its equation:
𝑦 = 𝑎 + ∑ 𝑎 𝑦 + 𝜆𝜎 + 𝜀 (2) Applying this model is subject to two constraints:
C1: the risk premium has the same sign as that of the slope of the linear regression.
C2: the fact that the slope of the linear regression is constant causes the variability to be
limited to its conditional variance.
Risk premium modeling considering C1 and C2 leads to the conclusion that correlation between
volatility and excess return on the foreign exchange market is significant. Hence, we can define Ci as
“the same sensitivity of the risk premium to volatility regardless the error’s sign or magnitude. Indeed, the fact that movements in opposite directions or different amplitudes can be observed means that the models are not able to satisfactorily explain the variations. Therefore, GARCH-M and ARCH do not consider the real behavior of market parameters. In fact, oscillatory cyclical behavior, abrupt shocks, and asymmetrical volatility of the parameters do not allow space-state models to explain the market’s reality. On the other hand, foreign exchange market movements show that the evolution of spot and future exchange rates is asymmetrical. The variations have, therefore, not only a negative or a positive sign but also different magnitudes. The “classical” formulation of ARCH-GARCH model is, consequently, no longer valid. In order to address the conditional variance’s asymmetry, we suggest the use of the Exponential GARCH model (E-GARCH) that was introduced by Nelson (1991).
The issue of risk premium conditional variance asymmetry was initially raised by Karfakis and Kim (1995) then by Gonzalez-Rivera (1998). Mc Kenzie (2002) argues that central banks’ intervention is
one of the underlying causes of the asymmetry of risk premium conditional variance. The manipulation of E-GARCH model for the risk premium in foreign exchange markets is the same as that for any other financial parameter, whereby the idea is that the heteroscedastic effect varies depending on whether the previous error is positive or negative, and the objective is to forecast and identify the impact of good and bad news on volatility. This alternation between good and bad news is expressed by an asymmetry of the financial series.
4. Methodology
After rejecting the EMH in the context of the Tunisian foreign exchange market (Kouki and Chichti 2003), the analysis below seeks to model the risk premium by estimating it. Our literature review showed that dynamic modeling can be done by applying equation (2) to the foreign exchange market and by referring to a GARCH-M. We, therefore, have:
(2) 𝑦 = 𝑎 + ∑ 𝑎 𝑦 + 𝜆𝜎 + 𝜀 (3) 𝑓 − 𝑠 = 𝛼 + 𝛽 (𝑓 − 𝑠 ) + 𝜀 Since GARCH-M modeling doesn’t consider the asymmetry of the conditional variance that was verified in theory, we need to use GARCH’s asymmetric version, E-GARCH. Using GARCH requires that we verify the presence of ARCH effect for the risk premium and forward premium that is associated with an ARCH-M.
Our analysis uses monthly exchange rates that we obtained from CBoT for the period of January 1, 2000 – March 31, 2008. We chose this period for several reasons. First, it is the period when the Euro was introduced. It’s, also, a period that is characterized by relative stability. Finally, the end of that period was determined by the 2007-2008 financial crisis, followed by its ripple effects on international markets then by the Tunisian revolution. Choosing 2008 as an end period would, therefore, prevent the twin crisis phenomenon.
5.
Results and Discussion
In this section, we present and discuss the results obtained by our GARCH, GARCH-M and E-GARCH models estimation. We display the descriptive results of the risk premium and forward premium for 1 and 12 months in Table 1. Results for 3, 6, and 9 months are in Table A-1 in the appendix.
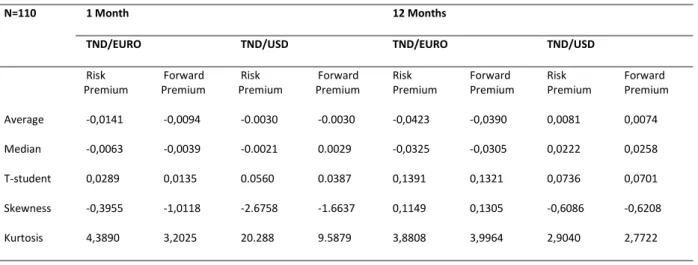
Table 1 - Summary Statistics
N=110 1 Month 12 Months
TND/EURO TND/USD TND/EURO TND/USD
Risk
Premium Premium Forward Premium Risk Premium Forward Risk Premium Forward Premium Risk Premium Forward Premium Average -0,0141 -0,0094 -0.0030 -0.0030 -0,0423 -0,0390 0,0081 0,0074 Median -0,0063 -0,0039 -0.0021 0.0029 -0,0325 -0,0305 0,0222 0,0258 T-student 0,0289 0,0135 0.0560 0.0387 0,1391 0,1321 0,0736 0,0701 Skewness -0,3955 -1,0118 -2.6758 -1.6637 0,1149 0,1305 -0,6086 -0,6208 Kurtosis 4,3890 3,2025 20.288 9.5879 3,8808 3,9964 2,9040 2,7722
As expected, risk premium and forward premium values are leptokurtic for both parities and for all forecast horizons (1, 3, 6, 9 and 12 months). The distribution of the risk premium and forward premium for both parities is asymmetrical. All data is negatively skewed (skewed to the left) except for the TND/Euro 3-moth risk premium and 12-month risk premium and forward premium.
In order to be able to test the residuals heteroscedasticity, VAR estimation has been performed (See Table A-2 in the appendix). Heteroscedasticity test results show that, for all forecast horizons, the residuals are homoscedastic until a fifth-order lag. In post-Euro, and in the short term, the relationship between the risk premium and the forward premium is characterized by residuals homoscedasticity. In the long term, this relationship takes into consideration residuals history. Hence, the Euro introduction helped stabilize European currencies’ behavior. On the other hand, post-euro TND/USD heteroscedasticity is rejected for 3, 6, 9- and 12-months horizons. Table 2 reports a summary of the heteroscedasticity test results. Detailed results are in Table A-3 in the appendix.
Table 2- Heteroscedasticity Test Results
TND/Euro TND/USD
Heteroscedasticity Test
Heteroscedasticity of order 5 for all horizons
Heteroscedasticity of order 1 for 1-month horizon
Interpretation Instability of TND>< Euro Instability of TND >< USD
GARCH modeling requires residuals heteroscedasticity. In fact, GARCH-M can only be used when the hypothesis of heteroscedasticity is accepted. Moreover, the model’s order was based on the residuals correlogram.
Table 3- GARCH-M Estimation Results
TND/Euro TND/USD
GARCH-M Effects:
• ARCH: 3 and 12 months
• ARCH / GARCH: 1,6 and 9 months
Effects: • ARCH (1) • GARCH (1-3) post
Interpretation Non-linear specification of the conditional variance of perturbations
Post-Euro modeling indicates that risk premium variance only depends on the residuals’ variance with an ARCH effect. On the other hand, the GARCH effect was only detected for a few cases with a lag order higher than 1. These findings suggest that the Euro introduction improved TND’s value compared to the pre-Euro period. The TND, remains, however, less stable than the USD. Test results for the TND/USD parity in post-Euro suggest that the best estimation model is GARCH-M for 1-month horizon. Our results show that the conditional variance is influenced by an ARCH effect of order 1 and a GARCH effect of order 1 and 3 (See Table A-4 in the appendix). It is important to note that both parities are unstable albeit at different degrees. This is mainly due to the different events that took place during the study period, such as the introduction of the Euro, the Iraq war, and the oil crisis.
The asymmetry of the dependent variables justifies our need to use an asymmetrical GARCH model, namely E-GARCH, defined as follows:
𝑙𝑜𝑔 𝐺 𝐴𝑅𝐶𝐻 = 𝑐 + ∑ 𝑐 𝑎𝑏𝑠(𝑟𝑒𝑠𝑖𝑑 /@𝑠𝑞𝑟𝑡(𝐺𝐴𝑅𝐶𝐻 )) + ∑ 𝑐 𝑙𝑜𝑔 𝐺 𝐴𝑅𝐶𝐻 (3)
The model estimation results are summarized below in Table 3. Detailed results can be found in Table A-5 in the appendix.
Table 4- E-GARCH Estimation Results
TND/Euro TND/USD
E-GARCH Positive standard deviation For 3,6- and 9-month horizons
Positive standard deviation
Interpretation R2, AIC: estimation improvement>< GARCH-M
The results above show that E-Garch is an appropriate model to estimate time varying risk premium for both parities, TND/USD and TND/Euro.
In order to be able to identify the most appropriate model to apply for risk premium conditional variance, we need to verify residuals normality of GARCH-M and E-GARCH models. Table 5 provides details on residuals normality test results.
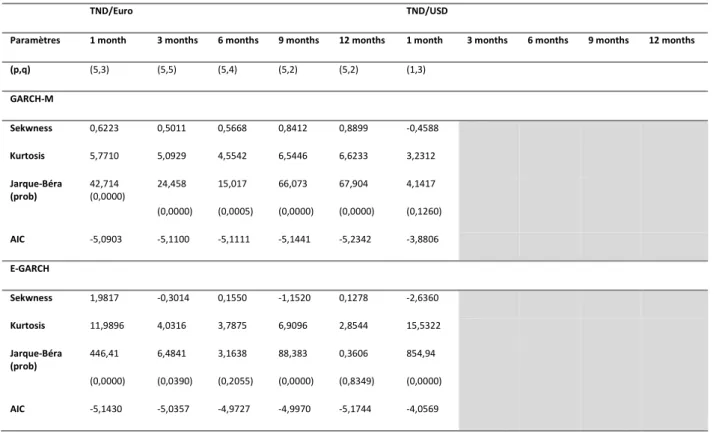
Table 5- Residual Normality Tests
TND/Euro TND/USD
Paramètres 1 month 3 months 6 months 9 months 12 months 1 month 3 months 6 months 9 months 12 months
(p,q) (5,3) (5,5) (5,4) (5,2) (5,2) (1,3) GARCH-M Sekwness 0,6223 0,5011 0,5668 0,8412 0,8899 -0,4588 Kurtosis 5,7710 5,0929 4,5542 6,5446 6,6233 3,2312 Jarque-Béra (prob) 42,714 (0,0000) 24,458 (0,0000) 15,017 (0,0005) 66,073 (0,0000) 67,904 (0,0000) 4,1417 (0,1260) AIC -5,0903 -5,1100 -5,1111 -5,1441 -5,2342 -3,8806 E-GARCH Sekwness 1,9817 -0,3014 0,1550 -1,1520 0,1278 -2,6360 Kurtosis 11,9896 4,0316 3,7875 6,9096 2,8544 15,5322 Jarque-Béra (prob) 446,41 (0,0000) 6,4841 (0,0390) 3,1638 (0,2055) 88,383 (0,0000) 0,3606 (0,8349) 854,94 (0,0000) AIC -5,1430 -5,0357 -4,9727 -4,9970 -5,1744 -4,0569
The following table (Table 6) summarizes the above residual normality test results.
Table 6- Residuals Normality Test results
Normality Test TND/Euro TND/USD
Jarque Bera Normality improvement Normality improvement
Kurtosis Sharper peak Sharper peak
Skewness 1,6,12 months: right skewness 3,9 months: left skewness
Skewed more to the left
Interpretation Using E-GARCH model improves risk premium estimation
Based on Jarque-Bera’s test that was applied to residuals models with a lag of order 36, we conclude that the residuals were normalized during the post-Euro period for both parties and for all forecasting horizons. Also, AIC suggests that risk premium estimation is better using E-GARCH than GARCH-M even though residuals normalization has been confirmed for both models.
6. Practical Implication
Following the succession of unpredictable political, economic, and social events such as the oil crisis and the Iraq war, a plethora of studies rejected the EMH in global markets (see for instance Dos Santos, 2016, Stocic et al., 2016, and Kumar, 2018), including the Tunisian foreign exchange market (Kouki and Chichti, 2003). Similar conditions may lead to the formation of market bubbles such as the mortgage subprime crisis (Stocic et al., 2016).
Exchange market movements are often associated with financial crises which leads to increased uncertainty and risk aversion (Kohler, 2010). This justifies the presence of a risk premium as an excess return when determining an exchange rate (Balduzzi and Chiang, 2019).
The results of this study confirmed the EMH rejection in the Tunisian foreign exchange market, despite CBoT’s intervention. In fact, the central bank seeks to absorb the market’s instability that strongly affects economic activities (Stosic et al., 2016). One of CBoT’s actions to manage the exchange rate is to increase the interest rate. In fact, varying the interest rate differential has a dynamic effect on the exchange market (exchange rate and volume variation of foreign currency transactions), especially during financial crises (Kohler, 2010).
It is extremely difficult to avoid the negative effects of an excessive increase in interest rates on the economy. In fact, an increase in interest rate entails an increase in the inflation rate and, therefore, a decrease in the purchasing power. This often leads to capital flight, on one hand, and to the development of parallel markets, on the other hand, rather than the encouragement of investors to save and invent. In order for political makers to ensure the exchange market stability, they are expected to support the financial market (Drea, 2016). To do so, banks can opt for increasing investment, supporting public finance, and/or controlling the commercial balance through increasing exports and decreasing imports.
7. Conclusion
The objective of our research was to examine time-varying risk premiums in the Tunisian foreign exchange market by applying GARCH-M model to the TND/Euro parity for 1 to 12 months forecasting horizons. Our analysis shows that the detected risk premium was time varying and was a source of rejection of the EMH on the forward exchange market. We applied GARCH-M modeling after verifying the residuals homoscedasticity. Our results show that the homoscedasticity hypothesis was rejected in some cases. This can be explained by the instability of the residual’s volatility due to the TND/Euro heteroscedasticity (for all forecasting horizons) and the TND/USD (for 1 month) due to an ARCH effect. On the other hand, the descriptive analysis of the variables that are being estimated (i.e. the risk premium and the forward premium) showed an asymmetry in distributions. Since econometric models such as state-space models do not consider oscillatory cyclical behavior, sudden shocks, and variables asymmetrical volatility, we used E-GARCH. In contrast to evidence in the literature which suggests that E-GARCH is inadequate for volatility dynamic modeling, we found that E-GARCH not only allowed for smoothing the residuals, but also had a better AIC compared to GARCH-M.
Since the Tunisian finance is protected1, there are no negative consequences on the TND.
Nonetheless, the detected heteroscedasticity means that the Euro introduction ensured a relative stability of the TND compared to the post-euro era.
Similar to other developing and emerging economies, Tunisia was affected by several crises in a way that was proportionate to the degree of liberalization of its economy, its currency, and its control over the exchange rate as well as to the degree of its domestic market’s openness to international investments. The CBoT took over the responsibility of insuring financial rigor in order to partially cushion the impact of international financial crises, even though, it has been argued that conditional variance asymmetry of risk premium is attributed to central banks’ intervention (McKenzie, 2002). There are some gaps in our knowledge around informational efficiency in emerging economies that follow from our findings and that would benefit from further research. It would be interesting, for instance, to study the impact of twin crises effect on risk premium where a crisis triggers another. Would E-GARCH remain valid? If not, would another asymmetric GARCH model such as the Asymmetric Nonlinear Smooth Transition GARCH be more suitable?
1A protected finance is characterized by the intervention of regulatory authorities to enforce the use of various tools to ensure the integrity of the financial system and to protect it from the risk of national and international
References
Adouka. L, Boucheta. Y, Chenini. A, et Kchirid. E.M, (2015). Modèles GARCH: Application aux Taux de Change Algérien. International Journal of Innovation and Applied Studies, vol. 11, 699-715.
Bailey. W et Chan. K, (1993). Macroeconomic Influences and the Variability of the Commodity Futures Basis. Journal of Finance, 555-573.
Balduzzi, P., Chiang, I. (2018). Real Exchange Rates and Currency Risk Premiums, The Review of Asset Pricing Studies, Available at https://doi.org/10.1093/rapstu/raz002
Benigno, G., Benigno, P., Nistic, S. (2011) Risk, Monetary Policy and the Exchange Rate, Working Paper 17133, National Bureau of Economic Research.
Bertasiute, A., Massaro, D., Weber, M. (2018). The Behavioral Economics of Currency Unions: Economic Integration and Monetary Policy. Bank of Lithuania Working Paper No 49/2018.
Bilson, J. F. O. (1981). The Speculative Efficiency Hypothesis. Journal of Business, vol. 54, 435-51 Bollerslev, T. (1986). General Autoregressive Conditional Heteroscedasticity. Journal of Econometrics, N°31, 307-327.
Central Bank of Tunisia (1999). Annual Report 1999. Tunis, Tunisia: Central Bank of Tunisia.
De Grauwe, P. (2010). The scientific foundation of dynamic stochastic general equilibrium (DSGE) models. Public Choice, vol. 144, 413 - 443.
De Oliveira Souza, T. (2019). Macro-Finance and Factor Timing: Time-Varying Factor Risk and Price of Risk Premiums. Discussion Papers on Business and Economics., University of Southern Denmark,
7/2019. Available at
SSRN: https://ssrn.com/abstract=3387301 or http://dx.doi.org/10.2139/ssrn.3387301
Devereux, M., Engel, C., 1999. The optimal choice of exchange-rate regime: Price-setting rules and internationalized production. NBER Working Paper No. 6992.
Djeutem, E. (2014). Model uncertainty and the Forward Premium Puzzle. Journal of International Money and Finance, vol. 46, 16-40.
Dos Santos, M., Klotzle, M. and Pinto, A. Evidence of risk premiums in emerging market carry trade currencies. Journal of International Financial Markets, Institutions and Money, vol. 44, 103-115. Drea, F. (2016). Financial Market Instability. Martens Centre for European Studies. 1-13.
Engel, C. (1992). On the foreign Exchange Risk Premium in a General Equilibrium Model. Journal of International Economics, vol. 32, 305-319.
Engel, C. (2012). The Real Exchange Rate, Real Interest Rates, and the Risk Premium, Working paper, University of Wisconsin.
Fama, E. (1965). The Behavior of Stock-Market Prices. The Journal of Business, vol. 38, 34-105. Fama, E. (1984). Forward and spot exchange rates. Journal of Monetary Economics, vol. 14, 319-338. Gonzalez-Rivera, G. (1998). Smooth Transition GARCH Models. Studies in Nonlinear Dynamics and Econometrics, vol.3, 307-333.
Hodrick, R. et Srivastava, S. (1984). An Investigation of Risk and Return in Forward Foreign Exchange. Journal of International Money and Finance, vol. 3, 5-29.
Karfakis, C. et Kim, S. (1995). Exchange Rates, Interest Rates and Current Account News: Some Evidence from Australia. Journal of International Money and Finance, vol. 14, 575-595.
Katusiime, L, Shamsuddin, A., Agbola, f. (2015). Foreign exchange market efficiency and profitability of trading rules: Evidence from a developing country. International Review of Economics and Finance, vol. 35, 315-335.
Kohler, M. (2010). Exchange rates during financial crises. BIS Quarterly Review, 39-50.
Kouki, S., Chichti, J. E. (2003). The Premium Risk in the New Context of the Tunisian Foreign Exchange Market. International Journal of Finance, vol. 5, 08-27.
Kumar, S. (2018). An Empirical Examination of Risk Premiums in the Indian Currency Futures Market. Asia-Pacific Journal of Risk and Insurance, vol. 12, 1-24.
Lucas, R. (1978). Asset Prices in an Exchange Economy. Econometrica, Vol. 46, 1429-1445.
Lucas, R. (1982). Interest Rates and Currency Prices in a Two-country World. Journal of Monetary Economics, vol. 10, 335-360.
McKenzie, M. (2002). The Economics of Exchange Rate Volatility Asymmetry. International Journal of Finance and Economics, vol.7, 247-266.
Miah, F. and Hassan, M. and Rahman, A. (2018). An Empirical Examination of Rational Expectations Hypothesis in the Foreign Exchange Market. Available at SSRN 3263106
Nelson. D. B. (1991). Conditional heteroskedasticity in asset returns: A new approach. Econometrica, N°59, 347- 370.
Sarno.L, Taylor. M, (2002). Purchasing Power Parity and the Real Exchange Rate. IMF Staff Papers, vol. 49, 65–105.
Stosic, [Darco], Stosic, [Dusan], Ludermir, T., De Oliviera, W., Stosic, T. (2016). Foreign exchange rate entropy evolution during financial crises. Physica A, vol 449, 233-239.
Verdelhan, A. (2010). A habit-based explanation of the exchange rate risk premium. Journal of Finance, vol. 65, 123-146.
Vural, B. (2018). Determinants of Turkish Real Effective Exchange Rates. The Quarterly Review of Economics and Finance, In Press.