HAL Id: hal-02625686
https://hal.inrae.fr/hal-02625686
Submitted on 26 May 2020
HAL is a multi-disciplinary open access
archive for the deposit and dissemination of
sci-entific research documents, whether they are
pub-lished or not. The documents may come from
teaching and research institutions in France or
abroad, or from public or private research centers.
L’archive ouverte pluridisciplinaire HAL, est
destinée au dépôt et à la diffusion de documents
scientifiques de niveau recherche, publiés ou non,
émanant des établissements d’enseignement et de
recherche français ou étrangers, des laboratoires
publics ou privés.
Recycling by Methionine Sulfoxide Reductase AB Serve
as an Antioxidant Strategy in Bacillus cereus
Jean-Paul Madeira, Béatrice M. Alpha-Bazin, J. Armengaud, Catherine
Duport
To cite this version:
Jean-Paul Madeira, Béatrice M. Alpha-Bazin, J. Armengaud, Catherine Duport. Methionine Residues
in Exoproteins and Their Recycling by Methionine Sulfoxide Reductase AB Serve as an
Antiox-idant Strategy in Bacillus cereus.
Frontiers in Microbiology, Frontiers Media, 2017, 8, 16 p.
doi: 10.3389/fmicb.2017.01342
Edited by: Xihui Shen, Northwest A&F University, China Reviewed by: John M. Atack, Griffith University, Australia Konstantin V. Korotkov, University of Kentucky, United States *Correspondence: Catherine Duport catherine.duport@univ-avignon.fr
Specialty section: This article was submitted to Infectious Diseases, a section of the journal Frontiers in Microbiology Received: 12 April 2017 Accepted: 03 July 2017 Published: 26 July 2017 Citation: Madeira J-P, Alpha-Bazin BM, Armengaud J and Duport C (2017) Methionine Residues in Exoproteins and Their Recycling by Methionine Sulfoxide Reductase AB Serve as an Antioxidant Strategy in Bacillus cereus. Front. Microbiol. 8:1342. doi: 10.3389/fmicb.2017.01342
Methionine Residues in Exoproteins
and Their Recycling by Methionine
Sulfoxide Reductase AB Serve as an
Antioxidant Strategy in Bacillus
cereus
Jean-Paul Madeira1, 2, Béatrice M. Alpha-Bazin2, Jean Armengaud2and
Catherine Duport1*
1Sécurité et Qualité des Produits d’Origine Végétale (SQPOV), UMR0408, Avignon Université, Institut National de la
Recherche Agronomique, Avignon, France,2Commissariat à lEnergie Atomique, Direction de la Recherche Fondamentale,
Institut des Sciences du vivant Frédéric-Joliot (Joliot), Service de Pharmacologie et Immunoanalyse, Laboratoire Innovations Technologiques pour la Détection et le Diagnostic (Li2D), Bagnols-sur-Cèze, France
During aerobic respiratory growth, Bacillus cereus is exposed to continuously reactive oxidant, produced by partially reduced forms of molecular oxygen, known as reactive oxygen species (ROS). The sulfur-containing amino acid, methionine (Met), is particularly susceptible to ROS. The major oxidation products, methionine sulfoxides, can be readily repaired by methionine sulfoxide reductases, which reduce methionine sulfoxides [Met(O)] back to methionine. Here, we show that methionine sulfoxide reductase AB (MsrAB) regulates the Met(O) content of both the cellular proteome and exoproteome of B. cereus in a growth phase-dependent manner. Disruption of msrAB leads to metabolism changes resulting in enhanced export of Met(O) proteins at the late exponential growth phase and enhanced degradation of exoproteins. This suggests that B. cereus can modulate its capacity and specificity for protein export/secretion through the growth phase-dependent expression of msrAB. Our results also show that cytoplasmic MsrAB recycles Met residues in enterotoxins, which are major virulence factors in B. cereus.
Keywords: methionine sulfoxide reductase, exoproteome, antioxidants, Bacillus cereus, metabolism
INTRODUCTION
Reactive oxygen species (ROS) are by-products of aerobic metabolism, and respiration is
considered to be the major intracellular source of ROS production in bacteria (Brynildsen
et al., 2013; Imlay, 2013). Methionine residues in proteins are particularly susceptible to
oxidation by ROS (Vogt, 1995; Stadtman et al., 2005), resulting in methionine-S-sulfoxides
[Met-S-(O)] and methionine-R-sulfoxides [Met-R-(O); (Luo and Levine, 2009; Kim et al.,
2014)]. Oxidized methionine can be repaired by the antioxidant enzymes, Met-S-(O) reductase
(MsrA) and Met-R-(O) reductase (MsrB). Both Msr share a common catalytic mechanism to reduce Met(O) back to Met. This catalytic mechanism leads to the formation of an intramolecular disulfide bond in the Msr and involves thioredoxin (Trx), thioredoxin
reductase, and NADPH (Weissbach et al., 2002). It has been shown that MsrA reduces both oxidized proteins and low molecular weight Met(O)-containing compounds with a similar catalytic efficiency, whereas MsrB is specialized for the reduction of Met(O) in proteins. Interestingly, both Msr types
preferentially repair unfolded proteins (Tarrago et al., 2012).
The genes encoding MsrA and MsrB have been identified in most living organisms. Four different types of organization have been reported for msrA and msrB: (i) msrA and msrB genes are two separate transcription units, (ii) msrA and msrB cistrons are organized as an operon, (iii) msrA and msrB cistrons form a single open reading frame (ORF) to produce a two domain protein, and (iv) trx, msrA, and msrB cistrons form a single
ORF to produce a three domain protein (Drazic and Winter,
2014).
Several studies have revealed the importance of Met oxidation and Msrs, especially regarding oxidative stress resistance and metabolism under stress conditions. In addition, Msrs have also been reported to be important virulence factors in pathogens by modulating a range of properties such as adherence (Wizemann et al., 1996; Giomarelli et al., 2006), motility (Hassouni et al., 1999), biofilm formation (Beloin et al., 2004),
and in vivo survival (Alamuri and Maier, 2004). However,
the importance of Met oxidation and Msr in the secretion of virulence factors under normal physiological conditions is largely unknown in pathogens, and in particular in Bacillus cereus.
B. cereus is a Gram-positive, motile human pathogen that is well-equipped to survive in various environments such as those encountered in soil, food and the human gastrointestinal tract (Stenfors Arnesen et al., 2008). These bacteria can grow in the
presence or absence of oxygen (Rosenfeld et al., 2005; Duport
et al., 2006). In the human intestine, B. cereus encounters oxic
conditions in zones adjacent to the mucosal surface (Marteyn
et al., 2010) and anoxic conditions in the intestinal lumen (Moriarty-Craige and Jones, 2004). In the presence of oxygen, B. cereus grows by means of aerobic respiration and secretes a large number of proteins into the extracellular compartment. These secreted proteins, and all the released proteins found in the pathogen’s surrounding environment, constitute the B.
cereus exoproteome (Clair et al., 2010, 2013; Laouami et al.,
2014). We previously reported that the B. cereus exoproteome
contained protein-bound Met(O) and that the accumulation of protein-bound Met(O) decreased significantly during aerobic respiratory growth, to reach its minimal value at the stationary
phase (Madeira et al., 2015). Insofar as there is no ROS source
and no Msr to reduce Met(O) back to Met in the extracellular milieu, we assumed that the time dynamic of protein-bound Met(O) in the B. cereus exoproteome could reflect the growth phase-dependent activity of an intracellular Msr. Here, we show that B. cereus encodes a functional MsrAB methionine sulfoxide reductase that is responsible for the decrease of the Met(O) content of the B. cereus exoproteome during aerobic respiratory growth. In addition, our results provide evidence that Met residues in exoproteins, especially enterotoxins, and their recycling by MsrAB, can serve as an antioxidant system that could trap ROS and maintain redox homeostasis in cells.
MATERIALS AND METHODS
Construction of a 1msrAB Mutant and Its
Complementation
Mutant construction was performed according to the procedure
developed by Arnaud et al. (2004). The msrAB ORF was
interrupted by insertion of a non-polar spectinomycin resistance
expression cassette, spc (Murphy, 1985) as follows. A DNA
fragment of 1,413 bp encompassing the msrAB ORF was amplified from B. cereus genomic DNA by PCR with primers
5′-gaattcTCATGCCTTGAAAGTTACGG-3′ and 5′-agatctTTG
GCGTAACGGTAATTGGT-3′, which contained EcoRI and BglII
restriction sites, respectively. The amplified DNA fragment was cloned into pCRXL-TOPO (Invitrogen). The resulting pCRXLmsrAB plasmid was digested with StuI. A 1.5 kb SmaI
fragment containing spc was purified from pDIA (Laouami
et al., 2011) and ligated into StuI-digested pCRXLmsrAB. The resulting plasmid, pCRXLmsrAB1spc, was digested with EcoRI plus BglII. The msrAB1spc fragment was then subcloned into
EcoRI/BglII sites of pMAD (Arnaud et al., 2004). This construct
was used for B. cereus transformation (Omer et al., 2015). For
complementation of the 1msrAB mutant with wild-type msrAB gene, the 1,413 bp EcoRI-BglII fragment was cloned into pHT304 (Arantes and Lereclus, 1991). MsrAB is under the control of its own promoter into pHT304-msrAB.
B. cereus
Strains and Growth Conditions
Wild-type B. cereus ATCC 14579 without its pBClin15
plasmid (Madeira et al., 2016a,b), its 1msrAB mutant and
1msrAB/pHT304msrAB complemented strains were grown in MOD medium supplemented with 30 mM glucose as the carbon
source, as previously described (Madeira et al., 2016b). The
inoculum was a sample of exponential subculture harvested by centrifugation, washed and diluted in fresh medium to obtain an initial optical density at 600 nm of 0.02. Three independent
batch cultures (biological replicates) were carried out at 37◦C for
each strain.
Analytical Procedures and Growth
Parameters
B. cereus growth was monitored spectrophotometrically at 600 nm. The specific growth rate (µ) was determined using
the modified Gompertz equation (Zwietering et al., 1990).
Cells and filtered culture supernatants were harvested at the
indicated growth stage as previously described (Madeira et al.,
2015, 2016b). Exoproteins were immediately precipitated from the culture supernatant using trichloroacetic acid (TCA), as
previously described, and stored at 4◦C until analysis. The
concentrations of substrate, and by-products in the filtered culture supernatants were determined with Enzytec Fluid kits purchased from R-Biofarm, as described by the manufacturer. Exoprotein concentration was determined by the Bradford protein assay (Pierce).
Protein Sample Preparation, Trypsin In-gel
Proteolysis, and Nano-LC-MS/MS Analysis
Protein extraction and subsequent digestion were performed as
intracellular proteins from the 27 samples (biological triplicates from the three time conditions for the wild-type, 1msrAB and
1msrAB/pHT304-msrAB strains) were resolved on NuPAGE R
4–12% Bis-Tris gels (Invitrogen) that were run for a short (about 3 mm) electrophoretic migration using NuPAGE MES supplemented with NPAGE antioxidant as the running buffer (Hartmann and Armengaud, 2014). This avoids artefactual protein oxidation. For each of the 54 protein samples, the whole protein content was extracted as a single polyacrylamide band. The bands were subjected to proteolysis with sequencing grade trypsin (Roche) following the ProteaseMAX protocol (Promega),
as previously described (De Groot et al., 2009; Clair et al., 2010).
NanoLC-MS/MS experiments were performed using an LTQ-Orbitrap XL hybrid mass spectrometer (ThermoFisher) coupled to an Ultimate 3000 nRSLC system (Dionex, ThermoFisher;
Dedieu et al., 2011; Madeira et al., 2015).
Peptide and Protein Identification from
MS/MS Datasets
MS/MS spectra were searched against an in-house polypeptide sequence database corresponding to an improved annotation
of the B. cereus ATCC 14,579 genome (Madeira et al., 2016a).
The MASCOT Daemon search engine (version 2.3.02; Matrix Science) was used to search tryptic peptides as previously
described (Dupierris et al., 2009; Madeira et al., 2016a).
The mass spectrometry proteomics data have been deposited in the ProteomeXchange Consortium (http://proteomecentral. proteomexchange.org) via the PRIDE partner repository (http:// www.ebi.ac.uk/pride) with the dataset identifiers, PXD006169 and 10.6019/PXD006169 (exoproteome) and, PXD006205 and 10.6019/PXD006205 (cellular proteome).
Label-Free Comparative Proteomics
Analyses of changes of peptides and proteins in terms of abundance were achieved by comparing the spectral counts of proteins after voom transformation of abundance values using
the R package LIMMA (Ritchie et al., 2015), as previously
described (Madeira et al., 2016b). Data were normalized using
the trimmed mean of M-values (TMM), implemented in the
R package edgeR (Robinson et al., 2010). For quantitative
comparisons, data were filtered to have two valid values in at least two biological replicates. Since we were specifically interested in the comparison between wild-type, 1msrAB mutant and the complemented strain 1msrAB/pHT-msrAB, we conducted differential analysis between WT and 1msrAB, as well as 1msrAB and msrAB, and WT and 1msrAB/pHT-msrAB, individually. Differential protein and peptide abundances between WT and 1msrAB, between 1msrAB and 1msrAB/pHT-msrAB, and between WT and 1msrAB/pHT-msrAB were considered significant at stringent p-values (≤0.01). The results
are presented as log2fold-changes.
Real-time RT-PCR and 5
′RACE Assays
Total RNA was prepared as described previously (Omer et al.,
2015). Real-time RT-PCR was performed using the iScriptTM
One-Step RT-PCR kit with SYBR R Green following the
manufacturer’s protocol (Biorad). The msrAB-specific primer
pair used in this study was: 5′
-TTCTGGTACACAGGTGGTC-3′ and 5′-AAAGCGTCCACTCTGCTCAA-3′. Gene expression
was normalized by the 11CT analysis. The 16s rDNA was used as the reference gene in the calculations. The 16S
rDNA-specific primer pair was 5′-TCCAACTGATGGCGGAC-3′ and
5′-TCACGCCCAGATTCTTTTTGC-3′. Rapid amplification of
5′ complementary cDNA ends (5′RACE) was performed using
the 5′/3′ RACE kit (Sigma). The msrAB specific primers SP1,
SP2 and SP3 were: 5′-ATGTCCCGTCGTTTCTGAAC-3, 5′
-TCAAATGGCGAAACCATACA-3′ and 5′-CCATACACCAGA
AGCACCCT-3′, repectively.
Protease Activity Assay
Sigma’s non-specific protease activity assay was used to determine the protease activity of filtered culture supernatant. In this assay, casein acts as a substrate. Tyrosine, which is released on hydrolysis of casein by proteases, is able to react with Folin-Ciocalteu’s reagent to produce a blue chromophore. The quantity of this chromophore was measured by means of its absorbance value by spectrophotometry. Absorbance values generated by the activity of the protease were compared to a standard curve, which was generated on the basis of known quantities of tyrosine. From the standard curve, the activity of protease samples was determined in units, corresponding to the amount in micromoles of tyrosine equivalents released from casein per minute. Experiments were performed twice for each of the 27 filtered culture supernatants. Statistical differences were evaluated by the Student’s t-test.
Long-Term Survival
The survival of WT, 1msrAB mutant, and complemented 1msrAB mutant were determined as follows. After 24 h
incubation at 37◦C on glucose containing MOD medium,
cultures were transferred to 4◦C. An aliquot of each culture was
collected before and after 1, 2, 3, 4, and 5 days of exposure to
4◦C. Viable cells were determined by serial dilution of cultures
in PBS, plating on LB agar, and incubation overnight (37◦C).
Experiments were performed in triplicate. Statistical differences were evaluated by the Student’s t-test.
RESULTS
msrAB
Expression Is Growth Phase
Dependent
Genome analyses of B. cereus ATCC 14579 identified an ORF (BC_5436) encoding a cytoplasmic protein annotated as MsrAB (NP_835097). This predicted cytoplasmic protein is composed of 321 amino acids and has a molecular weight of 36,938 Da. MsrAB and its gene msrAB are strongly conserved in members of the B. cereus group (data not shown). We mapped the transcriptional
start site of msrAB by 5′RACE. The transcriptional start site (G)
was located 23 nt upstream of the translational start codon and was preceded by a region similar to σE consensus-35 (TAATATG) and -10 (CATACTG) boxes separated by 13 nt. Furthermore,
msrAB appeared to be followed by an inverted repeat (1G◦ =
23.6 kcal/mol) that may a transcriptional terminator (Figure S1). This indicates that msrAB may be transcribed as a single unit.
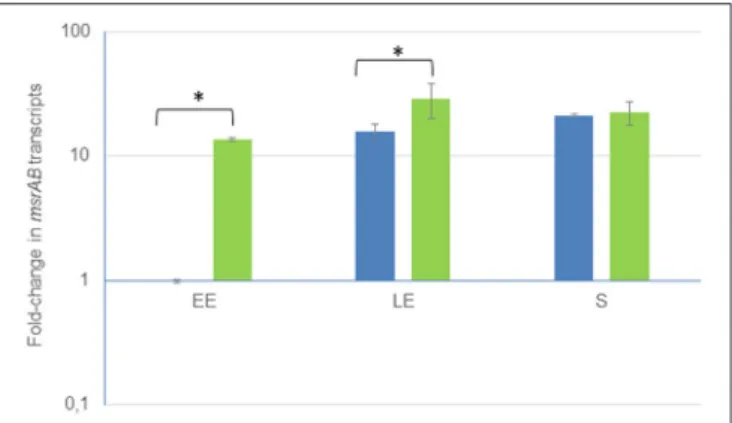
FIGURE 1 | Growth phase-dependent changes of msrAB transcript levels in wild-type (blue) and complemented 1msrAB/pHT304msrAB (green) strains. Fold changes refer to the levels observed in early exponential (EE) phase cultures of the WT strains. Significant differences are indicated with one (p < 0.05) asterisks. LE, Late exponential growth phase; S, Stationary growth phase.
To determine whether there is any regulation of msrAB, mRNA levels were measured at early exponential (EE), late exponential (LE) and stationary (S) growth phases. Figure 1 shows that there was about a 30-fold increase in msrAB expression for cells harvested at the S growth phase compared with the EE growth phase. B. cereus msrAB expression was thus maximal over the stationary phase. Similar stationary phase-induced expression of
msr genes has been documented in several bacteria (Moskovitz
et al., 1995; Vattanaviboon et al., 2005; Alamuri and Maier, 2006; Singh and Singh, 2012).
MsrAB Contributes to B. cereus
Respiratory Metabolism
To investigate the role of MsrAB in B. cereus, we constructed a non-polar 1msrAB mutant and a 1msrAB-complemented
strain using a multicopy pHT304-based plasmid (Arantes and
Lereclus, 1991). Expression of msrAB in the complemented strain was under the control of its own promoter. We did not detect msrAB mRNA by RT-PCR in the mutant, proving that the genomic disruption of the gene generated an msrAB-null mutant. Figure 1 shows that msrAB was overexpressed in the strain ∆msrAB/pHT304msrAB at the EE and LE growth phases. Therefore, msrAB expression level was not restored by complementation.
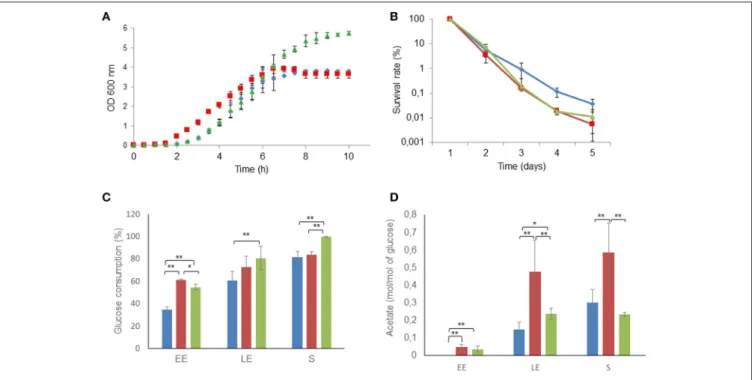
The growth characteristics of the three strains, 1msrAB, 1msrAB/pHT304msrAB, and the parental wild-type strain (WT), were determined under pH-regulated aerobic respiratory conditions in synthetic MOD medium. Figure 2A shows that the lag phase was 2.5-fold lower in the 1msrAB strain (0.7 ±
0.1 h−1) than in the 1msrAB/pHT304msrAB (1.8 ± 0.9 h−1)
and WT (1.9 ± 0.2 h−1) strains. Exponential growth kinetics
were similar in the three strains for the first 6 h. After this initial growth time, WT and 1msrAB cultures entered stationary phase. In contrast, 1msrAB/pHT304msrAB continued to grow and reached the stationary growth phase at a higher final
biomass (2.6 ± 0.1 g.L−1) than 1msrAB (1.9 ± 0.1 g.L−1)
and WT (1.8 ± 0.2 g.L−1). The viabilities of 1msrAB and
1msrAB/pHT304msrAB cells, harvested at S growth phase, were similar to the viability of WT after 2 days but declined by
more than 100-fold after 5 days of storage at 4◦C (Figure 2B).
This suggests that msrAB expression impacts the metabolic
activity of B. cereus cells at the end of growth (Chubukov
and Sauer, 2014). Figure 2C shows that the 1msrAB and 1msrAB/pHT304msrAB strains consumed higher amounts of glucose than WT at the beginning of exponential growth. The 1msrAB/pHT304msrAB culture could be distinguished from the 1msrAB culture by continued glucose consumption between the LE and S growth phases (Figure 2C). At the end of growth, 1msrAB/pHT304msrAB consumed a higher level of glucose than 1msrAB and WT. During aerobic respiratory growth, glucose
is catabolized into CO2 through the TCA cycle, and acetate is
excreted as a by-product of overflow metabolism (Madeira et al.,
2015; Duport et al., 2016). Figure 2D shows that 1msrAB cells, and to a lesser extent 1msrAB/pHT304msrAB cells, excreted higher amounts of acetate than WT cells during exponential growth. Acetate accumulation stopped at the LE growth phase in the 1msrAB and 1msrAB/pHT304msrAB cultures while it continued to accumulate between the LE and S growth phases in the WT culture. Taken together, these results suggest that msrAB expression impacts on the metabolic activity of B. cereus under aerobiosis.
To determine whether the alteration of glucose catabolism was associated with changes in extracellular protein production, extracellular proteins were extracted from culture supernatants of the three B. cereus strains, harvested during the EE, LE, and S
growth phases (Madeira et al., 2015). Figure 3A shows that the
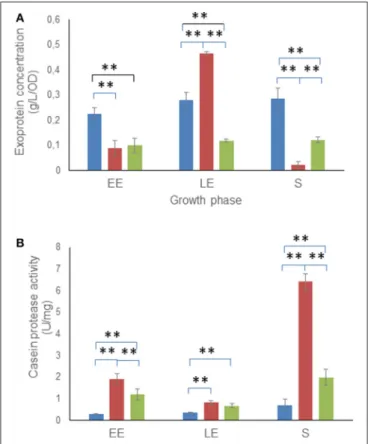
1msrAB culture supernatant accumulated a higher amount of exoproteins than that of WT at the LE phase. However, 1msrAB supernatant had 50 and 90% fewer exoproteins in the EE and S growth phases, respectively, compared with WT. This decreased exoprotein concentration could have resulted from a higher protease activity in the 1msrAB culture supernatant. To test this hypothesis, we quantified the protease activity of the 1msrAB, 1msrAB/pHT304msrAB and WT culture supernatants against casein. Figure 3B shows that the 1msrAB culture supernatant sustained a higher protease activity than WT, markedly in the EE and S growth phases. These changes in protease activity were only partially rescued in 1msrAB/pHT304msrAB. However, unlike 1msrAB/pHT304msrAB, there was no correlation between the protease activity and the amount of exoproteins in 1msrAB at LE phase (Figure 3A). This indicates that changes in msrAB expression could be selective for certain extracellular proteases.
MsrAB Modulates the Proteome Profile of
B. cereus
To determine if altered metabolism in 1msrAB and
1msrAB/pHT304msrAB was associated with cellular and exoproteome profile changes, we quantified protein abundance level differences between 1msrAB, 1msrAB/pHT304msrAB, and WT cells in the EE, LE and S growth phases. Exoproteome and cellular proteome samples were prepared from supernatant cultures and whole-cell lysates, respectively. A total of 200,746 and 71,676 MS/MS spectra were recorded from cellular proteome and exoproteome samples, respectively. A total of 922 proteins were identified in the cellular proteome (Table S1) and 371
FIGURE 2 | Altered growth and long-term survival of 1msrAB mutant cells and complemented 1msrAB/pHT304msrAB cells. (A) Growth curves of WT (blue), 1msrAB (red) and 1msrAB/pHT304msrAB (green) cells in pH-regulated batch cultures under aerobiosis. (B) Long-term survival of WT (blue), 1msrAB (red) and 1msrAB/pHT304msrAB (green) cells after growth under aerobiosis. (C) Glucose consumption of WT (blue), 1msrAB (red) and 1msrAB/pHT304msrAB (green) cells. (D) Acetate production of WT (blue), 1msrAB (red) and 1msrAB/pHT304msrAB (green) cells. Significant differences are indicated with one (p < 0.05) or two (p < 0.01) asterisks.
proteins were identified in the exoproteome (Table S2), based on the confident detection of at least two different peptides. A two-sample t-test was then conducted separately between WT and 1msrAB, and between 1msrAB and 1msrAB/pHT304msrAB.
All proteins with a p ≤ 0.01 and at least a 2-fold change (log2
fold-change ≥ 1) were considered to be differentially modulated in terms of abundance. A total of 64 and 78 proteins were found to vary in abundance in 1msrAB compared with WT in the cellular proteome and exoproteome fractions, respectively. The majority (80%) of these proteins were not rescued in 1msrAB/pHT304msrAB (data not shown). The Venn diagrams presented in Figure 4 show the growth phase distribution of the identified proteins. Less than 2% of proteins showed abundance level changes in all three growth stages, indicating that msrAB modulates B. cereus cellular and exoproteome mainly in a growth phase-dependent manner. The impact of msrAB disruption appeared to be more important at the LE and S than the EE growth phase in the cellular proteome (Figure 4A), according to its expression (Figure 1).
Cellular Proteins
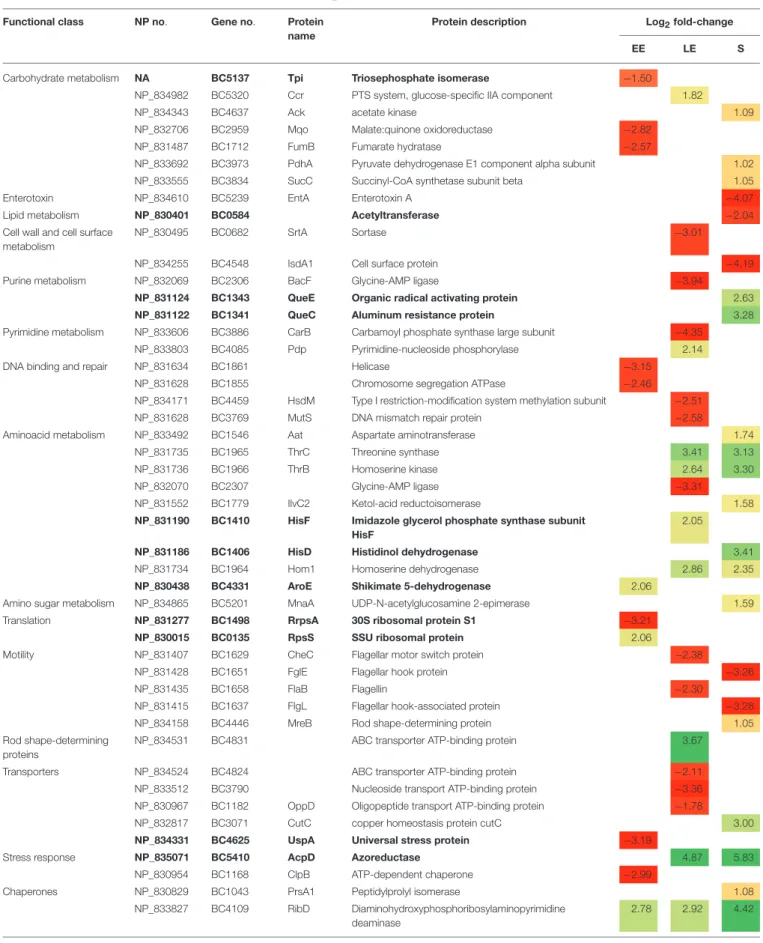
Table 1lists the identities and putative functions of the cellular proteins differentially produced in 1msrAB compared with WT. In the EE phase, three proteins impacted by msrAB disruption were classified as carbohydrate metabolism enzymes. The glycolytic enzyme, Tpi (triose phosphate isomerase), and the two TCA enzymes, Mqo (malate:quinone oxidoreductase) and FumB (fumarate hydratase), were less abundant in 1msrAB
than WT. Tpi catalyzes the interconversion of dihydroacetone phosphate (DHAP) and glyceraldehyde-3-phosphate to prevent DHAP accumulation. It has been shown that a reduction of Tpi activity redirected the carbon flux from glycolysis to the pentose phosphate pathway (PPP), which provides the redox
power for antioxidant systems (Ralser et al., 2007). FumB
catalyzes the reversible hydration of fumarate to malate, and Mqo oxidizes malate to oxaloacetate and reduces quinone via a
one-transfer electron reaction (Kabashima et al., 2013). By decreasing
FumB and Mqo levels, 1msrAB cells can thus decrease TCA activity, and consequently respiratory chain activity and ROS production. The reduction of respiratory chain capacity could be compensated by increasing glycolytic flux and increasing overflow metabolism (acetate excretion), as observed in Figure 2. Only one stress response-related protein (USP) was shown to be differentially produced in 1msrAB at EE phase. As recently reported, USP may function as a protein regulator of downstream effectors of nucleotide-binding protein cycling. This activity
depends on the energy status (ATP level) of the cells (Banerjee
et al., 2015). A decrease in the UPS abundance level in 1msrAB could thus reflect a change in ATP availability and/or demand at EE phase. 1msrAB also sustained a higher level of RibD whatever the growth phase. The gene encoding RibD belongs to the putative operon ribDEAH, which encodes RibD, a pyrimidine deaminase/reductase, RibE, the α-subunit of riboflavin synthase, RibA, the GTP cyclohydrolase/3,dihydroxy 2-butanone 4-phosphate (3,4-DHBP) synthase, and RibH, the β-subunit of riboflavin (RibH). These enzymes form a pathway that produces
FIGURE 3 | Exoproteome concentration and protease assay. Concentrations (A) and casein proteolytic activity (B) are indicated for total extracellular proteins of WT (blue), 1msrAB (red) and 1msrAB/pHT304msrAB (green) cells. Error bars represent the standard deviation from two independent measures for each biological triplicate. Significant differences (p < 0.01) between WT, 1msrAB and 1msrAB/pHT304msrAB strains are indicated with two asterisks.
one riboflavin molecule from GTP and ribulose-5-phosphate (Vitreschak et al., 2002). RibA and RibH were more highly produced in 1msrAB than in WT at LE growth phase and RibE was more highly produced at S growth phase. Together these results suggest the increased production in 1msrAB of riboflavin,
which is known to be an element of antioxidant defense (Abbas
and Sibirny, 2011). One stress-related protein, named AcpD (annotated as an azoreductase), which was not detected in WT cells (Table S1), was significantly induced at both LE and S growth phases in 1msrAB cells. AcpD is a putative FMN-NAD(P)H-dependent quinone oxidoreductase that catalyzes the two-electron reduction of quinones to quinols. This protein could play an important role in managing oxidative stress in the absence of msrAB by maintaining the reduced antioxidant form
of quinone (Ross et al., 2000; Ryan et al., 2014). Several proteins
related to the biosynthesis of amino acids were upregulated at the LE and S phases. This suggests that an increase in the intracellular content of these amino acids may be part of the adaptive response to the lack of MsrAB.
A protein was considered validated when at least two different peptides were found in the same sample. We found only one peptide assigned to MsrAB and did not validate its presence in the cellular proteome. To determine whether MsrAB is a
FIGURE 4 | Distribution of proteins showing abundance level changes (p < 0.05) between wild-type and 1msrAB mutant strains. Venn diagrams showing the number of regulated intracellular proteins (A) and exoproteins (B) in the 1msrAB mutant in the early exponential (EE), late exponential (LE) and stationary (S) growth phases.
true cellular protein, we carried out further analyses using a Q-exactive HF mass spectrometer. Five and 19 peptides assigned to MsrAB were detected in the cellular proteome of WT and 1msrAB/pHT304msrAB, respectively, at LE and S growth phases (Figure S1) No peptide was detected in the exoproteome, proving that MsrAB is cytoplasmic.
Exoproteome
Table 2lists the exoproteins that were considered as differentially produced in 1msrAB supernatant. The majority of the metabolism and stress/detoxification-related proteins were less abundant in 1msrAB compared with WT, regardless of growth phase. These proteins were predicted to be cytosolic and, accordingly, we found that they were more abundant in the cellular proteome compared with the exoproteome (Table S3). In contrast, the majority of the cell wall/surface-associated proteins, transporters and degradative/adhesin proteins, which were predicted to be secreted proteins, were increased in 1msrAB compared with WT, especially at the EE and LE growth phases. This suggests that msrAB deletion could favor the accumulation of some secreted exoproteins at the expense of cytosolic proteins. Interestingly, two predicted secreted foldases, PrsA1 and PsrA2, showed significant increases in their abundance levels in 1msrAB, especially at LE growth phase. PrsA1 and PrsA2 have been predicted to function as peptidyl-prolyl isomerases at the bacterial membrane–cell wall interface, to assist in the folding
and stability of exported proteins (Vitikainen et al., 2004). In
addition, we noted increased abundance levels of a bacterial type I signal peptidase protein (SPase) in 1msrAB compared with WT at LE phase. SPases function at the terminal step of the general secretory pathway by releasing translocated proteins from the
TABLE 1 | Cellular proteins with significant abundance level changes (|log2|fold-change > 1, p < 0.01) in 1msrAB compared with WT. Functional class NP no. Gene no. Protein
name
Protein description Log2fold-change
EE LE S
Carbohydrate metabolism NA BC5137 Tpi Triosephosphate isomerase −1.50
NP_834982 BC5320 Ccr PTS system, glucose-specific IIA component 1.82
NP_834343 BC4637 Ack acetate kinase 1.09
NP_832706 BC2959 Mqo Malate:quinone oxidoreductase −2.82 NP_831487 BC1712 FumB Fumarate hydratase −2.57
NP_833692 BC3973 PdhA Pyruvate dehydrogenase E1 component alpha subunit 1.02 NP_833555 BC3834 SucC Succinyl-CoA synthetase subunit beta 1.05 Enterotoxin NP_834610 BC5239 EntA Enterotoxin A −4.07 Lipid metabolism NP_830401 BC0584 Acetyltransferase −2.04 Cell wall and cell surface
metabolism
NP_830495 BC0682 SrtA Sortase −3.01
NP_834255 BC4548 IsdA1 Cell surface protein −4.19 Purine metabolism NP_832069 BC2306 BacF Glycine-AMP ligase −3.94
NP_831124 BC1343 QueE Organic radical activating protein 2.63 NP_831122 BC1341 QueC Aluminum resistance protein 3.28 Pyrimidine metabolism NP_833606 BC3886 CarB Carbamoyl phosphate synthase large subunit −4.35
NP_833803 BC4085 Pdp Pyrimidine-nucleoside phosphorylase 2.14 DNA binding and repair NP_831634 BC1861 Helicase −3.15
NP_831628 BC1855 Chromosome segregation ATPase −2.46
NP_834171 BC4459 HsdM Type I restriction-modification system methylation subunit −2.51 NP_831628 BC3769 MutS DNA mismatch repair protein −2.58
Aminoacid metabolism NP_833492 BC1546 Aat Aspartate aminotransferase 1.74 NP_831735 BC1965 ThrC Threonine synthase 3.41 3.13 NP_831736 BC1966 ThrB Homoserine kinase 2.64 3.30 NP_832070 BC2307 Glycine-AMP ligase −3.31
NP_831552 BC1779 IlvC2 Ketol-acid reductoisomerase 1.58 NP_831190 BC1410 HisF Imidazole glycerol phosphate synthase subunit
HisF
2.05
NP_831186 BC1406 HisD Histidinol dehydrogenase 3.41 NP_831734 BC1964 Hom1 Homoserine dehydrogenase 2.86 2.35 NP_830438 BC4331 AroE Shikimate 5-dehydrogenase 2.06
Amino sugar metabolism NP_834865 BC5201 MnaA UDP-N-acetylglucosamine 2-epimerase 1.59 Translation NP_831277 BC1498 RrpsA 30S ribosomal protein S1 −3.21
NP_830015 BC0135 RpsS SSU ribosomal protein 2.06
Motility NP_831407 BC1629 CheC Flagellar motor switch protein −2.38
NP_831428 BC1651 FglE Flagellar hook protein −3.26
NP_831435 BC1658 FlaB Flagellin −2.30
NP_831415 BC1637 FlgL Flagellar hook-associated protein −3.28 NP_834158 BC4446 MreB Rod shape-determining protein 1.05 Rod shape-determining
proteins
NP_834531 BC4831 ABC transporter ATP-binding protein 3.67 Transporters NP_834524 BC4824 ABC transporter ATP-binding protein −2.11 NP_833512 BC3790 Nucleoside transport ATP-binding protein −3.36 NP_830967 BC1182 OppD Oligopeptide transport ATP-binding protein −1.78
NP_832817 BC3071 CutC copper homeostasis protein cutC 3.00 NP_834331 BC4625 UspA Universal stress protein −3.19
Stress response NP_835071 BC5410 AcpD Azoreductase 4.87 5.83 NP_830954 BC1168 ClpB ATP-dependent chaperone −2.99
Chaperones NP_830829 BC1043 PrsA1 Peptidylprolyl isomerase 1.08 NP_833827 BC4109 RibD Diaminohydroxyphosphoribosylaminopyrimidine
deaminase
2.78 2.92 4.42
TABLE 1 | Continued
Functional class NP no. Gene no. Protein name
Protein description Log2fold-change
EE LE S
Riboflavin biosynthesis NP_833829 BC4111 RibA Bifunctional 3,4-dihydroxy-2-butanone 4-phosphate synthase
2.87
NP_833828 BC4110 RibE Riboflavin synthase subunit alpha 2.20 NP_833830 BC4112 RibH Riboflavin synthase subunit beta 1.68
NP_833832 BC4114 BioB Biotin synthase 3.40 Biotin biosynthess NP_831123 BC1342 6-pyruvoyl tetrahydrobiopterin synthase 2.16
Folate biosynthesis NP_833540 BC3819 Dxr2 1-deoxy-D-xylulose 5-phosphate reductoisomerase 2.75 Terpenoid backbone
biosynthesis
NP_831099 BC1317 PhaB Acetoacetyl-CoA reductase −2.53
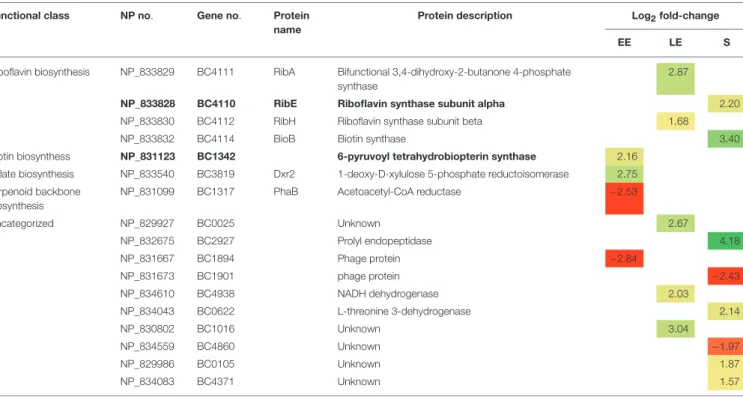
Uncategorized NP_829927 BC0025 Unknown 2.67 NP_832675 BC2927 Prolyl endopeptidase 4.18 NP_831667 BC1894 Phage protein −2.84 NP_831673 BC1901 phage protein −2.43 NP_834610 BC4938 NADH dehydrogenase 2.03 NP_834043 BC0622 L-threonine 3-dehydrogenase 2.14 NP_830802 BC1016 Unknown 3.04 NP_834559 BC4860 Unknown −1.97 NP_829986 BC0105 Unknown 1.87 NP_834083 BC4371 Unknown 1.57
Proteins showing abundance level restored in 1msrAB/pHT304msrAB are indicated in bold. EE, early exponential growth phase; LE, late exponential growth phase; S, stationary growth phase. NA, Not Annotated. Green and red highlights indicate increased and decreased protein levels, respectively.
cytoplasmic membrane at a defined cleavage site (Craney et al.,
2015). This Spase could thus function in conjunction with PrsA
proteins to sustain a higher secretion level of some proteins (Alonzo et al., 2011).
Several proteins classified as degradative enzymes showed higher abundance levels in 1msrAB compared with WT (Table 2) and could contribute to the high protease activity of the 1msrAB extracellular milieu (Figure 3B). Interestingly, we showed that the abundance level of Npr600, a predicted bacillolysin, was restored in 1msrAB/pHT304msrAB at LE phase. Npr600 could thus be a major contributor to the protease activity
of 1msrAB at LE phase (Altincicek et al., 2007).
msrAB
Regulates the Dynamic of the
Met(O) Content of the B. cereus Proteome
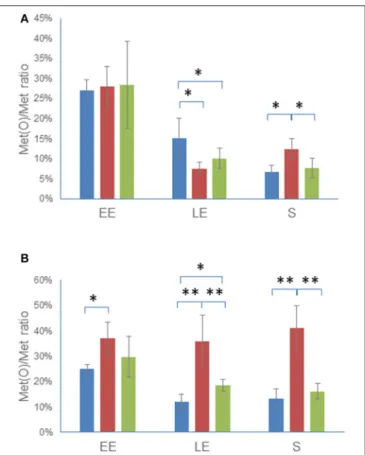
We identified peptides with oxidized Met in 1msrAB, 1msrAB/pHT304msrAB, and WT, in both the cellular proteome and the exoproteome at EE, LE, and S growth phases, as
previously described (Madeira et al., 2015). The Met(O) content
of both the cellular proteome and the exoproteome was estimated by comparing the number of Met(O) to the total number of Met residues identified in each of the three biological samples obtained for each growth phase in each of the three strains (Tables S4, S5). Figure 5 shows that the Met(O) content of WT and 1msrAB/pHT304msrAB decreased similarly in the cellular proteome (Figure 5A) and exoproteome (Figure 5B) during growth. The Met(O) content of the 1msrAB intracellular proteome also decreased during exponential growth and was lower than the Met(O) content of WT at LE phase and higher
at S growth phase. More importantly, the Met(O) content of the 1msrAB exoproteome remained constant during growth and accounted for 38 ± 3% of total Met residues. Taken together, these results indicate that MsrAB regulates the dynamic of the Met(O) content of the proteome, especially at the exoproteome level.
To identify peptides exhibiting significant differences in Met(O) content in 1msrAB compared with WT, we conducted a t-statistical analysis. For a robust analysis, we considered a peptide as containing an oxidized Met residue when it was identified in at least two biological replicates. The lists of intra- and extracellular peptides showing significant Met(O) level
changes (log2fold-change > 1 and p ≤ 0.01) according to growth
phase are presented in Tables 3, 4. Cellular Proteome
The number of peptides with Met(O) content changes was lower at the EE (6) than the LE (13) and S (19) growth phases. Only one peptide, a RibH-related peptide, showed similar changes in the two growth phases (Table 3). At the EE growth phase, we noted that the subunit E2 of the pyruvate dehydrogenase complex (PdhC), which interconnects glycolysis with acetate metabolism, had one peptide with a decreased Met(O) level in EE phase. This could impact the activity of this enzyme and contribute to the metabolic perturbation observed in 1msrAB
at EE phase (Figure 2;Martin et al., 2005). At the LE growth
phase, the majority of the identified peptides showed a lower Met(O) content in 1msrAB compared with WT at LE phase. This is consistent with the results presented in Figure 4. At
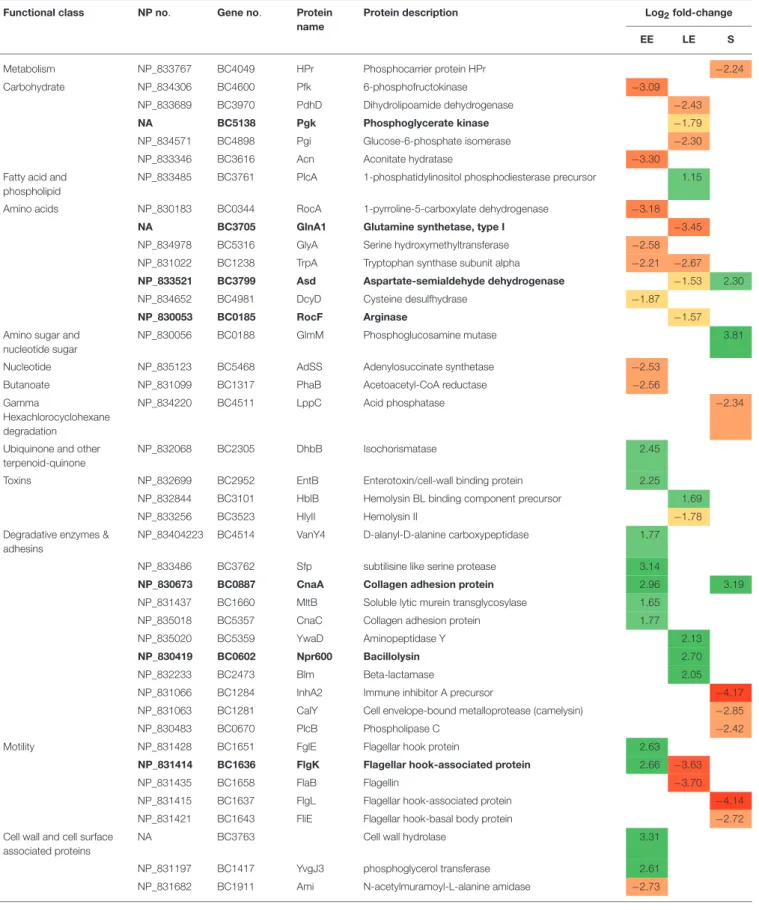
TABLE 2 | Exoproteins with significant abundance level changes (|log2|fold-change > 1, p < 0.01) in 1msrAB compared with WT. Functional class NP no. Gene no. Protein
name
Protein description Log2fold-change EE LE S Metabolism NP_833767 BC4049 HPr Phosphocarrier protein HPr −2.24 Carbohydrate NP_834306 BC4600 Pfk 6-phosphofructokinase −3.09
NP_833689 BC3970 PdhD Dihydrolipoamide dehydrogenase −2.43 NA BC5138 Pgk Phosphoglycerate kinase −1.79 NP_834571 BC4898 Pgi Glucose-6-phosphate isomerase −2.30 NP_833346 BC3616 Acn Aconitate hydratase −3.30 Fatty acid and
phospholipid
NP_833485 BC3761 PlcA 1-phosphatidylinositol phosphodiesterase precursor 1.15 Amino acids NP_830183 BC0344 RocA 1-pyrroline-5-carboxylate dehydrogenase −3.18
NA BC3705 GlnA1 Glutamine synthetase, type I −3.45 NP_834978 BC5316 GlyA Serine hydroxymethyltransferase −2.58 NP_831022 BC1238 TrpA Tryptophan synthase subunit alpha −2.21 −2.67 NP_833521 BC3799 Asd Aspartate-semialdehyde dehydrogenase −1.53 2.30 NP_834652 BC4981 DcyD Cysteine desulfhydrase −1.87
NP_830053 BC0185 RocF Arginase −1.57
Amino sugar and nucleotide sugar
NP_830056 BC0188 GlmM Phosphoglucosamine mutase 3.81 Nucleotide NP_835123 BC5468 AdSS Adenylosuccinate synthetase −2.53
Butanoate NP_831099 BC1317 PhaB Acetoacetyl-CoA reductase −2.56 Gamma
Hexachlorocyclohexane degradation
NP_834220 BC4511 LppC Acid phosphatase −2.34
Ubiquinone and other terpenoid-quinone
NP_832068 BC2305 DhbB Isochorismatase 2.45 Toxins NP_832699 BC2952 EntB Enterotoxin/cell-wall binding protein 2.25
NP_832844 BC3101 HblB Hemolysin BL binding component precursor 1.69 NP_833256 BC3523 HlyII Hemolysin II −1.78 Degradative enzymes &
adhesins
NP_83404223 BC4514 VanY4 D-alanyl-D-alanine carboxypeptidase 1.77 NP_833486 BC3762 Sfp subtilisine like serine protease 3.14
NP_830673 BC0887 CnaA Collagen adhesion protein 2.96 3.19 NP_831437 BC1660 MltB Soluble lytic murein transglycosylase 1.65
NP_835018 BC5357 CnaC Collagen adhesion protein 1.77 NP_835020 BC5359 YwaD Aminopeptidase Y 2.13 NP_830419 BC0602 Npr600 Bacillolysin 2.70 NP_832233 BC2473 Blm Beta-lactamase 2.05 NP_831066 BC1284 InhA2 Immune inhibitor A precursor −4.17 NP_831063 BC1281 CalY Cell envelope-bound metalloprotease (camelysin) −2.85 NP_830483 BC0670 PlcB Phospholipase C −2.42 Motility NP_831428 BC1651 FglE Flagellar hook protein 2.63
NP_831414 BC1636 FlgK Flagellar hook-associated protein 2.66 −3.63
NP_831435 BC1658 FlaB Flagellin −3.70
NP_831415 BC1637 FlgL Flagellar hook-associated protein −4.14 NP_831421 BC1643 FliE Flagellar hook-basal body protein −2.72 Cell wall and cell surface
associated proteins
NA BC3763 Cell wall hydrolase 3.31
NP_831197 BC1417 YvgJ3 phosphoglycerol transferase 2.61 NP_831682 BC1911 Ami N-acetylmuramoyl-L-alanine amidase −2.73
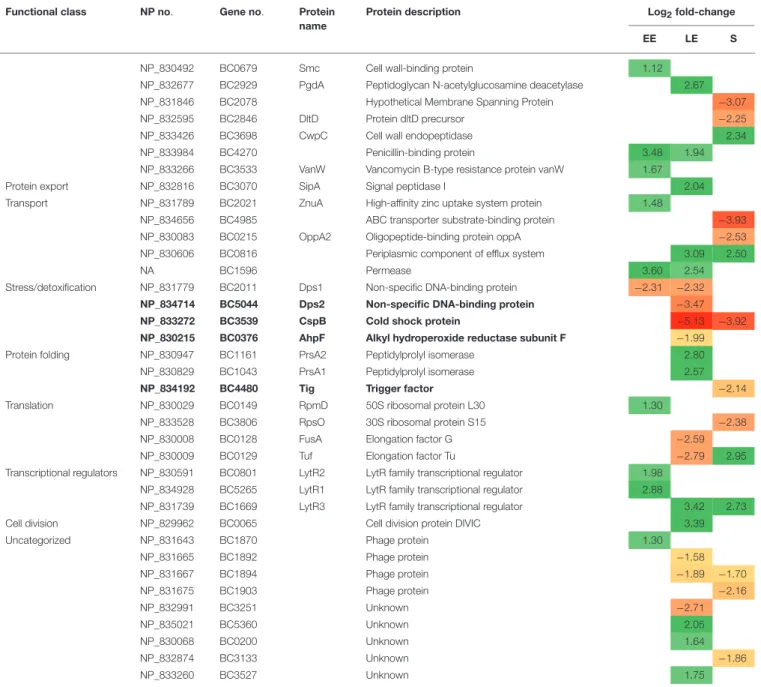
TABLE 2 | Continued
Functional class NP no. Gene no. Protein name
Protein description Log2fold-change EE LE S NP_830492 BC0679 Smc Cell wall-binding protein 1.12
NP_832677 BC2929 PgdA Peptidoglycan N-acetylglucosamine deacetylase 2.67 NP_831846 BC2078 Hypothetical Membrane Spanning Protein −3.07 NP_832595 BC2846 DltD Protein dltD precursor −2.25 NP_833426 BC3698 CwpC Cell wall endopeptidase 2.34 NP_833984 BC4270 Penicillin-binding protein 3.48 1.94 NP_833266 BC3533 VanW Vancomycin B-type resistance protein vanW 1.67 Protein export NP_832816 BC3070 SipA Signal peptidase I 2.04 Transport NP_831789 BC2021 ZnuA High-affinity zinc uptake system protein 1.48
NP_834656 BC4985 ABC transporter substrate-binding protein −3.93 NP_830083 BC0215 OppA2 Oligopeptide-binding protein oppA −2.53 NP_830606 BC0816 Periplasmic component of efflux system 3.09 2.50
NA BC1596 Permease 3.60 2.54
Stress/detoxification NP_831779 BC2011 Dps1 Non-specific DNA-binding protein −2.31 −2.32 NP_834714 BC5044 Dps2 Non-specific DNA-binding protein −3.47 NP_833272 BC3539 CspB Cold shock protein −5.13 −3.92 NP_830215 BC0376 AhpF Alkyl hydroperoxide reductase subunit F −1.99 Protein folding NP_830947 BC1161 PrsA2 Peptidylprolyl isomerase 2.80 NP_830829 BC1043 PrsA1 Peptidylprolyl isomerase 2.57 NP_834192 BC4480 Tig Trigger factor −2.14 Translation NP_830029 BC0149 RpmD 50S ribosomal protein L30 1.30
NP_833528 BC3806 RpsO 30S ribosomal protein S15 −2.38 NP_830008 BC0128 FusA Elongation factor G −2.59 NP_830009 BC0129 Tuf Elongation factor Tu −2.79 2.95 Transcriptional regulators NP_830591 BC0801 LytR2 LytR family transcriptional regulator 1.98
NP_834928 BC5265 LytR1 LytR family transcriptional regulator 2.88
NP_831739 BC1669 LytR3 LytR family transcriptional regulator 3.42 2.73 Cell division NP_829962 BC0065 Cell division protein DIVIC 3.39 Uncategorized NP_831643 BC1870 Phage protein 1.30
NP_831665 BC1892 Phage protein −1.58 NP_831667 BC1894 Phage protein −1.89 −1.70 NP_831675 BC1903 Phage protein −2.16 NP_832991 BC3251 Unknown −2.71 NP_835021 BC5360 Unknown 2.05 NP_830068 BC0200 Unknown 1.64 NP_832874 BC3133 Unknown −1.86 NP_833260 BC3527 Unknown 1.75
Exoproteins with abundance level restored in 1msrAB/pHT304msrAB are indicated in bold. EE, early exponential growth phase; LE, late exponential growth phase; S, stationary growth phase. NA, Not Annotated. Green and red highlights indicate increased and decreased protein levels, respectively.
the S growth phase, the majority of the identified peptides (12/18) showed a higher Met(O) level in 1msrAB compared with WT. Among these 12 peptides, 6 are RibH-related peptides. Two of these six peptides had their Met(O) level restored in 1msrAB/pHT304msrAB (Table 3). RibH contains four Met residues: all of these were more highly oxidized in 1msrAB than in WT at the S growth phase and two were more highly oxidized in 1msrAB than in 1msrAB/pHT304msrAB. RibH is thus a target of MsrAB activity and the major contributor to the difference observed between 1msrAB and WT on the one hand, and 1msrAB and 1msrAB/pHT304msrAB on the other, at the S growth phase (Figure 5).
Exoproteome
Table 4 shows that peptides with differential Met(O) contents belong to 21 proteins, including eight toxin-related proteins. The LE growth phase sustained the highest number of peptides with increased Met(O) levels (10); the majority of these peptides (9/10) had their Met(O) level restored in 1msrAB/pHT304msrAB, indicating a direct impact of MsrAB. Among the proteins with increased oxidation of Met residues were the degradative enzyme, PlcA, the flagellin, FlaA, and the four toxin-related proteins, NheA, HblB, EntC and EntD. Only PlcA and HblB showed increased abundance levels at LE growth phase (Table 2). FlaB was the protein for which we detected the largest number of
FIGURE 5 | Dynamics of Met(O) content in 1msrAB mutant cells and complemented 1msrAB/pHT304msrAB cells. WT (blue), 1msrAB (red), and 1msrAB/pHT304msrAB (green) were grown in MOD medium as described in Figure 2. The cells were harvested at EE, LE and S growth phases. The Met(O) content of the intracellular proteome (A) and exoproteome (B) was calculated as the percentage of the number of Met(O) vs. the total number of Met residues. Data are the means of triplicate measures obtained from three independent cultures at the EE, LE, and S growth phases. Significant differences between two strains are indicated with one (p < 0.05) or two (p < 0.01) asterisks.
Met(O) peptides and Met residues with differential oxidation (7 Met residues). All of these residues were less oxidized in 1msrAB compared with WT at LE phase. In addition, we observed that FlaB was less abundant in 1msrAB at LE phase (Table 2). The loss of Met-oxidized peptides could thus be due to degradation of protein copies. This is possibly also the case for HlyII (Tables 2,
4). In S growth phase, the peptides with increased Met(O) content
belong to the putative N-acetylmuramoyl-L-alanine amidase CwlC and the toxin-related EntA, HblB, and HblL2. All HblL2-bound Met were not equally susceptible to msrAB disruption, as one Met residue was more oxidized at the S growth phase, one was more oxidized at the LE growth phase and two were less oxidized, especially at the EE growth phase. Taken together, the results indicate that MsrAB regulates the dynamic of the Met(O) level of the exoproteome by controlling the Met(O) level of target peptides in a growth phase- and protein-dependent manner. Importantly, our results indicate that virulence factors such enterotoxins, degradative enzymes, and flagella components are MsrAB targets.
DISCUSSION
Methionine (Met) residues in proteins and their recycling by methionine sulfoxide reductases (Msrs) are part of the antioxidant system produced by aerobic microorganisms. The antioxidant system keeps a steady-state control over ROS
production-detoxification (Levine et al., 1996; Kim, 2013).
The tight regulation of ROS production and detoxification represents the basis for the maintenance of an appropriate redox homeostasis, which is central for growth.
While Met residues in cellular proteins are well-recognized as antioxidants, the relative importance of Met residues in extracellular proteins has hitherto not been established. In this study, we used next-generation proteomics on wild-type B. cereus and an MsrAB mutant to demonstrate that Met residues in exoproteins could be reversibly oxidized to Met(O), probably before their exportation. In addition, we provide the first evidence that B. cereus can modulate its capacity and specificity for protein export (secretion) through the growth phase-dependent expression of the methionine sulfoxide reductase-encoding gene, msrAB.
As reported for other msr genes in several bacteria, msrAB expression is lower in exponentially grown B. cereus cells than in growth-arrested cells. The low level of msrAB expression is probably sufficient to maintain a proper activity of the antioxidant system during exponential growth phase. The increased expression of msrAB at the end of growth would serve to minimize the accumulation of oxidative damage on
ROS-affected molecules (Dukan and Nystrom, 1999). However,
the expression level of msrAB in B. cereus cells is not by itself sufficient to prevent premature growth arrest under full aerobic conditions as growth can be prolonged by overproducing msrAB. In WT cells, premature growth arrest allows the cells to survive for extended time periods, suggesting that MsrAB
could be a regulator of normal lifespan of B. cereus (Koc et al.,
2004).
Considering the primary antioxidant function of MsrAB, variation of other antioxidant proteins was expected in MsrAB-deficient cells as a part of putative compensatory mechanisms
or due to altered interactions with MsrAB (Alamuri and
Maier, 2006). We observed abundance level changes in antioxidant proteins, mainly at LE phase, due to the lack of protection normally conferred by the high expression of msrAB. Neutralizing ROS without quelling its production may prove to be onerous to B. cereus. Our results indicate that B. cereus reprograms its proteome to both counteract and inhibit the formation of ROS in msrAB-deficient cells. This proteome modification leads to novel metabolic networks that allow the alleviation of TCA cycle activity, the main metabolic network that supplies NADH for oxidative phosphorylation. When the machinery involved in oxidative phosphorylation is severely impeded by the ROS challenge, glucose uptake is enhanced to satisfy the ATP need by substrate level phosphorylation. Increased carbon flow also maintains constant levels of glycolytic intermediates as macromolecular precursors and boosts carbon flow through the PPP, which produces large amount of NADPH, a key molecule that is used to
T A B L E 3 | C e llu la r p e p tid e s w ith si g n ific a n t M e t( O ) le ve lc h a n g e s (|l o g2 |fo ld -c h a n g e> 1 , p < 0 .0 1 ) in 1 m s rA B c o m p a re d w ith W T. G e n e n o N P n o P ro te in n a me D e s c ri p ti o n P e p ti d e n a me M e t( O ) p e ti d e d e te c te d b y G C -M S /M S lo g2 fo ld -c h a n g e E E L E S G ly c o ly si s B C 3 9 7 1 N P _8 3 3 6 9 0 P d h C A lp h a -k e to a c id d e h yd ro g e n a s, e su b u n it E 2 P d h C _2 H TA P H V T L M D E V D V T E LV A H R − 2 .3 2 A m in o su g a r a n d n u c le o tid e su g a r m e ta b o lis m B C 5 2 8 8 N P _8 3 4 9 5 1 M u rA U D P -N -a c e ty lg lu c o sa m in e 1 -c a rb o xy vi n yl tr a n sf e ra se M u rA _1 A S V Q V M G P L L A R 2 .3 8 A m in o a c id m e ta b o lis m B C 1 2 3 8 N P _8 3 1 0 2 2 Tr p A Tr yp to p h a n sy n th a se , su b u n it α Tr p A _4 E V Q M P F V L M T Y L N P V L A F G K − 1 .6 9 B C 1 2 3 7 N P _8 3 1 0 2 1 Tr p B Tr yp to p h a n sy n th a se , su b u n it β Tr p B _1 E T P LY Y A E N M T K − 1 .5 7 B C 1 2 3 2 N P _8 3 1 0 1 6 Tr p E A n th ra n ila te sy n th a se c o m p o n e n t I Tr p E _2 A M E IIN E L E N E K R − 1 .0 2 Tr a n sc rip tio n a lr e g u la to rs B C 0 1 0 2 N P _8 2 9 9 8 3 C lp C N e g a tiv e re g u la to r o f g e n e tic c o m p e te n c e C lp C _6 V IE L S M D E A R − 3 .2 9 C lp C _8 V M T L D M G T V V A G T K − 1 .9 9 C lp C _9 V M T L D M G T V V A G T K − 2 .4 0 B C 0 6 1 3 N P _8 3 0 4 3 0 A rs R 1 A rs R fa m ily tr a n sc rip tio n a lr e g u la to r A rs R 1 _1 IS E E D V Q M L R 1 .5 1 S tr e ss re sp o n se B C 5 0 4 4 N P _8 3 4 7 1 4 D p 2 N o n -s p e c ific D N A -b in d in g p ro te in D p s2 _1 2 K G M E IA Q D S D D E M T S D L L L G IY T E L E K H A W M L R − 1 .8 6 N P _8 3 4 7 1 4 D p s2 _9 G M E IA Q D S D D E M T S D L L L G IY T E L E K H A W M L R − 2 .2 0 B C 0 3 7 7 N P _8 3 0 2 1 6 A h p C A lk yl h yd ro p e ro xi d e re d u c ta se C 2 2 A h p C _3 IE Y I M IG D P T R − 2 .3 4 B C 0 3 7 6 N P _8 3 0 2 1 5 A h p F A lk yl h yd ro p e ro xi d e re d u c ta se su b u n it F A h p F _1 8 V S A G D D N V S K D M L A LV D E L A T M S S K 1 .1 4 B C 1 1 5 5 N P _8 3 0 9 4 1 K a tE C a ta la se K a tE _5 M N P N N R LT T N Q G A P V G D N Q N S R TA G R 2 .0 0 C h a p e ro n e B C 0 2 9 5 N P _8 3 0 1 4 6 G ro E L C h a p e ro n e G ro E L _2 3 S A L Q N A A S V A A M F LT T E A V V A D K P E P N A P A M P D M G G M G M G G M G G M M − 1 .6 7 G ro E L _3 0 S A L Q N A A S V A A M F LT T E A V V A D K P E P N A P A M P D M G G M G M G G M G G M M − 1 .5 1 B C 1 0 4 3 N P _8 3 0 8 2 9 P rs A 1 P e p tid yl p ro ly li so m e ra se P rs A 1 _6 Q V L N N M V M E K − 1 .5 9 R ib o fla vi n m e ta b o lis m B C 4 1 1 2 N P _8 3 3 8 3 0 R ib H R ib o fla vi n sy n th a se , su b u n it β R ib H _1 A G N K G Y E S A V A A IE M A H L S K 2 .8 8 R ib H _3 A G T K A G N K G Y E S A V A A IE M A H L S K 1 .9 8 2 .3 6 R ib H _4 G V A S L S L Q M D IP V IF G V LT T E T IE Q A IE R 2 .7 5 R ib H _5 G Y E S A V A A IE M A H L S K 2 .2 1 R ib H _8 M A S S G K Y D A V IT L G T V IR 1 .9 3 R ib H _9 M V F E G H LV G T G L K 1 .9 2 B C 4 1 1 0 N P _8 3 3 8 2 8 R ib E R ib o fla vi n sy n th a se , su b u n it α R ib E _2 V G S M T E S F L Q E N G F L 1 .3 2 R ib o so m e c o m p o n e n ts B C 0 1 4 6 N P _8 3 0 0 2 6 R p lF 5 0 S rib o so m a lp ro te in L 6 R p lF _1 A L IG N M V E G V T E G FA R − 1 .8 1 B C 3 8 2 5 N P _8 3 3 5 4 6 R p sB 3 0 S rib o so m a lp ro te in S 2 R p sB _1 A G M Y F V N Q R − 2 .9 3 B C 0 1 3 5 N P _8 3 0 0 1 5 R p sS S S U rib o so m a lp ro te in S 1 9 P R p sS _4 K H V P V Y IT E D M V G H K 2 .2 0 Tr a n sl a tio n a p p a ra tu s B C 0 1 2 9 N P _8 3 0 0 0 9 Tu f E lo n g a tio n fa c to r Tu f_ 1 E T D K P F L M P V E D V F S IT G R − 1 .9 0 Tu f_ 2 1 T T D V T G IIQ L P E G T E M V M P G D N IE M T IE L IA P IA IE E G T K − 1 .7 6 Tu f_ 3 0 V G D V V E IIG L A E E N A S T T V T G V E M F R K 1 .5 7 Tu f_ 5 IIE L M A E V D A Y IP T P E R E T D K P F L M P V E D V F S IT G R − 2 .9 5 D e g ra d a tiv e e n zy m e B C 1 9 9 1 N P _8 3 1 7 6 0 T g C M u re in e n d o p e p tid a se T g C _2 N I M D Q LY G E F N K − 1 .9 4 M o til ity B C 1 6 5 4 N P _8 3 1 4 3 1 C h e V C h e m o ta xi s p ro te in C h e V _3 V IY IA E D S A M L R 1 .7 5 U n c a te g o riz e d B C 1 2 2 5 N P _8 3 1 0 0 9 – U n kn o w n B C 1 2 2 5 _1 M K L G IV IF P S K 1 .7 0 B C 4 0 4 5 N P _8 3 3 7 6 3 – N A D (P )H n itr o re d u c ta se B C 4 0 4 5 M S V E Q V S E W A K 1 .1 4 B C 4 1 8 2 N P _8 3 3 8 9 6 G ls 2 4 U n kn o w n G ls 2 4 _3 A E H M L D M G Q D T T L G K V E IA P E V IE V IA G IA A A E V E G V A A M R − 1 .0 2 P e pti de s w ith Me t( O )le ve ls re s to re d in 1 m s rA B /pH T304-m s rA B a re in di c a te d in bol d. Me t re s idu e s th a t a re di ff e re n ti a lly ox idi ze d a re in di c a te d in re d. EE, e a rl y e xpon e n ti a lgr ow th ph a s e ; L E, la te e xpon e n ti a lgr ow th ph a s e ; S , s ta ti on a ry g ro w th ph a s e . N A , N o t a n n o ta te d. G re e n a n d re d h igh ligh ts in di c a te in c re a s e d a n d de c re a s e d pr ote in le ve ls , re s pe c ti ve ly .
T A B L E 4 | E xo p e p tid e s w ith si g n ific a n t M e t( O ) le ve lc h a n g e s (|l o g2 |fo ld -c h a n g e > 1 , p < 0 .0 1 ) in 1 m s rA B c o m p a re d w ith W T. F u n c ti o n a l c la s s G e n e n o N P n o P ro te in n a me D e s c ri p ti o n P e p ti d e n a me M e t( O ) p e ti d e d e te c te d b y G C -M S /M S lo g2 fo ld -c h a n g e E E L E S C a rb o h yd ra te m e ta b o lis m B C 5 1 3 5 N P _8 3 4 8 0 3 E n o E n o la se E n o _2 L G A N A IL G V S M A V A H A A A D F V G L P LY R − 2 .8 3 − 2 .6 7 − 2 .7 3 [-0 .8 p t] [-1 p t] A m in o a c id m e ta b o lis m B C 0 3 4 4 N P _8 3 0 1 8 3 R o c A 1 -p yr ro lin e -5 -c a rb o xy la te d e h yd ro g e n a se R o c A _4 F M E V L E E A G L P A G V V N F V P G N G S E V G D Y LV D H P R − 2 .0 2 Tr a n sl a tio n B C 0 1 1 9 N P _8 3 0 0 0 0 R p lJ R ib o so m a lp ro te in L 1 0 R p lJ E G L L S M L L S V L Q A P IR − 2 .2 1 C e ll w a ll a n d c e ll su rf a c e m e ta b o lis m B C 5 2 3 4 N P _8 3 4 8 9 7 C w lC N -a c e ty lm u ra m o yl -L -a la n in e a m id a se C w lC _1 S G P S H M G IY L G G G S F IQ A G D K 2 .4 4 B C 0 6 7 9 N P _8 3 0 4 9 2 S m c C e ll w a ll p ro te in S m c _3 M N A V S T IL E A D K E IL R 2 .3 5 S m c _1 G Y N LT A N P G M K 1 .8 0 E n te ro to xi n s B C 5 2 3 9 N P _8 3 4 9 0 2 E n tA E n te ro to xi n A E n tA _2 V LT A M G H D LT A N P N M K − 1 .7 4 E n tA _1 V LT A M G H D LT A N P N M K − 2 .4 7 E n tA _3 V LT A M G H D LT A N P N M K 1 .8 7 B C 0 8 1 3 N P _8 3 0 6 0 3 E n tC E n te ro to xi n C E n tC _1 G N K ID V L M P D K 2 .3 2 E n tC _3 ID V L M P D K 1 .6 5 B C 3 7 1 6 N A E n tD E n te ro to xi n D E n tD _1 V LT A M G H D LT A N P N M K 1 .7 7 B C 3 1 0 2 N P _8 3 2 8 4 5 H b lB H B L , c o m p o n e n t B H b lB _6 S M N A Y S Y M L IK 2 .3 9 H b lB _2 Q L E S D G F N V M K 2 .2 1 B C 3 1 0 4 N P _8 3 2 8 4 7 H b lL 2 H b l, c o m p o n e n t L 1 H b lL 2 _7 L IQ T Y ID Q S L M S P N V Q L E E V T A L N T N Q F L IK − 3 .1 0 − 1 .8 7 − 2 .1 8 H b lL 2 _9 S M L L LT Q N D L H T F A N Q ID V E L D L L K − 2 .2 1 H b lL 2 _1 0 S M L L LT Q N D L H T F A N Q ID V E L D L L K R − 2 .4 9 − 1 .9 3 H b lL 2 _1 2 T Q E Y D L M K V ID T E K 1 .9 6 H b lL 2 _8 Q D M K E W S S E LY P Q L IL L N S K 2 .0 9 B C 3 5 2 3 N P _8 3 3 2 5 6 H ly II H e m o ly si n II H ly II_ 1 A L E E Q M N S IN S V N D K L N K − 2 .2 1 B C 1 8 0 9 N P _8 3 1 5 8 2 N h e A N h e c o m p o n e n t A N h e A _2 L ID L N Q E M M R 2 .2 1 B C 1 8 1 0 N P _8 3 1 5 8 3 N h e B N h e , c o m p o n e n t B N h e B _3 T Q T E Y LT N T ID T A IT A L Q N IS N Q W Y T M G S K − 2 .2 1 − 2 .2 7 − 1 .6 5 N h e B _2 T G S N A L V M D LY A LT II K − 1 .7 6 F la g e lla B C 1 6 5 7 N P _8 3 1 4 3 4 F la A F la g e lli n F la A _9 L D H N L N N V T S Q A T N M A S A A S Q IE D A D M A K − 2 .2 1 − 1 .6 7 F la A _6 IL N E A G IS M L S Q A N Q T P Q M V S K 2 .9 2 F la A _5 IL N E A G IS M L S Q A N Q T P Q M V S K 2 .1 9 F la A _4 IL N E A G IS M L S Q A N Q T P Q M V S K 1 .7 8 F la A _2 0 M R IN T N IN S M R − 1 .7 8 B C 1 6 5 8 N P _8 3 1 4 3 5 F la B F la g e lli n F la B _7 IL N E A G IS M L S Q A N Q T P Q M V S K − 2 .7 7 F la B _8 IL N E A G IS M L S Q A N Q T P Q M V S K − 2 .7 7 F la B _9 IL N E A G IS M L S Q A N Q T P Q M V S K − 2 .7 7 F la B _1 4 L D H N L N N V T S Q A T N M A A A A S Q IE D A D M A K E M S E M T K − 2 .2 9 F la B _1 1 L D H N L N N V T S Q A T N M A A A A S Q IE D A D M A K − 2 .0 3 F la B _1 5 L D H N L N N V T S Q A T N M A A A A S Q IE D A D M A K E M S E M T K − 1 .6 7 F la B _1 2 L D H N L N N V T S Q A T N M A A A A S Q IE D A D M A K − 1 .3 4 F la B _2 6 T N F N G N S F L D T TA T P P G K D IE IQ L S D A S G D T M T L K − 1 .5 2 − 2 .0 6 (C o n ti n u e d )
T A B L E 4 | C o n tin u e d F u n c ti o n a l c la s s G e n e n o N P n o P ro te in n a me D e s c ri p ti o n P e p ti d e n a me M e t( O ) p e ti d e d e te c te d b y G C -M S /M S lo g2 fo ld -c h a n g e E E L E S D e g ra d a tiv e e n zy m e s B C 2 7 3 5 N P _8 3 2 4 8 8 . N p rP 2 B a c ill o ly si n N p rP 2 _3 F E A A T P N Y V S G T Y LV N A Q N G D M L K − 1 .6 1 B C 3 7 6 1 N P _8 3 3 4 8 5 P lc A 1 -p h o sp h a tid yl in o si to l p h o sp h o d ie st e ra se p re c u rs o r P lc A _4 W M Q P IP D N IP L A R 2 .3 9 B C 1 9 9 1 N P _8 3 1 7 6 0 T g C P u ta tiv e m u re in e n d o p e p tid a se T g C _3 N I M D Q LY G E F N K IV D A D E Y V K − 2 .0 9 T g C _1 0 Y K Q S M D G T M Q D IK K − 2 .3 1 T g C _2 N I M D Q LY G E F N K 1 .1 5 B C 5 1 3 5 N P _8 3 4 8 9 5 Y vg J2 p h o sp h o g ly c e ro lt ra n sf e ra se Y v g J 2 _2 D IE Y F D Q S ID M L K 2 .1 8 U n c a te g o riz e d B C 2 0 7 7 N P _8 3 1 8 4 5 B C 2 0 7 7 E S A T-6 -l ik e p ro te in B C 2 0 7 7 V Q N FA Q L L Q E IN M Q L N K − 2 .4 7 B C 1 8 9 4 N P _8 3 1 6 6 7 B C 1 8 9 4 P h a g e p ro te in B C 1 8 9 4 _1 Q D TA A G Y Q IL S F V S D L P G G A IS S V V V D L N M P K − 2 .1 8 Ex o pe pti de s w ith Me t( O ) le ve ls re s to re d in 1 m s rA B /pH T304m s rA B a re in di c a te d in bol d. Me t re s idu e s th a t a re di ff e re n ti a lly ox idi ze d a re in di c a te d in re d. EE, e a rl y e xpon e n ti a l gr ow th ph a s e ; L E, la te e xpon e n ti a l gr ow th ph a s e ; S , s ta ti o n a ry g ro w th ph a s e . N A , N o t a n n o ta te d. G re e n a n d re d h igh ligh ts in di c a te in c re a s e d a n d de c re a s e d pr ote in le ve ls , re s pe c ti ve ly .
drive anabolic processes and provides the reducing power to the antioxidative system. PPP is also required for synthesis
of the low-molecular-weight bacillithiol (Richardson et al.,
2015).
When msrAB is disrupted, B. cereus accumulates a higher level of Met(O) exoproteins in the growth medium and a lower level of Met(O) cellular protein at LE phase. This suggests that B. cereus can overcome the lack of MsrAB activity by promoting export of Met(O) proteins to maintain intracellular redox homeostasis. Our results indicate that MsrAB deficiency promotes export of some proteins by directly or indirectly modulating the efficiency of the translocation/secretion machinery. Among these proteins are proteases, which probably contribute to the high proteolytic activity of the growth medium of msrAB-deficient cells and the highly reduced exoprotein level at the end of growth (Figure 3). Upregulation of proteases has been reported in several bacteria as part of the secretion stress response, which is induced to prevent the accumulation of
misfolded proteins outside the cytoplasmic membrane (Westers
et al., 2006). MsrAB deficiency leads to the accumulation of oxidized proteins, and oxidation can induce protein misfolding (Tarrago et al., 2012). Thus, MsrAB deficiency may trigger a secretion stress response likely to degrade the misfolded proteins, which could interfere with the correct functionality
of the cell (Sarvas et al., 2004). In conclusion, msrAB
expression may prevent extracellular accumulation of faulty proteins to avoid negative effects in the exported/secreted proteins.
We have shown previously that Met residues in toxin-related proteins may act as ROS scavengers before being secreted (Madeira et al., 2015), and we report here that Met(O) in toxin-related proteins are MsrAB substrates. This indicates that Met residues in toxin-related proteins contribute to the
endogenous antioxidant system (Levine et al., 1996, 1999; Luo
and Levine, 2009; Kim, 2013), and thus to the cellular redox
homeostasis of B. cereus (Duport et al., 2016). The reversible
oxidation of Met to Met(O) has been suggested to be a
mechanism for modulating protein activity (Kanayama et al.,
2002). Therefore, catalyzed reduction of Met(O) in toxin-related
proteins could be an antioxidant mechanism and a protein regulatory mechanism. This raises important questions about the role of this modification in the biological activity of toxins, and thus in the cytotoxicity of B. cereus according to growth phase.
AUTHOR CONTRIBUTIONS
JM and CD designed the whole experiments. BA and JA helped to design proteomic experiments. JM carried out experiments. CD wrote the manuscript and all authors approved the final manuscript.
SUPPLEMENTARY MATERIAL
The Supplementary Material for this article can be found online at: http://journal.frontiersin.org/article/10.3389/fmicb. 2017.01342/full#supplementary-material
REFERENCES
Abbas, C. A., and Sibirny, A. A. (2011). Genetic control of biosynthesis and transport of riboflavin and flavin nucleotides and construction of robust biotechnological producers. Microbiol. Mol. Biol. Rev. 75, 321–360. doi: 10.1128/MMBR.00030-10
Alamuri, P., and Maier, R. J. (2004). Methionine sulphoxide reductase is an important antioxidant enzyme in the gastric pathogen Helicobacter pylori. Mol. Microbiol. 53, 1397–1406. doi: 10.1111/j.1365-2958.2004.04190.x
Alamuri, P., and Maier, R. J. (2006). Methionine sulfoxide reductase in Helicobacter pylori: interaction with methionine-rich proteins and stress-induced expression. J. Bacteriol. 188, 5839–5850. doi: 10.1128/JB.00430-06 Alonzo, F. III, Xayarath, B., Whisstock, J. C., and Freitag, N. E. (2011). Functional
analysis of the Listeria monocytogenes secretion chaperone PrsA2 and its multiple contributions to bacterial virulence. Mol. Microbiol. 80, 1530–1548. doi: 10.1111/j.1365-2958.2011.07665.x
Altincicek, B., Linder, M., Linder, D., Preissner, K. T., and Vilcinskas, A. (2007). Microbial metalloproteinases mediate sensing of invading pathogens and activate innate immune responses in the lepidopteran model host Galleria mellonella. Infect. Immun. 75, 175–183. doi: 10.1128/IAI.01385-06
Arantes, O., and Lereclus, D. (1991). Construction of cloning vectors for Bacillus thuringiensis. Gene 108, 115–119. doi: 10.1016/0378-1119(91)90495-W Arnaud, M., Chastanet, A., and Debarbouille, M. (2004). New vector for
efficient allelic replacement in naturally nontransformable, low-GC-content, gram-positive bacteria. Appl. Environ. Microbiol. 70, 6887–6891. doi: 10.1128/AEM.70.11.6887-6891.2004
Banerjee, A., Adolph, R. S., Gopalakrishnapai, J., Kleinboelting, S., Emmerich, C., Steegborn, C., et al. (2015). A universal stress protein (USP) in mycobacteria binds cAMP. J. Biol. Chem. 290, 12731–12743. doi: 10.1074/jbc.M115.644856 Beloin, C., Valle, J., Latour-Lambert, P., Faure, P., Kzreminski, M.,
Balestrino, D., et al. (2004). Global impact of mature biofilm lifestyle on Escherichia coli K-12 gene expression. Mol. Microbiol. 51, 659–674. doi: 10.1046/j.1365-2958.2003.03865.x
Brynildsen, M. P., Winkler, J. A., Spina, C. S., Macdonald, I. C., and Collins, J. J. (2013). Potentiating antibacterial activity by predictably enhancing endogenous microbial ROS production. Nat. Biotechnol. 31, 160–165. doi: 10.1038/nbt.2458 Chubukov, V., and Sauer, U. (2014). Environmental dependence of stationary-phase metabolism in Bacillus subtilis and Escherichia coli. Appl. Environ. Microbiol. 80, 2901–2909. doi: 10.1128/AEM.00061-14
Clair, G., Lorphelin, A., Armengaud, J., and Duport, C. (2013). OhrRA functions as a redox-responsive system controlling toxinogenesis in Bacillus cereus. J. Proteomics 94, 527–539. doi: 10.1016/j.jprot.2013.10.024
Clair, G., Roussi, S., Armengaud, J., and Duport, C. (2010). Expanding the known repertoire of virulence factors produced by Bacillus cereus through early secretome profiling in three redox conditions. Mol. Cell. Proteomics 9, 1486–1498. doi: 10.1074/mcp.M000027-MCP201
Craney, A., Dix, M. M., Adhikary, R., Cravatt, B. F., and Romesberg, F. E. (2015). An alternative terminal step of the general secretory pathway in Staphylococcus aureus. MBio 6:e01178–15. doi: 10.1128/mBio.01178-15
Dedieu, A., Gaillard, J. C., Pourcher, T., Darrouzet, E., and Armengaud, J. (2011). Revisiting iodination sites in thyroglobulin with an organ-oriented shotgun strategy. J. Biol. Chem. 286, 259–269. doi: 10.1074/jbc.M110.159483 De Groot, A., Dulermo, R., Ortet, P., Blanchard, L., Guerin, P., Fernandez,
B., et al. (2009). Alliance of proteomics and genomics to unravel the specificities of Sahara bacterium Deinococcus deserti. PLoS Genet. 5:e1000434. doi: 10.1371/journal.pgen.1000434
Drazic, A., and Winter, J. (2014). The physiological role of reversible
methionine oxidation. Biochim. Biophys. Acta 1844, 1367–1382.
doi: 10.1016/j.bbapap.2014.01.001
Dukan, S., and Nystrom, T. (1999). Oxidative stress defense and deterioration of growth-arrested Escherichia coli cells. J. Biol. Chem. 274, 26027–26032. doi: 10.1074/jbc.274.37.26027
Dupierris, V., Masselon, C., Court, M., Kieffer-Jaquinod, S., and Bruley, C. (2009). A toolbox for validation of mass spectrometry peptides identification and generation of database: IRMa. Bioinformatics 25, 1980–1981. doi: 10.1093/bioinformatics/btp301
Duport, C., Jobin, M., and Schmitt, P. (2016). Adaptation in Bacillus cereus: from stress to disease. Front. Microbiol. 7:1550. doi: 10.3389/fmicb.2016.01550
Duport, C., Zigha, A., Rosenfeld, E., and Schmitt, P. (2006). Control of enterotoxin gene expression in Bacillus cereus F4430/73 involves the redox-sensitive ResDE signal transduction system. J. Bacteriol. 188, 6640–6651. doi: 10.1128/JB.00702-06
Giomarelli, B., Visai, L., Hijazi, K., Rindi, S., Ponzio, M., Iannelli, F., et al. (2006). Binding of Streptococcus gordonii to extracellular matrix proteins. FEMS Microbiol. Lett. 265, 172–177. doi: 10.1111/j.1574-6968.2006. 00479.x
Hartmann, E. M., and Armengaud, J. (2014). N-terminomics and
proteogenomics, getting off to a good start. Proteomics 14, 2637–2646. doi: 10.1002/pmic.201400157
Hassouni, M. E., Chambost, J. P., Expert, D., Van Gijsegem, F., and Barras, F. (1999). The minimal gene set member msrA, encoding peptide methionine sulfoxide reductase, is a virulence determinant of the plant pathogen Erwinia chrysanthemi. Proc. Natl. Acad. Sci. U.S.A. 96, 887–892. doi: 10.1073/pnas.96.3.887
Imlay, J. A. (2013). The molecular mechanisms and physiological consequences of oxidative stress: lessons from a model bacterium. Nat. Rev. Microbiol. 11, 443–454. doi: 10.1038/nrmicro3032
Kabashima, Y., Sone, N., Kusumoto, T., and Sakamoto, J. (2013). Purification and characterization of malate:quinone oxidoreductase from thermophilic Bacillus sp. PS3. J. Bioenerg. Biomembr. 45, 131–136. doi: 10.1007/s10863-012-9485-5 Kanayama, A., Inoue, J., Sugita-Konishi, Y., Shimizu, M., and Miyamoto, Y.
(2002). Oxidation of Ikappa B alpha at methionine 45 is one cause of taurine chloramine-induced inhibition of NF-kappa B activation. J. Biol. Chem. 277, 24049–24056. doi: 10.1074/jbc.M110832200
Kim, G., Weiss, S. J., and Levine, R. L. (2014). Methionine oxidation and reduction in proteins. Biochim. Biophys. Acta 1840, 901–905. doi: 10.1016/j.bbagen.2013.04.038
Kim, H. Y. (2013). The methionine sulfoxide reduction system: selenium utilization and methionine sulfoxide reductase enzymes and their functions. Antioxid. Redox Signal. 19, 958–969. doi: 10.1089/ars.2012.5081
Koc, A., Gasch, A. P., Rutherford, J. C., Kim, H. Y., and Gladyshev, V. N. (2004). Methionine sulfoxide reductase regulation of yeast lifespan reveals reactive oxygen species-dependent and -independent components of aging. Proc. Natl. Acad. Sci. U.S.A. 101, 7999–8004. doi: 10.1073/pnas.0307929101
Laouami, S., Clair, G., Armengaud, J., and Duport, C. (2014). Proteomic evidences for rex regulation of metabolism in toxin-producing Bacillus cereus ATCC 14579. PLoS ONE 9:e107354. doi: 10.1371/journal.pone.0107354
Laouami, S., Messaoudi, K., Alberto, F., Clavel, T., and Duport, C. (2011). Lactate dehydrogenase A promotes communication between carbohydrate catabolism and virulence in Bacillus cereus. J. Bacteriol. 193, 1757–1766. doi: 10.1128/JB.00024-11
Levine, R. L., Berlett, B. S., Moskovitz, J., Mosoni, L., and Stadtman, E. R. (1999). Methionine residues may protect proteins from critical oxidative damage. Mech. Ageing Dev. 107, 323–332. doi: 10.1016/S0047-6374(98) 00152-3
Levine, R. L., Mosoni, L., Berlett, B. S., and Stadtman, E. R. (1996). Methionine residues as endogenous antioxidants in proteins. Proc. Natl. Acad. Sci. U.S.A. 93, 15036–15040. doi: 10.1073/pnas.93.26.15036
Luo, S., and Levine, R. L. (2009). Methionine in proteins defends against oxidative stress. FASEB J. 23, 464–472. doi: 10.1096/fj.08-118414
Madeira, J. P., Alpha-Bazin, B., Armengaud, J., and Duport, C. (2015). Time dynamics of the Bacillus cereus exoproteome are shaped by cellular oxidation. Front. Microbiol. 6:342. doi: 10.3389/fmicb.2015.00342
Madeira, J. P., Alpha-Bazin, B., Armengaud, J., Omer, H., and Duport, C. (2016a). Proteome data to explore the impact of pBClin15 on Bacillus cereus ATCC 14579. Data Brief 8, 1243–1246. doi: 10.1016/j.dib.2016.07.042
Madeira, J. P., Omer, H., Alpha-Bazin, B., Armengaud, J., and Duport, C. (2016b). Deciphering the interactions between the Bacillus cereus linear plasmid, pBClin15, and its host by high-throughput comparative proteomics. J. Proteomics 146, 25–33. doi: 10.1016/j.jprot.2016.06.022
Marteyn, B., West, N. P., Browning, D. F., Cole, J. A., Shaw, J. G., Palm, F., et al. (2010). Modulation of Shigella virulence in response to available oxygen in vivo. Nature 465, 355–358. doi: 10.1038/nature08970
Martin, E., Rosenthal, R. E., and Fiskum, G. (2005). Pyruvate dehydrogenase complex: metabolic link to ischemic brain injury and target of oxidative stress. J. Neurosci. Res. 79, 240–247. doi: 10.1002/jnr.20293