UNIVERSITÉ DE MONTRÉAL
FEASIBILITY OF BIOMASS BIODRYING FOR GASIFICATION PROCESS
ARASH HAMIDIAN
DÉPARTEMENT DE GÉNIE CHIMIQUE ÉCOLE POLYTECHNIQUE DE MONTRÉAL
MÉMOIRE PRÉSENTÉ EN VUE DE L’OBTENTION DU DIPLÔME DE MAÎTRISE ÈS SCIENCES APPLIQUÉES
(GÉNIE CHIMIQUE) JUILLET 2015
UNIVERSITÉ DE MONTRÉAL
ÉCOLE POLYTECHNIQUE DE MONTRÉAL
Ce mémoire intitulé:
FEASIBILITY OF BIOMASS BIODRYING FOR GASIFICATION PROCESS
présenté par : HAMIDIAN Arash
en vue de l’obtention du diplôme de : Maîtrise ès sciences appliquées a été dûment accepté par le jury d’examen constitué de :
M. TAVARES Jason-Robert, Ph. D., président
M. STUART Paul, Ph. D., membre et directeur de recherche M. MAHMOOD Talat, Ph. D., membre externe
ACKNOWLEDGEMENT
This project was accomplished at Environmental Engineering Design Chair of École Polytechnique with the support of Natural Sciences and Engineering Research Council of Canada (NSERC).
Hereby, I would also like to express my gratitude toward my supervisor, Professor Paul Stuart; first of all for the opportunity he provided to me to work on the subject of my interest, and also for his advices during my research project.
I would also like to thank the colleagues and people who helped me during the research project, those who helped me writing and preparing my publication, especially Dr. Zahra Sarshar for her endless supports and timeless availability, Dr. Jean Christoph Bonhiver for his valuable advices, and also Robert Delisle for his helps during the experimental phase of the project.
RÉSUMÉ
L’un des défis importants de gazéification de biomasse est la limite de la qualité de matière première surtout la teneur en humidité qui joue un rôle significatif sur la performance de gazéification. La gazéification requise de faible niveaux d'humidité (20% et moins) et plusieurs rapports ont souligné l'humidité comme un problème typique de la gazéification de biomasse. L'humidité élevée affecte les taux de réactions qui ont lieu dans les gazéificateurs à la suite de chute de la température et qu’elle finalement augmente la teneur en goudron, diminue le rendement en gaz, change la composition du gaz produit et touche l'efficacité. Donc, il faut obligatoirement prétraiter la biomasse avant le gazéificateur et réduire la teneur en humidité au niveau approprié et économique. Les solutions connues sont soit séchage naturel (pas pratiquement possible pour les usines à l’échelle commerciales) ou des technologies classiques de séchage (couts d'opération élevés). Bioséchage est un procédé alternatif qui utilise à la fois convection de l’air et la chaleur dégagé par réactions biologiques comme la source d'énergie, afin de réduire l'humidité. Dans le réacteur de bioséchage chaleur est générée à partir de décomposition exothermique de la fraction organique de biomasse et c’est la raison pour laquelle ce processus est appelé '' auto-chauffant ''. Utilisant telle technologie pour sécher la biomasse au prétraitement d’un procédé de gazéification rends plusieurs avantages économiques et environnementaux aux usines.
En Europe, le bioséchage est utilisé pour traitement des déchets municipaux (MSW- Municipal Solid Waste) à l'échelle commerciale pour dégrader une partie de la portion biodégradable des déchets, afin de créer la chaleur et réduire la teneur en humidité pour générer le combustible solide récupéré (SFR- Solid Recovered Fuel). En Italie, l'industrie du vin a l’intention de développer le bioséchage pour la récupération de l'énergie des déchets de raisin après la fermentation et distillation, qui renvoie des avantages économiques énorme à l'industrie. Au Canada, le développement de cette technologie de séchage pour l'industrie des pâtes et papiers a été lancé à l'École polytechnique de Montréal comme une option pour des solutions de gestion des boues. Par conséquent, le réacteur discontinu a été développé en 2004 et ensuite le système continu (à l'échelle pilote) a été conçu en 2010 pour démontrer la faisabilité de bioséchage des boues mixte des usines des pâtes et papiers, pour la combustion efficace dans les chaudières. La
boue mixte a été séchée dans le réacteur jusqu’au 45% d'humidité, ce qui est le niveau approprié pour qu’il soit utilisé économiquement dans une chaudière. Analyse technico-économique a également révélé les potentiels des avantages économiques pour les usines des pâtes et papiers.
Cependant, des incertitudes concernant la faisabilité de bioséchage existait pour d'autres types de biomasse qui sont habituellement utilisés dans les procédés de gazéification, et la raison de ces incertitudes est principalement le faible niveau de nutriment disponible dans la matrice de biomasse ligno-cellulosique typique utilisé comme matière première. En outre, la viabilité économique de cette technologie en conjonction avec le procédé de gazéification à l’usine des pâtes et papiers avait été une question. Dans ce travail, la faisabilité de bioséchage de la biomasse en faible nutriment a été examinée par des expérimentations, et la modèle technico-économique a été élaboré afin de déterminer la performance de bioséchage à l’échelle commerciale. Dans l'analyse économique une approche globale pour estimation des couts de bioséchage a été introduite basé sur l'approche connue largement utilisée à l'industrie des procédés. Quelques sources de bénéfices ont aussi été identifiées.
ABSTRACT
An important challenge of biomass gasification is the limitation of feedstock quality especially the moisture content, which plays a significant role on the performance of gasification process. Gasification requires low moisture levels (20% and less) and several reports have emphasized on the moisture as a typical problem while gasifying biomass. Moisture affects overall reaction rates in the gasifiers as a result of temperature drop and ultimately increases tar content, decreases gas yield, changes the composition of produced gas and affects the efficiency. Therefore, it is mandatory to pre-treat the biomass before gasification and reduce the moisture content to the suitable and economic level. The well-known solutions are either natural drying (not practical for commercial plants) or conventional drying technologies (have high operating costs). Biodrying is an alternative process, which uses both convective air and heat of biological reactions as a source of energy, to reduce the moisture. In the biodrying reactor heat is generated from exothermic decomposition of organic fraction of biomass and that is why the process is called ‘’self-heating process’’. Employing such technology for drying biomass at pre-treatment units of gasification process returns several economic and environmental advantages to mills.
In Europe, municipal waste treatment (MSW) plants use the biodrying at commercial scale to degrade a part of the biodegradable fraction of waste to generate heat and reduce the moisture content for high quality SRF (Solid Recovered Fuel) production. In Italy, wine industry is seeking to develop biodrying for energy recovery of grape wastes after fermentation and distillation, which returns economic benefits to the industry. In Canada, the development of biodrying technology for pulp and paper industry was started at École polytechnique de Montréal as an option for sludge management solution. Therefore, batch biodrying reactor was successfully developed in 2004 and the pilot-scale continuous system was designed in 2010 to demonstrate the feasibility of mixed sludge biodrying for efficient combustion in biomass boilers. Mixed sludge was biodried in the reactor to 45% moisture level, which was the suitable level for boiler application. Techno-economic analysis also revealed the potential economic benefits for pulp and paper mills.
However, considerable uncertainties existed in terms of feasibility of the biodrying technology for other types of biomass that are usually used in the gasification process, mainly because of low nutrient level of typical lignocellulosic biomass used as feedstock. Furthermore, the technology had not been shown to be economically viable in conjunction with gasification process at pulp and paper mills. In this work the feasibility of low-nutrient biomass biodrying was tested by experiments and techno-economic model was developed to identify the performance of biodrying process for commercial-scale application. In the economic analysis, a comprehensive approach for biodrying cost assessment was introduced that is based on the well-known approach widely used in the process industry and few sources of benefits were identified.
Table of contents
ACKNOWLEDGEMENT ... iii
RÉSUMÉ ... iv
ABSTRACT ... vi
Table of contents ...viii
List of figures ... xi
List of tables ... xii
List of Abbreviations ………xiii
Chapter 1 : Introduction ... 1
1.1. Context ... 1
Chapter 2 : Literature review ... 5
2.1. Principles of drying of solids ... 5
2.1.1. Classifications of conventional dryers ... 5
2.1.2. Principles of drying... 5
2.2. Sustainability and integrated bio-refinery ...13
2.2.1. Integration of gasification-based biorefinery to pulp and paper mills ...13
2.3. Biomass ...14
2.3.1. Characteristics of woody biomass ...14
2.3.2. Moisture Content of biomass ...15
2.3.3. Energy content and bulk density of biomass ...16
2.4. Continuous Biodrying Technology ...17
2.4.1. Different types of water in biomass ...17
2.4.2. Continuous biodrying process ...19
2.4.3. Microbiology of the biodrying technology ...19
2.4.4. Key variables of the continuous biodrying process ...24
2.4.5. Review and critical analysis of mixed sludge biodrying ...24
2.5. Pulp and paper sludge and disposal options ...26
2.5.1. Sludge generation ...26
2.5.2. Sludge characteristics ...26
2.5.4. Sludge dewatering before disposal ...28
2.5.5. Disposal options in the pulp and paper mills ...29
2.6. Gasification technologies ...31
2.6.1. Introduction ...31
2.6.2. Classification of gasification technologies...33
2.6.3. Conventional gasification technologies ...34
2.6.4. Fluidized bed gasification technologies ...34
2.6.5. TRI gasification technology ...36
2.6.8. Energy efficiencies in the gasification processes ...44
Chapter 3 : Continuous biodrying technology for gasification ... 46
3.1. Critical review and the gaps in the body of knowledge ...46
3.2. Hypotheses ...48
3.3. Objectives ...48
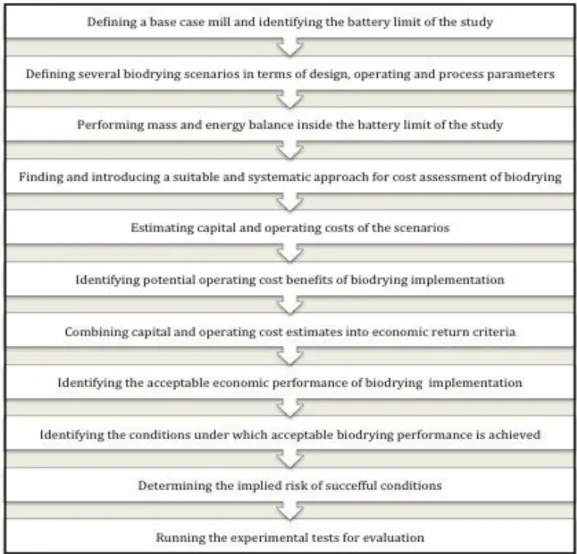
3.4. Overall methodology ...49
3.5. Preliminary techno-economic analysis ...50
3.5.1. Base case mill ...50
3.5.2. Biodrying scenarios ...52
3.5.3. Systematic cost assessment approach for biodrying cost estimations ...54
3.5.4. Purchased cost of the drying systems ...55
3.5.5. Installed cost of the drying systems ...57
3.5.6. Total direct plant costs of the drying systems ...57
3.5.7. Fixed capital investment of the drying systems ...58
3.5.8. Operating cost of the drying systems ...58
3.5.9. Effect of biomass moisture level on TRI gasification process ...60
3.5.10. Temperature drop and tar content of fluidized bed gasifier ...61
3.5.11. Short discussion ...65
3.5.12. Integration of biodrying process to the base case mill ...66
3.5.13. Profitability evaluation of the continuous biodrying system ...71
3.5.14. Techno-economic conclusion ...77
Chapter 4 : Experiments of biomass biodrying ... 79
4.1. Experiment targets ...79
4.2. Experiment ...79
4.2.2. Experiment series ...82
4.2.3. Material characterization ...83
4.2.4. Nutrient level of biomass ...85
4.2.5. Analysis of the results ...85
4.2.6. Experiment conclusion ...88
Chapter 5 : Conclusions and recommendations ... 90
5.1. Contribution to the body of knowledge ...90
5.2. Future works ...91
REFERENCES ... 92
APPENDICES ... 96
Appendix A. Article 1: Techno-economic analysis of continuous biodrying process in conjunction with gasification process at pulp and paper mills ...96
Appendix B. Calibration test values ... 113
List of figures
Figure 2.1. Cross-circulation drying ... 6
Figure 2.2. Through-circulation drying ... 6
Figure 2.3. Temperature pattern in countercurrent conventional dryers ... 7
Figure 2.4. Drying rate curves ... 12
Figure 2.5. Downstream opportunities by investing on TRI gasification technology ... 15
Figure 2.6. Typical drying curves of biomass ... 18
Figure 2.7. Biomass behavior before and after biodrying treatment ... 18
Figure 2.8. Temperature effect on microbial growth ... 21
Figure 2.9. Oxygen transfer mechanism to microorganisms ... 23
Figure 2.10. Schematic of wastewater treatment process ... 28
Figure 2.11. General overview of vertical composting reactor ... 30
Figure 2.12. Schematic of circulating fluidized bed gasification technology ... 38
Figure 2.13. Schematic of dual fluidized bed gasification technology ... 38
Figure 2.14. Bubbling fluidized bed (BFB) gasification technologies: ... 39
Figure 2.15. Overview of ThermoChem Recovery International steam reformer ... 39
Figure 2.16. Top and bottom of TRI steam reformer ... 42
Figure 2.17. Solid fraction of biomass along the TRI steam reformer’s height ... 42
Figure 2.18. Pulse combustion heat exchangers of TRI steam reformer ... 43
Figure 2.19. Mechanism of pulse combustion system ... 43
Figure 3.1. Overall step-wise methodology ... 49
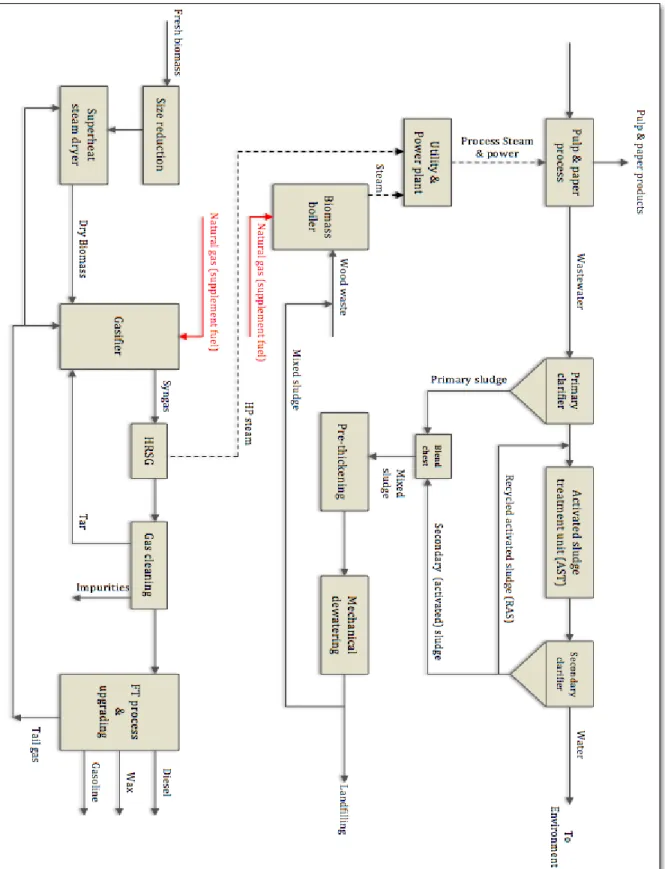
Figure 3.2. Schematic of base case mill process before implementing the biodrying system ... 53
Figure 3.3. Cost estimation steps for drying systems ... 55
Figure 3.4. Gas yield estimation of a fluidized bed gasifier in different biomass moisture levels ... 62
Figure 3.5. Tar generation of a fluidized bed gasifier ... 64
Figure 3.6. Estimation of tar generation in a fluidized bed gasifier ... 64
Figure 3.7. Estimation of tar quantity per day in different biomass moisture levels at TRI gasifier ... 65
Figure 3.8. Fixed capital investment of continuous biodrying system ... 67
Figure 3.9. Estimation of annual operating costs of biodrying system ... 70
Figure 3.10. Market price of diesel and gasoline fuels in different regions in 2014 ... 73
Figure 3.11. Benefits of continuous biodrying after integration to the base case mill ... 74
Figure 4.1. Pilot-scale biodrying machine installed at École polytechnique de Montréal ... 80
Figure 4.2. Positive and negative blowers of biodrying machine... 81
Figure 4.3. Instrument ad online control system of the pilot-scale biodrying reactor ... 82
Figure 4.4. Woody biomass used in the experiments ... 84
List of tables
Table 2.1. Basic characteristics of some woody biomass ... 15
Table 2.2. Degradability of biomass components ... 20
Table 2.3. C/N ratio of different types of biomass ... 23
Table 2.4. Characteristics of mixed sludge after mechanical dewatering ... 27
heat exchange tubes ... 39
Table 3.1. Characteristics of biomass used in the biofuel production process ... 51
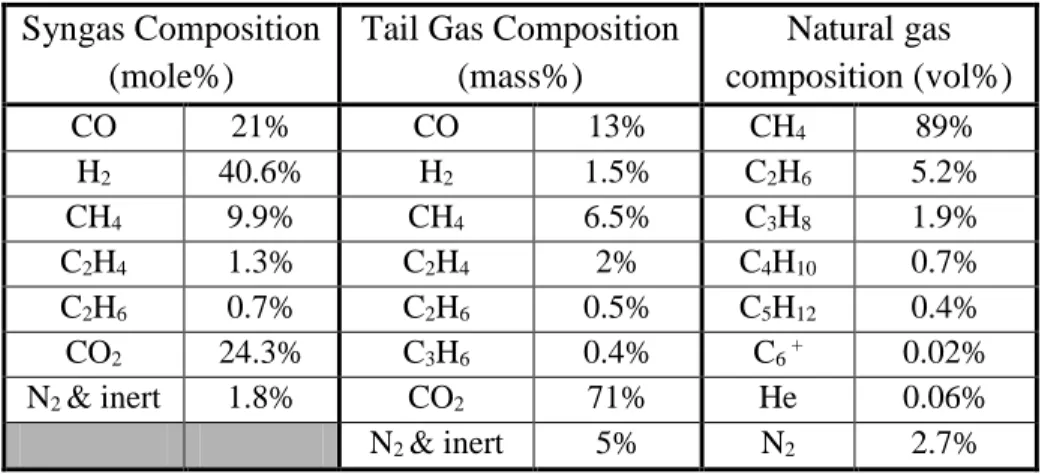
Table 3.2. Compositions of produced and consumed gases in the biofuel production process ... 52
Table 3.3. Marshall & Swift all-industry equipment & Chemical Engineering Plant cost index ... 56
Table 3.4. Exponent “n” relating some equipment cost to capacity ... 57
Table 3.5. Estimation of operator requirement for different types of process equipment ... 59
Table 3.6. Estimation of TRI bed temperature in different biomass moisture contents ... 62
Table 3.7. Gas yield of a 100 kWth gasification reactor ... 62
Table 3.8. Estimation of TRI gas yield in different biomass moisture levels ... 63
Table 3.9. Estimation of the quantity of tar generation per day ... 65
Table 3.10. Factors considered for fixed capital investment estimation ... 66
Table 3.11. Number of required biodrying units ... 67
Table 3.12. Mass and energy flows before and after integration of the biodrying system ... 73
Table 3.13. The internal rate of return of various biodrying scenarios ... 76
Table 3.14. Viable biodrying conditions for gasification-based biorefinery process ... 76
Table 4.1. Experiment runs ... 83
Table 4.2. Elemental analysis of biomass used in the experiment... 84
List of abbreviations
ASU Air Separation UnitBFB Bubbling Fluidized Bed BOD Biological Oxygen Demand CFB Circulated Fluidized Bed CTC Carbon Trim Cell
DCF Discounted Cash Flow DFB Dual Fluidized Bed FCI Fixed Capital Investment
FB Fluidized Bed
HCP Heat Carrier Particle HHV Higher Heating Value IRR Internal Rate of Return LHV Lower Heating Value
MBT Mechanical-Biological Treatment MSW Municipal Solid Waste
NCV Net Calorific Value NPV Net Present Value
Nu Nusselt number
OPEX Operating Expenses PBP Payback Period
PC Purchased Cost
RDF Refused Derived Fuel
RH Relative Humidity
RST Rotary Sludge Thickener SRF Solid Recovered Fuel TDC Total Direct Cost
TGA Thermo Gravimetric Analysis
TRI ThermoChem Recovery International WAS Waste Activated Sludge
Chapter 1 : Introduction
1.1. Context
One of the significant challenges of biomass gasification compared to combustion is limitation in quality of feedstock especially in terms of moisture content (Fagernäs, Brammer, Wilén, Lauer, & Verhoeff, 2010; J. Xu & Qiao, 2012), which plays an important role in gasification performance. Combustion boilers can tolerate higher moisture contents in the cost of reduced energy efficiency (Pang) whereas gasification process requires low moisture levels. Several reports have highlighted the moisture content as a typical problem while gasifying biomass (McKendry, 2002). Fresh biomass has in average 30-60% moisture that is not appropriate for gasification.
Moisture content of biomass has impact on the gasification process and mainly reduces overall reaction rates as a result of temperature drop. Moisture affects the drying and subsequent de-volatilization and gasification stages. Evolution of volatile gases in de-de-volatilization stage is basically a two-step process: first biomass yields tar, primary volatile gases (CO, H2, CH4, etc.) and residual char in the pyrolysis zone, and in the second step the tar is cracked at elevated temperatures and transformed to secondary volatile gases (𝐶𝑛𝐻𝑥↔ 𝑛𝐶 + (𝑥 2⁄ )𝐻2 & 𝐶𝑛𝐻𝑥+ 𝑚𝐻2𝑂 ↔ 𝑛𝐶𝑂 + (𝑚 + 𝑥 2⁄ )𝐻2) (Ian Narvaez, 1996; Javier Gil, 1997; J. Xu & Qiao, 2012). Besides, hydrogen and carbon monoxide are produced from some gasification reactions such as Boudouard reaction (𝐶 + 𝐶𝑂2 ↔ 2𝐶𝑂 ), steam-carbon reaction ( 𝐶 + 𝐻2𝑂 ↔ 𝐶𝑂 + 𝐻2), and methane reforming reaction (𝐶𝐻4+ 𝐻2𝑂 ↔ 3𝐻2+ 𝐶𝑂), which are highly endothermic. Higher moisture content in biomass absorbs more heat for evaporation and drops the gas and particle temperatures (McKendry, 2002; J. Xu & Qiao, 2012), which lowers the de-volatilization rate and shifts the equilibrium of the endothermic gasification reactions toward the formation of carbon dioxide and water. Therefore, moisture ultimately affects the last stage of gasification that results tar content increase (Ian Narvaez, 1996; Javier Gil, 1997), gas yield decrease (Kaewluan & Pipatmanomai, 2011), gas composition change (Javier Gil, 1997; Lv et al., 2004) and the efficiency of gasifier is ultimately affected (Kaewluan & Pipatmanomai, 2011). Schuster et. al. have mathematically modeled steam gasification in dual fluidized beds and reported zero gasifier
efficiency at 66% biomass moisture content (G. Schuster, 2001), and in an experimental work Kaewluan et. al. have gasified rubber woodchips of different moisture contents in a small fluidized bed gasifier and reported significant operational difficulties at moisture level higher than 30%, as well as approximately 10% efficiency decrease while increasing moisture content by about 15% (Kaewluan & Pipatmanomai, 2011).
Therefore, it is necessary to treat biomass moisture and decrease it to the appropriate and economic level at pre-treatment units. Solutions for high moisture content biomass are natural drying technique or conventional drying technologies. For commercial scale plants the natural drying is not practical because it requires extensive lands and also the sunlight is limited in many regions during the year. On the other side, the conventional drying techniques bear high operating cost if there would be no or expensive heating source in the plant (Kaewluan & Pipatmanomai, 2011).
Biodrying (biological drying) is an alternative process to conventional thermal drying that employs convective air as well as heat of biological reactions to reduce the moisture level of biomass. It is believed that employing biodrying for biomass pre-treatment in gasification process returns several economic and environmental advantages that have created encouragement for this study.
The term “biodrying” had primarily been used by Jewell et. al. (1984) while reporting operating parameters of daily manure’s drying (He, Zhao, Zheng, Wu, & Shao, 2013). However, the mechanism of biodrying is similar to composting where biological activity and aerobic decomposition of organic fraction takes place but their objectives and final products are different. The objective of composting is to stabilize the organic matter of raw wastes, reduce odors, and kill the pathogenic organisms to produce uniform organic fertilizer for land application whereas in the biodrying the goal is to reduce the moisture content of biomass for further applications such as energy recovery or etc. (Haga, 1999). Three main current applications of biodrying include: Municipal Solid Waste (MSW) treatment, grape waste treatment in wine industry, and moisture removal of mixed sludge at pulp and paper mills (Ken M. Frei, Cameron, & Stuart, 2004; Elena Cristina Rada & Ragazzi, 2012; E. C. Rada et al., 2010). The first one has been
practiced since more than a decade ago in Europe as a part of MBT (Mechanical-Biological Treatment) technologies with 20 commercial references (Velis, Longhurst, Drew, Smith, & Pollard, 2009), whereas the two latters are potential applications still under development (Elena Cristina Rada & Ragazzi, 2012; E. C. Rada, Ragazzi, Fiori, & Antolini, 2009; Shahram Navaee-Ardeh, 2006).
In MSW treatment plants, waste stream is transformed to SRF (Solid Recovered Fuel) for waste-to-energy options instead of landfilling. In such units, the entire MSW stream enters to biological process where biodrying degrades a part of the biodegradable organic fraction of the waste and generates heat to evaporate moisture content, which results high heating value SRF comparable to brown coal, when fine fraction such as ash, glass and stones are removed (Tambone, Scaglia, Scotti, & Adani, 2011). Some commercial biodrying technology providers for MBT application are Eco-deco, Entsorga, Herhof, Nehlsen, Wehrle Werk (Velis et al., 2009).
Valorization of grape waste through energy recovery is an option for wine industry to make economic and environmental benefits. The industry consumes 1.3 kg grape to produce a liter of wine where 20% are wasted after fermentation and distillation. Therefore, application of biodrying process for evaporation of water content and transforming the grape waste to SRF of different quality suitable for energy recovery has grabbed the attentions (Elena Cristina Rada & Ragazzi, 2012; E. C. Rada et al., 2009).
Development of biodrying technology for pulp & paper industry was started at École polytechnique de Montréal in 2004 and widely studied since then. It had primarily been reported as the most cost effective option among different emerging sludge management options at pulp & paper mills to increase the dryness level of sludge for boiler application (K.M. Frei, 2006). To address this issue, batch biodrying reactor system was developed at Polytechnique de Montréal in 2004 whose goal was to increase the dryness level of mixed sludge for efficient combustion in boilers (Ken M. Frei et al., 2004). Successful test results and $2 million per year operating costs saving estimation were the driving forces to develop continuous biodrying technology. Improved controllability and potentials of establishment in crowded pulp and paper sites were also identified as advantages of continuous technology over batch system (Shahram Navaee-Ardeh,
2006). In 2010, Navaee-Ardeh et. al. developed the mathematical model of continuous system and designed vertical pilot scale reactor in which mixed sludge was dried to 55%, the appropriate level for efficient combustion in boiler (Shahram Navaee-Ardeh, 2010).
Previous studies on the biodrying were successful, which encouraged continuing the research and investigations of the novel technology for gasification-based biorefinery process at pulp and paper mills. Such application addresses two major problems in the mill, which will be discussed briefly in the coming sections: first, it dries the biomass in the pre-treatment units, and second, it resolves the sludge management problem in the mill. Recently, ThermoChem Recovery Corp. successfully constructed and commissioned a small process demonstration gasification unit in the United States, which could process 4 tons per day of biomass (Newport et al., 2012), then they successfully established a commercial scale process with the partnership of NewPage Inc. (a pulp and paper mill). The novel biodrying process –in case of successful development for gasification application- can be employed at the pre-treatment of such mill.
Chapter 2 : Literature review
2.1. Principles of drying of solids (Warren L. McCabe, 2005)
Drying means reducing the moisture content from initial value to some acceptable final value. Drying of a solid is removing a portion of water content (or other liquids) from solid material to reduce it to the acceptable level appropriate for subsequent application. There are two possibilities for water removal from a solid: mechanically by presses or centrifuges or thermally by vaporization. Mechanical de-watering is cheaper than thermal drying therefore it is usually recommended to remove the water mechanically, as much as possible before feeding the solid materials to thermal dryers. Thermal drying is often complicated by diffusion in the solid but it is possible to dry it by heating at merely above the boiling point of water (or other liquids). However, thermal damage of the solid phase in such temperature must be analyzed prior to any design. Solid materials to be dried might be in different forms such as granule, flakes, crystal, powder, slabs or sheets and water to be removed might be at the surface of the solids, totally inside the solid or partly inside and partly outside of the solids.
2.1.1. Classifications of conventional dryers
There are several types of dryers: continuous and batch, agitated and un-agitated, vacuum and atmospheric dryers that complicate the classification of dryers. However, the most common classification divides the conventional dryers into three groups:
- Direct (or adiabatic) dryers: where solids are directly exposed to a hot gas
- Indirect or non-adiabatic dryers: where heat is indirectly transferred to solids through an external medium such as steam
- Dryers heated by dielectric, radiant or microwave energy
2.1.2. Principles of drying
2.1.2.1. Cross-circulation and through-circulation dryings of solids
Cross-circulation drying is the drying of a bed of wet solids over which the air passes across the surface and the drying happens on the sides of the solid. Here the gas is blown across the surface of a bed or slab of solids or across one or both faces of a continuous sheet (Figure 2.1). Such drying has slow drying rate and it depends on the distance liquid moves to reach the surface of
the solid. If solid particles are large enough the air passes through the bed instead of across it and significantly increases the drying rate. This is called through-circulation drying (Figure 2.2).
Figure 2.1. Cross-circulation drying (Warren L. McCabe, 1993)
Figure 2.2. Through-circulation drying [adapted from (Mujumdar, 2015)]
2.1.2.2. Temperature patterns in the dryers
Temperature variations in a dryer depends on the: nature of feedstock, water content of feedstock, temperature of heating medium, allowable final temperature of solid, drying time, etc. However, pattern of temperature variation in conventional technologies are similar from one to another, which has been depicted in Figure 2.3. In an ideal continuous dryer, temperature of wet solids rises quickly from initial value (Tsa) to vaporization temperature (Tv) that is the boiling point of
water at dryer’s pressure. Drying continues in Tv for a considerable time but normally after a
short period of time the temperature of solid slightly rises as a zone of dry solid appears on the surface of solid particles. Close to gas inlet (right side of the graph), in a relatively small length of the dryer temperature of the solid rapidly rises to higher than vaporization temperature (Tsb).
This is due to the fact that energy required to heat up the dry solid is small compared to energy required for vaporization. Therefore for heat-sensitive solids the dryer must be designed in a way to keep the outlet temperature (Tsb) close to the vaporization temperature (Tv). At steady state the
Gas temperature profile is more complex due to variation of temperature driving force and overall heat transfer coefficient along the length of the dyer.
Figure 2.3. Temperature pattern in countercurrent conventional dryers
(Warren L. McCabe, 2005)
2.1.2.3. Phase equilibrium and moisture concentration
When wet solid comes in contact with air of lower humidity than moisture of the solid, the solid tends to lose moisture and dry up to equilibrium with air (mass diffusion of water) due to concentration gradient. If the air would be more humid than solid then solid adsorbs the moisture until equilibrium is gained. Concentration of fluids is expressed as mole fraction that is meaningless for wet solids therefore mass of water per unit mass of dry solid represents the concentration of water (Eq. 2.1) (Warren L. McCabe, 2005).
𝑋(𝑤𝑎𝑡𝑒𝑟)
=
𝑚(𝑤𝑎𝑡𝑒𝑟)𝑚(𝑑𝑟𝑦 𝑠𝑜𝑙𝑖𝑑) (2.1)
2.1.2.5. Heat duty in the dryers
Heat is used for the following items in a conventional dryer:
- To heat the solid and liquid feed to vaporization temperature - To vaporize the liquid
- To heat the vapor to the final temperature
- To heat the air or other additional gases to their final temperature
Therefore, necessary heat to be transferred in the dryer is written as Eq. 2.3- 2.7, where indices 1 and 2 represent initial and final conditions and indices L, s, v represent solid, liquid and vapor.
𝑄𝑡𝑜𝑡𝑎𝑙 = 𝑚𝑠. 𝐶𝑃(𝑠). (𝑇𝑣𝑎𝑝𝑜𝑟𝑖𝑧𝑎𝑡𝑖𝑜𝑛− 𝑇𝑠1) + 𝑚(𝐿). 𝐶𝑃(𝐿). (𝑇𝑣𝑎𝑝𝑜𝑟𝑖𝑧𝑎𝑡𝑖𝑜𝑛− 𝑇𝐿1) + (𝑚𝐿1− 𝑚𝐿2). ℎ𝑙𝑎𝑡𝑒𝑛+ 𝑚𝑠. 𝐶𝑃𝑠. (𝑇𝑠2 − 𝑇𝑣𝑎𝑝𝑜𝑟𝑖𝑧𝑎𝑡𝑖𝑜𝑛) + (𝑚𝐿1 − 𝑚𝐿2). 𝐶𝑃(𝑣). (𝑇𝑣2 − 𝑇𝑣𝑎𝑝𝑜𝑟𝑖𝑧𝑎𝑡𝑖𝑜𝑛) (2.3)
Where Tvaporization is the boiling point of liquid, ms is the dry mass of solid and mL is the mass of
liquid in dry solid. By defining liquid concentrations as mass of liquid per mass of dry solid (Eq. 2.4 and 2.5), the quantity of heat per unit mass of dry solid is re-formulated as Eq. 2.6.
𝑚𝐿1 𝑚𝑠 = 𝑋1 (2.4) 𝑚𝐿2 𝑚𝑠 = 𝑋2 (2.5) 𝑄𝑡𝑜𝑡𝑎𝑙 𝑚𝑠 = 𝐶𝑃(𝑠).
(𝑇
𝑣𝑎𝑝𝑜𝑟𝑖𝑧𝑎𝑡𝑖𝑜𝑛 − 𝑇𝑠1)
+ 𝑋1. 𝐶𝑃(𝐿).(𝑇
𝑣𝑎𝑝𝑜𝑟𝑖𝑧𝑎𝑡𝑖𝑜𝑛 − 𝑇𝐿1)
+(𝑋
1− 𝑋2) . ℎ
𝑙𝑎𝑡𝑒𝑛𝑡 + 𝐶𝑃(𝑠).(𝑇
𝑠2 − 𝑇𝑣𝑎𝑝𝑜𝑟𝑖𝑧𝑎𝑡𝑖𝑜𝑛)
+(𝑋
1− 𝑋2). 𝐶
𝑃(𝑣).(𝑇
𝑣2 − 𝑇𝑣𝑎𝑝𝑜𝑟𝑖𝑧𝑎𝑡𝑖𝑜𝑛)
(2.6)Initial temperature of the liquid is equal to initial temperature of solid, so by re-arranging the Eq. 2.6 total quantity of necessary heat per unit dry mass of solid can be obtained from Eq. 2.7 where CP is the average in the temperature range of initial to final levels.
𝑄𝑡𝑜𝑡𝑎𝑙
𝑚𝑠 = 𝐶𝑃(𝑠)
(𝑇
𝑠2− 𝑇𝑠1)
+ 𝑋1. 𝐶𝑃(𝐿)(𝑇
𝑣𝑎𝑝𝑜𝑟𝑖𝑧𝑎𝑡𝑖𝑜𝑛 − 𝑇𝑠1)
+(𝑋
1 − 𝑋2). ℎ
𝑙𝑎𝑡𝑒𝑛𝑡+In adiabatic dryers, total heat of Eq. 2.7 comes from cooling of a gas (an external source), so the required temperature of gas can be obtained from Eq. 2.8 where mg is mass rate of dry gas and hg is humid heat capacity of gas at inlet humidity.
𝑄𝑡𝑜𝑡𝑎𝑙 = 𝑚𝑔. ℎ𝑔. (𝑇ℎ2− 𝑇ℎ1) (2.8)
2.1.2.6. Drying rates and critical moisture contents
Moisture of wet solid decreases over time. The drying rate is defined as quantity of the moisture removed from solid per unit of time per unit area of the solids (Eq. 2.9).
𝑅 =
−
𝑑𝑚𝐴 𝑑𝑡𝑣= −
𝑚𝐴𝑠 𝑑𝑋𝑑𝑡 (2.9)Where mv is liquid content, ms is mass of dry solid, A is the unit area of drying, t is the drying
time and X is the liquid concentration that is defined as mass of liquid per mass of dry solid. In the drying processes there are two drying rate periods:
i. Constant-rate period: where the rate is constant (or decreases slightly) during
considerable period of time
ii. Falling-rate period: where drying rate is decreased linearly, in polynomial shape, or other
curve types.
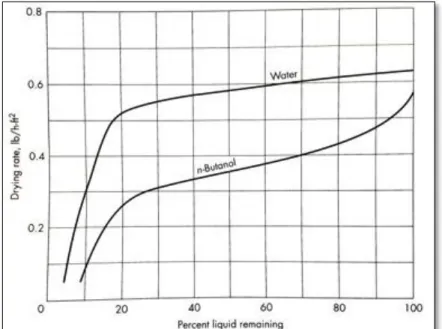
During the constant rate period the solid is too wet and a continuous liquid film is formed on its surface to guarantee a consistent evaporation. Enough liquid on the surface behaves like there is no solid. As moisture content decreases, the constant-rate period is terminated at a point called ‘’critical point’’ where there is not sufficient water on the surface to form the continuous liquid film (Warren L. McCabe, 1993). Figure 2.4 is the example of drying rate periods for (a) a bed of glass beads containing water and n-butanol (b) porous ceramic plate containing water. Drying rate of the glass of beads up to about 25% moisture content is referred as constant-rate period although it decreases a little bit, then falling-rate period is observed. Ceramic plate is an example of solid with two falling-rate periods. The drying up to the point B is in constant-rate period
and then it faces two falling rate periods: the first falling-rate period is linear up to the point C and the second has curve shape up to the end (point D).
The point(s) where constant-rate period ends is called “critical moisture content”. It is the point below which enough liquid cannot be transferred from the interior of solid to the surface to keep the continuous liquid film. Critical moisture level depends on several parameters such as drying conditions, the material of solid, heat and mass resistance of the solid and etc. If initial moisture content would be less than critical level no constant-rate period is experienced. Sometimes critical points can be clearly identified and sometimes approximation is required (like glass beads).
If solid would be too wet that a continuous liquid film appears on the external surface, evaporation will be the same as a pool of liquid and true constant-rate period is expected to take place (AB in Figure 2.4-b). No slight decreases will appear, the surface temperature is the same as wet bulb temperature and heat transfer by radiation or conduction is negligible. This true constant-rate period is maintained only if there would be a mechanism to bring the interior water of solid to the surface fast enough to always keep the surface wet. In such cases the period is called “prolonged constant-rate period” and the calculations of regular constant-rate period applies to it.
During the constant-rate period temperature of the interface (Ti) is assumed equal to wet bulb temperature (Twb) and drying rate can be estimated by Eq. 2.10 that is based on the heat transfer. For determining the heat transfer coefficient, estimations based on the empirical equations can be made. For turbulent gas flow parallel to solid surface Eq. 2.11 and gas flow perpendicular to solid surface with velocity of 0.9-4.5 m/s Eq. 2.12 have been recommended (Warren L. McCabe, 2005).
𝑅
𝑐𝑜𝑛𝑠𝑡𝑎𝑛𝑡−𝑟𝑎𝑡𝑒 𝑝𝑒𝑟𝑖𝑜𝑑= [ ℎ𝑦(𝑇−𝑇𝜆 𝑖) ]𝑖 (2.10)
ℎ𝑦 = 24.2 𝐺0.37 = 24.2 (𝜌. 𝑢)0.37 (2.12)
In these equations Rconstant-rate is constant drying rate per unit area, hy is heat transfer coefficient of the gas, T is temperature of the gas (dry-bulb temperature if air is used), Ti is temperature of interface, λi is latent heat of liquid at interface temperature, Nu is Nusselt number, k is thermal conductivity at mean film temperature, G is mass velocity of gas in lb/hr.ft2, ρ is gas density in lb/ft3 and u is gas velocity in ft/hr.
In the falling-rate period diffusion of moisture to the surface of solid particles limits the drying rate. Moisture moves through the pores of the solids by capillarity and to some extend by surface diffusion.
2.1.2.7. Drying time
Drying time is the integration of Eq. 2.9 between first and second moisture levels that can be re-written as Eq. 2.13.
𝑡
𝑇𝑜𝑡𝑎𝑙= ∫ 𝑑𝑡
𝑡2 𝑡1=
𝑚𝑠 𝐴∫
𝑑𝑋 𝑅 𝑋1 𝑋2(2.13)
If drying happens only in the constant-rate period the rate is obtained from Eq. 2.10-2.12 and drying time is calculated as Eq. 2.14.
𝑡𝑐𝑜𝑛𝑠𝑡𝑎𝑛𝑡−𝑟𝑎𝑡𝑒 𝑝𝑒𝑟𝑖𝑜𝑑 = 𝑚𝑠(𝑋1−𝑋2)
𝐴.𝑅𝑐𝑜𝑛𝑠𝑡𝑎𝑛𝑡−𝑟𝑎𝑡𝑒 (2.14)
In the falling-rate period the relationship between drying rate and moisture concentration must be known. By assuming linear relation R=aX drying time of falling-rate period and total drying time can be calculated by Eq. 2.15 and 2.16.
at critical point: 𝑎 =𝑅𝑐𝑟𝑖𝑡𝑖𝑐𝑎𝑙 𝑋𝑐𝑟𝑖𝑡𝑖𝑐𝑎𝑙
𝑡𝑓𝑎𝑙𝑙𝑖𝑛𝑔−𝑟𝑎𝑡𝑒 𝑝𝑒𝑟𝑖𝑜𝑑 = (𝑡𝑡𝑜𝑡𝑎𝑙− 𝑡𝑐𝑜𝑛𝑠𝑡𝑎𝑛𝑡−𝑟𝑎𝑡𝑒) =𝑚𝑠.𝑋𝑐𝑟𝑖𝑡𝑖𝑐𝑎𝑙 𝐴.𝑅𝑐𝑟𝑖𝑡𝑖𝑐𝑎𝑙 ln ( 𝑋𝑐𝑟𝑖𝑡𝑖𝑐𝑎𝑙 𝑋2′ ) (2.15) 𝑡𝑡𝑜𝑡𝑎𝑙−𝑑𝑟𝑦𝑖𝑛𝑔 = 𝑡𝑐𝑜𝑛𝑠𝑡𝑎𝑛𝑡+ 𝑡𝑓𝑎𝑙𝑙𝑖𝑛𝑔= 𝑚𝑠 𝐴.𝑅𝑐𝑟𝑖𝑡𝑖𝑐𝑎𝑙 (𝑋1− 𝑋𝑐𝑟𝑖𝑡𝑖𝑐𝑎𝑙+ 𝑋𝑐𝑟𝑖𝑡𝑖𝑐𝑎𝑙. ln 𝑋𝑐𝑟𝑖𝑡𝑖𝑐𝑎𝑙 𝑋2′ ) (2.16)
(a)
(b)
Figure 2.4. Drying rate curves of (a) beds of glass beads and (b) porous ceramic
2.2. Sustainability and integrated bio-refinery
Sustainability of an industry, a technology, or a business comprises three aspects:
- Environmental aspects: if raw materials are supplied from renewable sources and if the practices to collect, aggregate, move and treat them doesn’t damage the environment, quality of water, quality of air and wildlife diversity; and if the waste stream after products’ lifetime would be biodegradable, then environmental aspect is met.
- Economic aspects: if the industry or company keeps acceptable profitability without subsidy of government, economic aspect is met.
- Social aspects: if the production and the use of final products don’t harm the health, social justice and well being of the societies that use them, the third aspect is also met.
The integrated bio-refineries are currently known as the best route for production of bio-based fuels and chemicals. Such products have been identified to be more sustainable than fossil fuel products. Integrated bio-refinery facilities are analogously similar to petroleum refineries that use biomass conversion processes and equipment to produce a wide range of renewable products such as fuels, power, heat, steam and chemicals, from biomass. Due to the differences in biomass components, such plants can maximize the value derived from biomass feedstock by producing multiple products. Bio-refineries can produce a wide range of renewable fuels, green energy, green electricity and high value-added chemicals, by employing appropriate technologies. They are carbon neutral and have a vast environmental improvement over the fossil fuel technologies. Agriculture residues, municipal solid wastes (MSW), refused derived fuels (RDF), woody biomass, lignite, paper mill residue, black liquor and sludge can be used as feedstock in the bio-refinery.
2.2.1. Integration of gasification-based biorefinery to existing pulp and paper mill
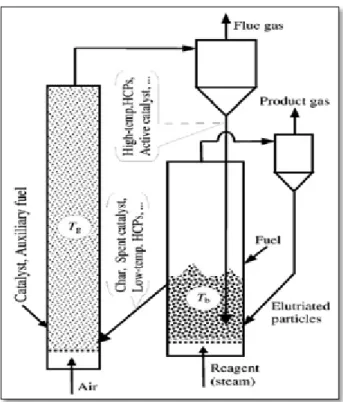
TRI (ThermoChem Recovery Incorporation) gasification technology is, at the moment, the only technology that can gasify both solid and liquid (black liquor) biomass in a single gasification platform. It benefits the bio-refinery by gasifying a wide range of biomass types from small to large capacities (200 to 2000 odt/day) in one single steam reforming reaction vessel. By investing
on such technology, optionality is given in downstream by providing vast investment options (Figure 2.5).
Further to the sustainability advantage, the technology lowers the investment risks by enabling the bio-refinery plant to change the product portfolio quickly and cost effectively, in order to respond to the market changes. It is also flexible in accepting a wide range of biomass feedstock; therefore, the bio-refinery facility has the chance to react quickly to any feedstock market conditions. In addition, it has optimum thermal and process integration to produce combined heat and power, liquid fuels and bio-chemical products in the plant. Possible scenarios of using TRI technology are generally categorized as:
- Biomass conversion to syngas for liquid fuel and high value chemicals production
- Biomass conversion to syngas for combined cycle power generation to displace fossil fuel, decrease operating costs and increase revenue through selling excess green electricity to grid - Biomass conversion to syngas for boiler and lime kiln applications for fossil fuel
displacement and operating cost reduction
Due to the proprietary and unique features of the TRI technology, syngas specifications are entirely customizable to any production goal and scenarios, in order to maximize the economic and environmental benefits.
2.3. Biomass
2.3.1. Characteristics of woody biomass
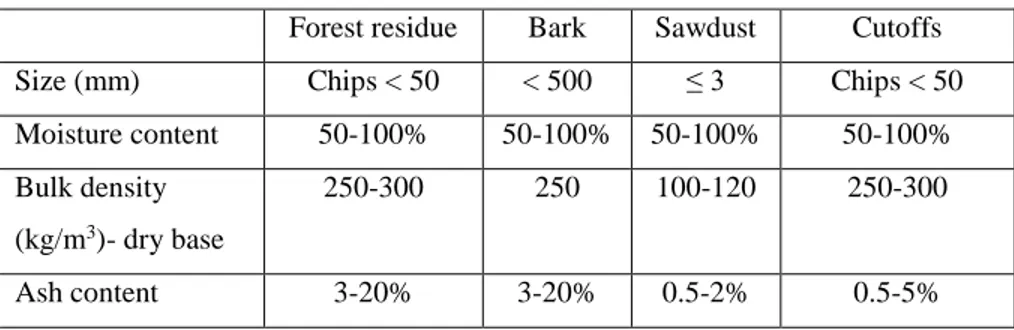
Woody biomass is a loose particulate material that is derived from different sources that’s why properties, sizes and moisture contents vary from one to another. It is mainly derived from forest harvesting, wood processing at mills, etc. Branches, roots and small tops are the biomass that come from the forest harvesting that are usually chopped into chips 30-50mm in length. In the sawmills, sawdust and cutoffs are generated from timber sawing and bark is generated from debarking step. Basic characteristics of different types of wet woody biomass are found in Table 2.1.
Figure 2.5. Downstream opportunities by investing on TRI gasification technology
Table 2.1. Basic characteristics of some woody biomass (Pang)
Forest residue Bark Sawdust Cutoffs Size (mm) Chips < 50 < 500 ≤ 3 Chips < 50 Moisture content 50-100% 50-100% 50-100% 50-100% Bulk density
(kg/m3)- dry base
250-300 250 100-120 250-300
Ash content 3-20% 3-20% 0.5-2% 0.5-5%
2.3.2. Moisture Content of biomass
Total quantity of water in the biomass including both bound and unbound moisture (see section 2.4.1). Total water is determined by either TGA (Thermo Gravimetric Analysis) or oven heating methods. In TGA, very small biomass samples (milligrams scale) is heated up steadily to about 110 °C and weighed simultaneously by a microbalance that is installed on the device, initial and final weights are then reported on a graph. In the oven heating method fresh samples are
oven-dried at about 105°C for 24 hours and it is weighed before and after heating. In both methods, the difference between initial and final mass is moisture content, which is divided by the initial mass to return a value in percent of moisture level (Eq. 2.17). In some works dry solid content is used instead of moisture content (Eq. 2.18).
𝐵𝑖𝑜𝑚𝑎𝑠𝑠 𝑀𝑜𝑖𝑠𝑡𝑢𝑟𝑒 𝐶𝑜𝑛𝑡𝑒𝑛𝑡 (%) = 𝐼𝑛𝑖𝑡𝑖𝑎𝑙 𝑀𝑎𝑠𝑠−𝐹𝑖𝑛𝑎𝑙 𝑀𝑎𝑠𝑠𝐼𝑛𝑖𝑡𝑖𝑎𝑙 𝑀𝑎𝑠𝑠 × 100 (2.17)
𝐵𝑖𝑜𝑚𝑎𝑠𝑠 𝑠𝑜𝑙𝑖𝑑 (%) = 100 − 𝑏𝑖𝑜𝑚𝑎𝑠𝑠 𝑚𝑜𝑖𝑠𝑡𝑢𝑟𝑒 (%) (2.18)
2.3.3. Energy content and bulk density of biomass
Higher Heating Value (HHV) and Lower Heating Value (LHV) are the important parameters of biomass. In publications, they are typically reported in units of energy per dry unit of mass (kJ/kg dry or kcal/lb. dry). HHV represents maximum available energy that can be obtained from a given material. It is defined as total energy available from biomass combustion with air including the energy recovered from latent heat of steam that is produced during combustion. But LHV does not include such latent heat and it is defined as usable energy in the biomass. Increasing moisture content of biomass reduces usable energy content due to the presence of excess water in the matrix.
For quantifying the heating value (energy content) either empirical formulations or calorimetric bomb (that is more precise) is used. For empirical formulations, elemental analysis of biomass should be known. Equation 2.19 is a common formula called “Dulong formula” that estimates HHV of biomass by using percentage of C, H and S content from ultimate analysis (Kenneth Michael Frei, 2004):
𝐻𝑒𝑎𝑡 𝐶𝑜𝑛𝑡𝑒𝑛𝑡 (𝐵𝑡𝑢𝑙𝑏) = 14495 × 𝐶 + 61000 (𝐻 −𝑂8) + 5770 × 𝑆 (2.19)
Bulk density is important for: biomass transportation and reactor design. In contrary to liquids and other solid materials, bulk density of biomass is more complicated to predict. Moisture content, particle size and compaction are the parameters that influence the bulk density of
biomass. The higher the moisture content the higher the bulk density due to the void spaces filled with water. Therefore, different biomass types result different bulk densities.
2.4. Continuous Biodrying Technology (Navaee-Ardeh, 2009)
2.4.1. Different types of water in biomass
Unbound water and bound water are different types of water exists in the biomass. Unbound water consists of free water, interstitial water and a part of the surface water physically adhered to the surface of particles, whereas bound water is the one that is chemically embedded into the particles’ structure. Each type requires different treatment mechanism for removal. During the drying process, as shown in Figure 2.6 qualitatively, free water is primarily removed at constant drying rate. Interstitial and surface water removals are then taking place during decreasing rate periods.
Constant rate drying takes place at wet-bulb temperature where convection is the dominant mechanism and external mass transfer controls the drying. Such drying depends on the air temperature, air relative humidity and air velocity Constant rate period is followed by first, second and third falling rate periods where more intense mechanism is required to pull the moisture to the surface of the particle. In such period, since the internal diffusion is the limiting factor, drying takes place at dry-bulb temperature. However, an efficient dewatering process can mechanically remove only a portion of free and interstitial water but surface and bound water requires thermal treatment technics.
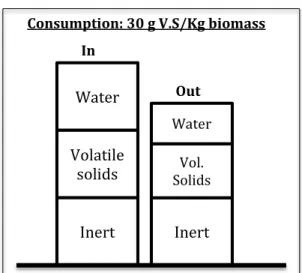
Water Volatile solids Inert Inert Vol. Solids Water Consumption: 30 g V.S/Kg biomass In Out
Figure 2.6. Typical drying curves of biomass [adapted from (Navaee-Ardeh, 2009)]
Figure 2.7. Biomass behavior before and after biodrying treatment [adapted from
2.4.2. Continuous biodrying process
In the continuous biodrying process, in addition to forced convection the drying rate is enhanced by biological heat generated by metabolic activity of mesophilic and thermophilic microorganisms in the biomass matrix. Thus, biodrying is a self-heating process where heat generation mainly relies on the microbial activity in the biodrying reactor. Combination of forced convection and biological heat generation are employed in the technology to dry biomass. Principal transport mechanisms of moisture flow through the matrix are air convection and molecular diffusion. Air convection that is blown by engineered airflow is responsible for water losses that are easily removable. Biomass drying in the biodrying process happens in two steps:
- Water molecules are evaporated from the surface of biomass to surrounding air
- Evaporated water is conveyed out through the matrix and removed by convective airflow
Thermodynamic equilibrium between solid phase and air (gas phase) governs removal of water by convection. In the biodrying reactor physical and biochemical reactions happen to dry the materials. On the physical side there is convective moisture removal by controlled forced aeration and on the biochemical side aerobic biodegradation of readily decomposable organic matter occurs. In the latter, microorganisms catabolize biomass substrates during multiple biodegradation cycles to satisfy their metabolic and growth needs and ultimately lowers water content and volatile matters of biomass (Figure 2.7). General configuration of biodrying reactor and physio-biochemical phenomena that happens inside are similar to composting but the operating manner is different. Fast biodrying causes low biological stability and vice versa.
2.4.3. Microbiology of the biodrying technology
In biodrying reactor heat is generated by exothermic decomposition of the organic fraction of biomass. Biodrying technology is referred to the method of achieving mesophilic and thermophilic aerobic biological activity in the biodrying reactor. Aerobic decomposition of biomass is an exothermic process and biodrying reactor heats up as soon as bacteria decompose the organic matters. As temperature rises the biodegradation is accelerated resulting microbial growth rate increase, new cells production, rapid microbial multiplications and more CO2 and H2O generation. However, in the optimum temperature, microbial growth is at peak value, and further rise in temperature suppresses the microbial growth cycle, as microorganisms face with
thermal death. Several studies have reported the optimum range of microbial growth of thermophilic microorganisms in the range of 50-65°C. Important parameters in aerobic degradation process are: microbiology, oxygen, nutrient, and moisture requirements.
2.4.3.1. Microbial reaction in the biodrying reactor
Biodryer is a self-heating reactor that relies on the microbial heat generation to reach the drying temperatures. This is an advantage over conventional drying systems, which require an external heating source. Equation 2.20 shows the microbial reaction takes place in the biomass matrix in the biodryer.
Substrate + a O2 b CO2 + cH2O + New cell ΔHr < 0 (2.20)
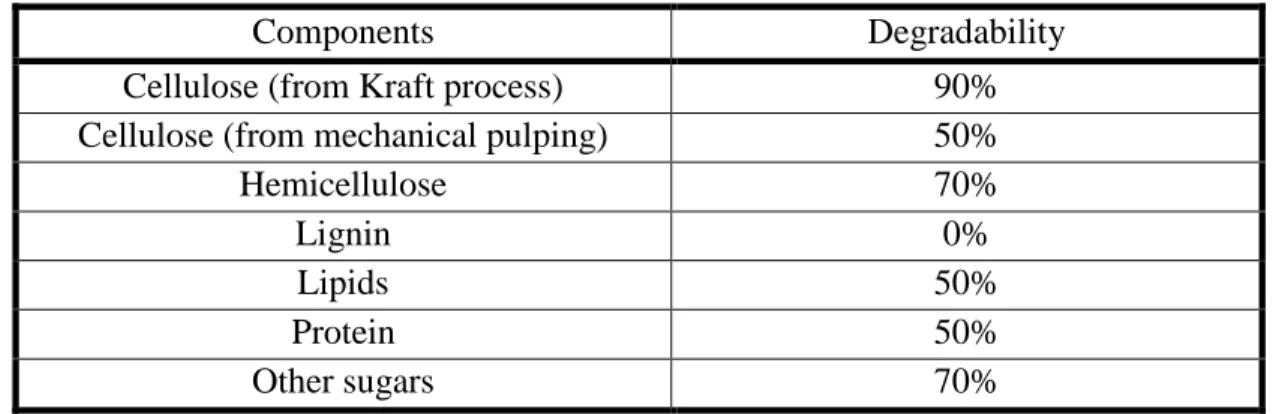
All types of woody biomass have common structure but they differ in chemical compositions. They are made up of cellulose fibrils bundled together and surrounded by hemicellulose and both are protected by lignin against biological and chemical attacks. Cellulose provides strength and flexibility to the wood, lignin cements the fibers together and hemicellulose helps these two bind together. These substrates represent readily decomposable part of biomass and have different degradability levels, which depends on the previous processing.
High degradability has been observed in the paper products that have chemically been processed to remove the lignin such as Kraft or sulfite delignification processes. Mechanical pulping does not remove the lignin but only destroy their structure, that’s why the degradability of cellulose obtained from such process is lower (Haug, 1993). However, the most decomposable components are cellulose and hemicellulose and the least degradable is lignin.
Table 2.2. Degradability of biomass components (Haug, 1993)
Components Degradability
Cellulose (from Kraft process) 90%
Cellulose (from mechanical pulping) 50%
Hemicellulose 70% Lignin 0% Lipids 50% Protein 50% Other sugars 70%
Ra te of b acte ri al gr ow th
2.4.3.2 Classification of microorganisms in the biodrying process
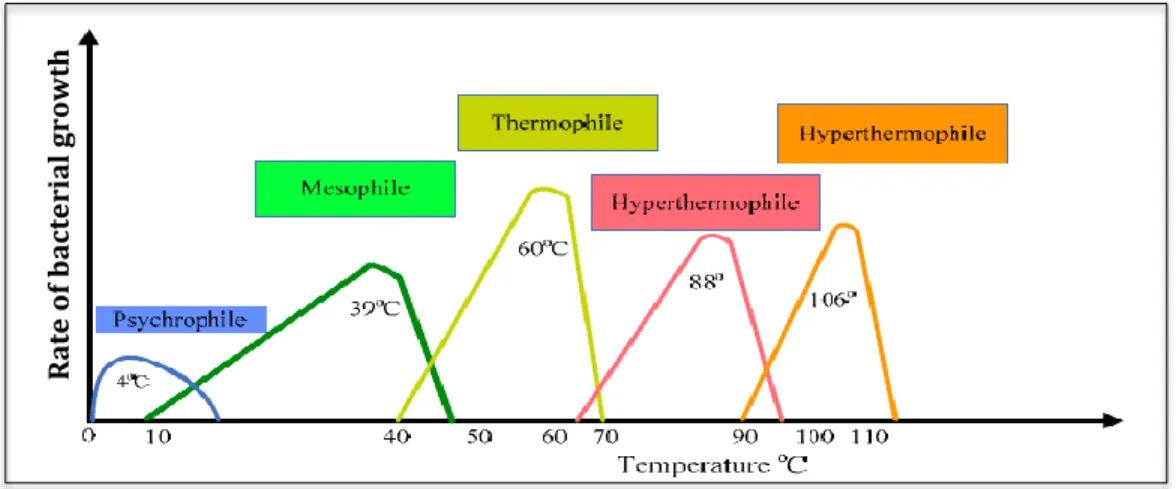
Wide ranges of microorganisms (bacteria, fungi, etc.) catabolize organic compounds of the biomass. Psycrophiles are organisms that grow the best at 12-18 °C and sometimes at lower in the range of 5-10 °C. Ingraham et. al. reported very slow mesophilic generation at 8 °C where the best temperature was 25-40 °C; no mesophilic generation had been observed below 8 °C (Ingraham, 1958). The effectiveness of bacteria and fungi in decomposing the organic matters depends on the operational conditions of the process where they grow. Generally, different groups of organisms that perform biological activity are categorized into four groups based on their temperature tolerance (Navaee-Ardeh, 2009).
Psychrophiles: active in temperature range of 0-20 °C
Mesophiles: active in temperature range of 8-48 °C
Thermophiles: active in temperature range of 42-68 °C
Hyper thermophiles: active in temperature range of 70-110 °C
In continuous and batch biodrying reactors, typical temperature range of microbial degradation was reported as 15-50 °C where 65 °C was the highest observed temperature (Kenneth Michael Frei, 2004; Navaee-Ardeh, 2009; Roy, 2005). Such temperature range shows that bacteria involved in the process are mesophilic and thermophilic. The bacteria are very sensitive to the temperature of the matrix where they grow. As depicted in Figure 2.8 higher temperatures kill mesophilic bacteria while favoring the growth of thermophiles. Nevertheless, very high temperature causes death of thermophilic bacteria, as well.
2.4.3.3. Oxygen requirements and transfer mechanism
Availability of the oxygen is one of the important factors in biodegradation processes. Presence or absence of oxygen classifies the bioprocesses into aerobic and anaerobic. Aerobic biodegradation requires uniform and sufficient oxygen transfer to ensure optimum respiration of microorganisms for metabolic activity. In aerated composting, a compost pile requires 5-15% v/v oxygen or 21% v/v air (Navaee-Ardeh, 2009) which is equal to approximately 1-4 grams of oxygen per gram of biodegradable material (or approx. 4-17 gram of air per each gram of biomass material). This oxygen is only required for metabolism of microorganisms; thus, if drying of the material is supposed to be considered [like biodrying of this thesis], excess aeration rate at about 10-30 times than for biological oxidation is required. Air must properly be diffused and be able to reach all pores of biomass material to minimize anaerobic zones. If air does not penetrate into clumps of material, anaerobic conditions will be formed and developed. Anaerobic and aerobic decompositions are the different forms of biological activity that result different products (see section 2.5.5.5). Klass et. al. reported 30-60 °C for grass anaerobic decomposition in their experimental tests (Haug, 1993) and aerobic activity has been reported in the range of 35-65 °C (Kenneth Michael Frei, 2004; Navaee-Ardeh, 2009), which shows both can happen in similar temperature range. However, they both depends many factors that will be discussed in the upcoming sections.
Oxygen transfer to microorganisms is a very slow phenomenon that is controlled by diffusion mechanism. As shown in Figure 2.9, air is primarily supplied to the porous space of biomass and oxygen is then transferred to its gas/liquid interface, diffuses across the interface and finally reaches the microorganisms through the liquid phase where the microbial reaction (Equation 2.20) takes place. Microbial degradation then causes concentration gradient of oxygen and causes the diffusion of more O2 from the air to the liquid phase. CO2 and H2O that are the products of the biological reaction are conversely moved towards the gas phase (air). Therefore, forced aeration in the biodrying process can enhance the mass transfer of oxygen.
Figure 2.9. Oxygen transfer mechanism to microorganisms [adapted from (Navaee-Ardeh, 2009)]
2.4.3.4. Nutrients for microorganisms
Nitrogen (N), phosphorus (P), sulfur (S) and some other trace elements are key nutrients required by microorganisms and enough concentrations of them are necessary for proper cell growth. Ratio of carbon to nitrogen ofte represents nutrient parameter in the biomass. The ideal range of C/N for active microbial biodegradation is 20:1-30:1 (Navaee-Ardeh, 2009). Each biomass substrate has unique carbon to nitrogen ratio. Secondary sludge of pulp and paper mills has low C/N ratio whereas biomass like bark and fibers contain little nitrogen and consequently high C/N ratios. Table 2.3 shows carbon to nitrogen ratio of several biomass types.
Table 2.3. C/N ratio of different types of biomass [adapted from (Navaee-Ardeh, 2009)]
Biomass types C/N ratio
Bark 160-534 : 1
Wood chips 492-535 : 1
Primary sludge 23-930 : 1
Secondary sludge 9-81 : 1
Mixed sludge 6-115 : 1
Negative linear correlation between C/N ratio of paper mill sludge and heat generation has been reported by Navaee-Ardeh et. al., 2009 (found by Larsen and McCartney, 2000), where high levels of heat generation occurring in the range of C/N=15-30. As the amount of bulking agent
(like bark) increases, the C/N ratio increases as well. The range of 24-29 has been recommended as the most ideal range for proper activity of microorganisms.
2.4.3.5. Moisture requirements of microorganisms
The minimum moisture content below which little or no microbial activity occurs has not been reported in the literature but from composting process 20% w/w can be considered (Velis et al., 2009). Moisture in the biomass is necessary and important for proper functioning of the microorganisms. High solid levels in biomass limits the transport of nutrient required by microorganisms to perform aerobic activity. On the other hand, high moisture level limits the availability of oxygen, which is due to the slow diffusion of oxygen into the thick water biofilm. Optimum moisture level required for acceptable microbial activity is in the range of 45-65% w/w.
2.4.4. Key variables of the continuous biodrying process
Relative humidity and temperature of the inlet air, airflow rate, relative humidity of outlet air, residence time, nutrient level (C/N ratio) and solid recycle ratio are important process variables in biodrying. Airflow rate and inlet air relative humidity directly affect the ability of system to eliminate moisture from biomass, air temperature affects the capacity of air to hold water for moisture removal, recycle ratio affects the acclimation period of microorganisms and residence time affects the capital cost of the system. Results of the previous biodrying studies at École polytechnique de Montréal where mixed sludge was dried show that the outlet relative humidity profile is the key variable in the continuous biodryer. Effect of different outlet relative humidity profiles on the efficiency index of biodryer was investigated and results reveals that the highest biodrying efficiency index is achieved if outlet air relative humidity profile is controlled at 85% in the first and second compartments and 96% in the third and fourth compartments of the reactor (see section 3.4.1). Such profile guarantees economic dry solid level of mixed sludge for boiler application.
2.4.5. Review and critical analysis of mixed sludge biodrying
In the continuous biodrying process, combination of forced convection and biological heat of microbial activity dries the biomass. These microorganisms are naturally present in the porous matrix of biomass. Attraction of biodrying compared to conventional drying technologies is that the reactor is self-heating and doesn’t need fossil fuel or external heating source. Biodrying
reactor has four nominal compartments and biomass is dried while moving downward in the reactor.
In the previous study, several parameters such as biomass type, biomass pH, biomass nutrient level (C/N ratio), residence time, recycle ratio, and outlet relative humidity profile were investigated and the key variables were determined by variable analysis. It has been reported that types of biomass and outlet relative humidity profile are the most influential parameters. Type of biomass corresponds to the nutrient level (C/N ratio) required by bacteria for performing biological activity and the outlet relative humidity corresponds to the quantity of water removed from the system. Generally, biomass is a mill specific parameter and in each single study it is considered as fix parameter, therefore, outlet relative humidity profile is the most influential parameter on the overall performance of continuous biodrying process.
Two levels for outlet relative humidity were investigated in the study: low RH level and high RH level. Low RH level had been set to 85%, which controls the drying at wet bulb temperature. Here, the drying takes place at constant rate and it is suitable for removing free and interstitial water of biomass. On the other hand, high RH level had been set to 96%, which controls the drying at dry bulb temperature. Such level helps activating the microorganisms and it is appropriate for falling-rate-period (see sections 2.1.2.6 & 2.4.1). It is suitable for removing the surface and bound water. Experimental tests resulted the best biodrying efficiency at outlet relative humidity profile that controls the removal of unbound water at wet-bulb temperature in the 1st and 2nd compartments of the reactor, and the removal of bound and surface water at dry-bulb temperature in the 3rd and 4th compartments.
Experiments and modeling data revealed that 25%-35% of the total drying in the biodrying reactor takes place in the first and second compartment where convection is dominant mechanism, and 65%-75% takes place in the third and fourth compartment where biological heat is generated and diffusion is the dominant mechanism. The previous experiments were conducted in 4-8 days residence time and wood waste was combined with the mixed sludge as bulking agent to help oxygen passes easily through the particles and reaches all the pores of biomass.
2.5. Pulp and paper sludge and disposal options (Kenneth Michael Frei, 2004) 2.5.1. Sludge generation
Pulp and paper mills are large consumers of water that is used at major process units such as woodchips washing, pulp washing, pulp slurry dilution, cooling systems, steam generation and etc. After being used, the water is ultimately discharged to the environment as effluent. Environmental regulations have obliged the industry to treat their effluents in wastewater facilities before sending them off to environment, in order to minimize the impacts on ecosystem, ("Water use and treatment in the Pulp and Paper industry," 2012). Pulp and paper mills generate in average 60 m3 of wastewater per ton of produced paper (Kenneth Michael Frei, 2004) and the treatments generate primary and biological (secondary) sludge that remain problematic for the mills, which must be disposed according to environmental standards.
2.5.2. Sludge characteristics
Pulp and paper sludge is the biomass residue of mill’s effluent, generated at primary and secondary (biological) treatment units. Primary sludge biomass is generated by gravity settlement at primary clarifier, which is mainly composed of fibrous materials (cellulose and hemicellulose) wasted from fiber recovery system of the pulp and paper process (Mahmood & Elliott, 2006). It is relatively easy to dewater. Secondary sludge biomass or waste activated sludge (WAS) is the residue of biological treatment unit where microorganisms consume organic compounds of the effluent (BOD) as food and eliminate about 90% of the BOD, the secure and harmless level for environment. The microorganisms are then extracted from secondary clarifier as solid waste after their normal life cycle. Quantity of secondary sludge depends on design and operation of the AST (Activated Sludge Treatment) system but roughly 40-85 kg of WAS biomass is generated per each ton of BOD removed from mill’s effluent.
In secondary sludge biomass, considerable portion of molecular and cellular bound water (Navaee-Ardeh, 2009) makes it much more difficult than primary sludge for dewatering, therefore mills usually blend primary and secondary sludge to generate mixed sludge before mechanical dewatering (Mahmood & Elliott, 2006). Dewatering of mixed sludge with higher portion of the secondary sludge biomass is more complicated, which results lower dryness level after mechanical dewatering.
Different pulp and paper processes result different sludge characteristics. Table 2.4 shows some important characteristics of mixed sludge after mechanical dewatering have been shown.
Table 2.4. Characteristics of mixed sludge after mechanical dewatering [adapted from (Kenneth Michael Frei, 2004)]
2.5.3. Secondary (biological) wastewater treatment process
Pulp and paper mills are obliged to install biological (secondary) treatment system on their wastewater facilities, which the consequence is reduction of biological oxygen demand (BOD) discharged to environment. Unlike the primary treatment, purpose of the secondary unit is to remove organic substances from wastewater. The activated sludge process is one of the most common methods used for this purpose.
Wastewater, after being treated in the primary unit, is fed to an aerated basin where biological treatment takes place (Figure 2.10). Microorganisms degrade the waste and after normal life cycle they are extracted from secondary clarifier as a solid waste stream. A portion of this cellular mass is recycled to the inlet of secondary treatment to maintain the microbial population but a certain quantity is wasted in the form of waste activated sludge (WAS) or secondary sludge.
Parameters Pulp mill De-inking mill Recycled paper mill Moisture content 64% 58% 52% Elemental analysis: Carbon Hydrogen Oxygen Nitrogen Sulfur Ash 50.6% 6.2% 32.2% 3.1% 0.8% 6.5% 30% 3.9% 24.5% 0.7% 0.2% 40.7% 48.5% 6.6% 41.5% 0.5% 0.3% 2.9% HHV- dry (KJ/kg) 21,725 12,112 20,700 Bulk density (Kg/m3) 400-700 400-700 400-700 Note: Data related to average of several mills