FUNCTIONAL CONNECTIVITY OF THE RODENT BRAIN USING OPTICAL
IMAGING
EDGAR GUEVARA CODINA INSTITUT DE GÉNIE BIOMÉDICAL ÉCOLE POLYTECHNIQUE DE MONTRÉAL
THÈSE PRÉSENTÉE EN VUE DE L’OBTENTION DU DIPLÔME DE PHILOSOPHIÆ DOCTOR
(GÉNIE BIOMÉDICAL) NOVEMBRE 2013
ÉCOLE POLYTECHNIQUE DE MONTRÉAL
Cette thèse intitulée:
FUNCTIONAL CONNECTIVITY OF THE RODENT BRAIN USING OPTICAL IMAGING
présentée par : GUEVARA CODINA Edgar
en vue de l’obtention du diplôme de : Philosophiæ Doctor a été dûment acceptée par le jury d’examen constitué de :
M. COHEN-ADAD Julien, Ph. D., président
M. LESAGE Frédéric, Ph. D., membre et directeur de recherche M. BEAUMONT Eric, Ph. D., membre et codirecteur de recherche M. COMTOIS Philippe, Ph. D., membre
DEDICATION
ACKNOWLEDGMENTS
I express my gratitude to my supervisor Professor Frédéric Lesage for the opportunity he gave me to be part of his research group, and mostly for his constant guidance, supervision and support. His confidence in my work and prompt corrections contributed enormously to the bringing up of this thesis.
My sincere appreciation to all the co-authors Philippe Pouliot, Hélène Girouard, Eric Beaumont, Dang Khoa Nguyen, Nataliya Sadekova, Simon Dubeau, Nicolas Ouakli, Maxime Abran and Samuel Bélanger and for all the contributions to our joint publications. A special acknowledgement goes to Romain Berti, Irene Londono, Carl Matteau-Pelletier, Ningshi Xie and Grégory Lodygensky for their tireless efforts towards the experiments with photoacoustics. Many thanks to Pierre Bellec for the fruitful discussion about functional connectivity. I would also like to acknowledge the support of Caroline Boudoux for the use of her laboratory facilities, as well as Edward Baraghis, Kathy Beaudette and Simon Lemire-Renaud for their invaluable help with the OCT system.
I would like to sincerely thank all the staff of the Montreal Heart Institute animal facility, in particular Marc-Antoine Gillis, Natacha Duquette, Vanessa Durocher-Granger and Karine Nadeau. Their invaluable technical assistance in animal preparation, animal monitoring and administrative help undoubtedly facilitated my research. I am also grateful to past and current members of LIOM who provided much help through my studies and shared many pleasant moments: Abas Sabouni, Alexandre Castonguay, Alexis Machado, Azadeh Naderiyanha, Benoit Hamelin, Clément Bonnery, Émilie Beaulieu-Ouellet, Joël Lefebvre, Karim Zerouali-Boukhal, Léonie Rouleau, Li Baoqiang, Mahnoush Amiri, Michèle Desjardins, Peng Ke, Simon Archambault, Tri Truong Van, Zhang Cong.
I gratefully acknowledge the Mexican National Science and Technology Council (CONACYT) through scholarship No. 304501 and the Ministry of Public Education (SEP) for providing me with financial support throughout most of my doctorate; I would also like to thank my advisor’s financial assistance. Many thanks to my mother and my aunt who have always supported me to achieve my goals, even in the distance. I would like to express my endless thankfulness to my wonderful wife Jenny, who left everything behind to accompany me on this journey; without her encouragement and love this task would not have been possible at all.
RÉSUMÉ
L'objectif de cette thèse de doctorat est d’appliquer la connectivité fonctionnelle dans une variété de modèles animaux, à l’aide de plusieurs techniques d’imagerie optique. Le cerveau, même au repos, montre une activité métabolique élevée : la corrélation des fluctuations spontanées lentes permet d’identifier des régions cérébrales distantes mais connectées; d’où le terme connectivité fonctionnelle. Les changements dans l’activité spontanée peuvent donner un aperçu des processus neuronaux qui comprennent la majorité de l’activité métabolique du cerveau, et constituent en conséquent une vaste source de changements reliés aux maladies.
L’hémodynamique du cerveau peut être modifiée grâce à des affections neurovasculaires et avoir un effet sur l’activité au repos. Cette thèse vise la compréhension des changements de connectivité fonctionnelle induits par des maladies, à l’aide de l’imagerie optique fonctionnelle. Les techniques d’imagerie explorées dans les deux premières contributions de cette thèse sont l’Imagerie Optique Intrinsèque et l’Imagerie par Granularité Laser. Ensemble, elles peuvent estimer les changements de consommation d'oxygène, étroitement liés à l’activité neuronale. Ces techniques possèdent des résolutions temporelles et spatiales adéquates et bien adaptées pour imager la convexité du cortex cérébral. Dans le dernier article, une modalité d’imagerie en profondeur, la Tomographie Photoacoustique a été utilisée chez le rat nouveau-né. La Tomographie par Cohérence Optique et la Tomographie Laminaire Optique font également partie de la gamme des techniques d’imagerie développées et appliquées dans d’autres collaborations. La première partie des résultats mesure les changements de connectivité fonctionnelle dans un modèle d’activité épileptiforme aiguë chez le rongeur. Il y a des augmentations ainsi que des diminutions entre les corrélations homologues, avec une faible dépendance aux crises épileptiques. Ces changements suggèrent un découplage potentiel entre les paramètres hémodynamiques dans les réseaux au repos, en soulignant l’importance d’investiguer les réseaux épileptiques à l’aide de plusieurs mesures hémodynamiques indépendantes.
La deuxième partie des travaux étudie un nouveau modèle de rigidité artérielle chez la souris : la calcification unilatérale de la carotide droite. L’analyse de connectivité basé sur les régions d’intérêt montre une tendance décroissante de corrélation homologue dans les cortex moteur et cingulum. L’analyse de graphes montre une randomisation des réseaux corticaux, ce qui suggère une perte de connectivité; plus spécifiquement, dans le cortex moteur ipsilateral à la carotide
traitée. Néanmoins, ces changements ne se reflètent pas dans un métabolisme différencié. Ils restent toujours des facteurs confondants dûs au fait que la calcification de la carotide induit un déclin neuronal dans l’hippocampe ainsi qu’une altération unilatérale de la pulsatilité vasculaire. Cependant, les résultats appuient la nécessite d’observer plusieurs paramètres hémodynamiques lorsqu’on image le cerveau suite à la remodélisation artérielle.
La troisième partie des travaux étudie un modèle de lésion inflammatoire chez le rat nouveau-né. La saturation d’oxygène et la connectivité fonctionnelle ont été mesurées avec la Tomographie Photoacoustique. La saturation d’oxygène a diminué dans le site de la lésion et dans le cortex ipsilateral à la lésion, toutefois cette diminution n’a pas été complètement expliquée par l’hypovascularisation révélée par l’histologie. Une analyse de connectivité des régions d’intérêt a montré que la connectivité intra-hémisphères n’est pas modifiée par la lésion inflammatoire.
ABSTRACT
The aim of this thesis is to apply functional connectivity in a variety of animal models, using several optical imaging modalities. Even at rest, the brain shows high metabolic activity: the correlation in slow spontaneous fluctuations identifies remotely connected areas of the brain; hence the term “functional connectivity”. Ongoing changes in spontaneous activity may provide insight into the neural processing that takes most of the brain metabolic activity, and so may provide a vast source of disease related changes.
Brain hemodynamics may be modified during disease and affect resting-state activity. The thesis aims to better understand these changes in functional connectivity due to disease, using functional optical imaging.
The optical imaging techniques explored in the first two contributions of this thesis are Optical Imaging of Intrinsic Signals and Laser Speckle Contrast Imaging, together they can estimate the metabolic rate of oxygen consumption, that closely parallels neural activity. They both have adequate spatial and temporal resolution and are well adapted to image the convexity of the mouse cortex. In the last article, a depth-sensitive modality called photoacoustic tomography was used in the newborn rat. Optical coherence tomography and laminar optical tomography were also part of the array of imaging techniques developed and applied in other collaborations.
The first article of this work shows the changes in functional connectivity in an acute murine model of epileptiform activity. Homologous correlations are both increased and decreased with a small dependence on seizure duration. These changes suggest a potential decoupling between the hemodynamic parameters in resting-state networks, underlining the importance to investigate epileptic networks with several independent hemodynamic measures.
The second study examines a novel murine model of arterial stiffness: the unilateral calcification of the right carotid. Seed-based connectivity analysis showed a decreasing trend of homologous correlation in the motor and cingulate cortices. Graph analyses showed a randomization of the cortex functional networks, suggesting a loss of connectivity, more specifically in the motor cortex ipsilateral to the treated carotid; however these changes are not reflected in differentiated metabolic estimates. Confounds remain due to the fact that carotid rigidification gives rise to neural decline in the hippocampus as well as unilateral alteration of vascular pulsatility; however
the results support the need to look at several hemodynamic parameters when imaging the brain after arterial remodeling.
The third article of this thesis studies a model of inflammatory injury on the newborn rat. Oxygen saturation and functional connectivity were assessed with photoacoustic tomography. Oxygen saturation was decreased in the site of the lesion and on the cortex ipsilateral to the injury; however this decrease is not fully explained by hypovascularization revealed by histology. Seed-based functional connectivity analysis showed that inter-hemispheric connectivity is not affected by inflammatory injury.
TABLE OF CONTENTS
DEDICATION ... III ACKNOWLEDGMENTS ... IV RÉSUMÉ ... V ABSTRACT ...VII TABLE OF CONTENTS ... IX LIST OF TABLES ... XV LIST OF FIGURES ... XVI LIST OF ACRONYMS AND ABBREVIATIONS ... XXIIIINTRODUCTION ... 1
Brief literature review ... 3
Objectives ... 10
Other contributions ... 11
CHAPTER 1 OPTICAL IMAGING OF INTRINSIC SIGNALS ... 14
1.1 Optical Intrinsic Signals (OIS) system description ... 14
1.2 OIS theory ... 15
1.3 OIS system characterization ... 17
1.4 Laser speckle contrast imaging ... 18
1.5 Cerebral metabolic rate of oxygen ... 19
1.6 Conclusions ... 20
CHAPTER 2 LAMINAR OPTICAL TOMOGRAPHY ... 21
2.1 LOT theory ... 21
2.2 LOT system description ... 26
2.4 Experimental results ... 32
2.4.1 Phantom imaging ... 32
2.4.2 In vivo imaging ... 33
2.5 Conclusions ... 39
CHAPTER 3 OPTICAL COHERENCE TOMOGRAPHY ... 40
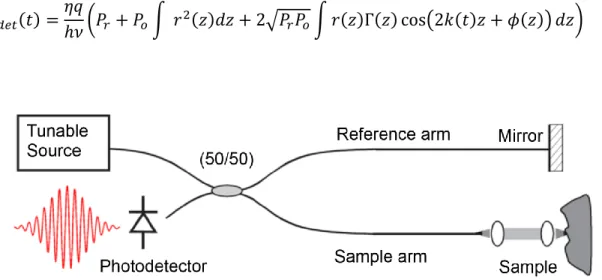
3.1 OCT theory ... 41
3.2 OCT system overview ... 42
3.2.1 Sample Arm ... 44
3.2.2 Reference arm ... 46
3.3 Acquisition software ... 47
3.4 System characterization ... 47
3.4.1 Resolution ... 47
3.4.2 Penetration depth, sensitivity and dynamic range ... 50
3.5 Doppler OCT ... 51
3.6 Experimental methods ... 52
3.7 Experimental results ... 54
3.8 Conclusions ... 55
CHAPTER 4 FUNCTIONAL CONNECTIVITY ... 56
4.1 Algorithms description ... 56
4.1.1 Seed-based functional connectivity ... 56
4.1.2 Independent component analysis (ICA) ... 59
4.1.3 Hierarchical clustering ... 62
4.1.4 Graph theory ... 62
CHAPTER 5 ARTICLE 1: OPTICAL IMAGING OF ACUTE EPILEPTIC NETWORKS IN MICE ... 66
5.1 Presentation of the article ... 66 5.2 Abstract ... 66 5.2.1 Key Words ... 67 5.3 Introduction ... 67 5.4 Methods ... 70 5.4.1 Animal preparation ... 70
5.4.2 Epilepsy model and electrophysiology ... 70
5.4.3 Optical recording system ... 71
5.4.4 Optical imaging of intrinsic signals (OIS) ... 73
5.4.5 Speckle contrast imaging ... 73
5.4.6 Cerebral metabolic rate of oxygen ... 74
5.4.7 Functional connectivity ... 75
5.5 Results ... 76
5.5.1 Identification of functional networks ... 76
5.5.2 Changes in functional connectivity after injection of 4-AP ... 78
5.5.3 Correlation between seizure duration and functional connectivity ... 79
5.6 Discussion ... 81
5.6.1 Acute seizure activity leads to both decrease and increase in functional connectivity .. ... 82
5.6.2 Correlation between electrophysiological activity and resting state correlations ... 83
5.6.3 Metabolic consumption reflect hemodynamic changes ... 83
5.7 Conclusion ... 84
5.8 Acknowledgments ... 84
CHAPTER 6 ARTICLE 2: OPTICAL IMAGING OF RESTING-STATE FUNCTIONAL
CONNECTIVITY IN A NOVEL ARTERIAL STIFFNESS MODEL ... 90
6.1 Presentation of the article ... 90
6.2 Abstract ... 90
6.3 Introduction ... 91
6.4 Materials and methods ... 93
6.4.1 Animal model ... 93
6.4.2 Application of calcium chloride ... 93
6.4.3 OIS Imaging ... 94
6.4.4 Resting state network analysis ... 97
6.5 Results ... 99
6.5.1 Seed-based functional connectivity ... 99
6.5.2 Graph Theoretical measures ... 102
6.6 Discussion ... 104
6.6.1 Hemodynamic changes ... 104
6.6.2 CMRO2 ... 105
6.6.3 Graph theoretical measures ... 106
6.6.4 Impact for BOLD-fMRI ... 106
6.7 Conclusion ... 107
6.8 Acknowledgments ... 107
6.9 References ... 107
6.10 Supplemental Figures ... 113
CHAPTER 7 ARTICLE 3: IMAGING OF AN INFLAMMATORY INJURY IN THE NEWBORN RAT BRAIN WITH PHOTOACOUSTIC TOMOGRAPHY ... 115
7.2 Abstract ... 115
7.3 Introduction ... 116
7.4 Materials and Methods ... 118
7.4.1 Ethics statement ... 118
7.4.2 Neonatal inflammatory injury ... 118
7.4.3 PAT imaging ... 119
7.4.4 Seed-based functional connectivity analysis ... 120
7.4.5 Scrubbing ... 122
7.4.6 Histology ... 123
7.4.7 Lectin Staining and Vessel Counting ... 123
7.4.8 Statistical analysis ... 124
7.5 Results ... 124
7.5.1 Locoregional cortical saturation ... 124
7.5.2 Microvascular quantification ... 125
7.5.3 Seed-based functional connectivity ... 127
7.6 Discussion ... 129
7.6.1 Locoregional cortical saturation ... 129
7.6.2 Seed-based functional connectivity ... 129
7.7 Conclusions ... 130
7.8 Acknowledgements ... 130
7.9 Author contributions ... 131
7.10 References ... 131
7.11 Supplemental figures ... 138
8.1 Article 1 ... 139
8.1.1 Regional bilateral functional connectivity is disrupted after the injection of a focal epileptogenic agent. ... 140
8.1.2 Changes in functional connectivity correlate with seizure duration. ... 140
8.2 Article 2 ... 141
8.2.1 Uncoupling is shown between hemodynamic measures and metabolic activity in bilateral functional correlations. ... 141
8.2.2 Resting state functional networks derived from hemodynamic signals are disrupted following a unilateral carotid artery calcification. ... 141
8.3 Article 3 ... 141
8.3.1 Local SO2 values are significantly lower in the injured group, as compared to sham controls. ... 142
8.3.2 Bilateral functional connectivity decreases significantly in pups with inflammatory brain injury. ... 142
CONCLUSION AND RECOMMENDATIONS ... 143
REFERENCES ... 148
ANNEX 1 –MATLAB TOOLBOXES ... 194
LIST OF TABLES
Table 4.1: Definition of graph theoretical measures ... 64 Table 5.1: Seizure data a ... 80 Table 6.1: Summary of significant results from second-level analysis using graph theoretical measures a. ... 102
LIST OF FIGURES
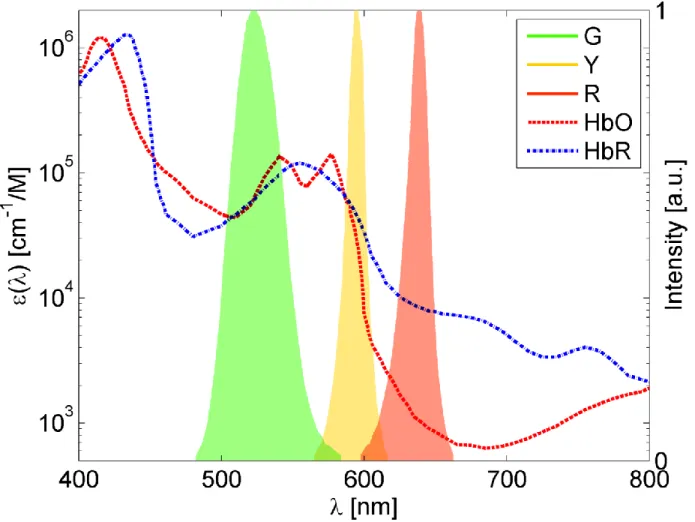
Figure 1-1: (A) Overview of the intrinsic signal optical imaging system. (B) Sensitivity profile of optical imaging of intrinsic signals (λ=625nm). ... 14 Figure 1-2: Optical absorption of oxy- and deoxy-hemoglobin (HbO2 and HbR) and measured
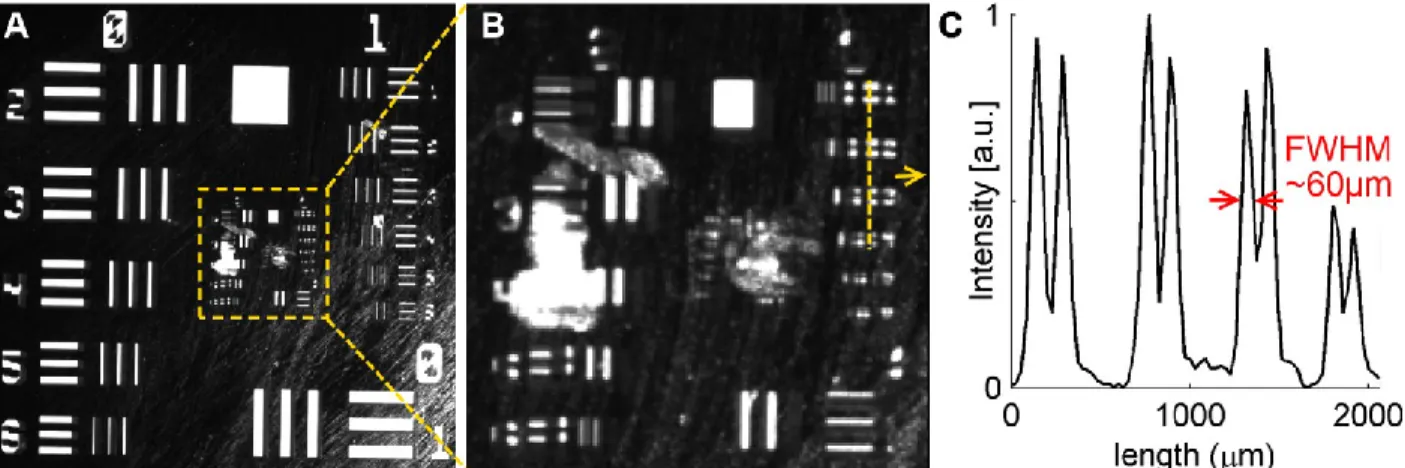
spectra of the LEDs (Green, Yellow and Red) used on the OIS imaging system. ... 16 Figure 1-3: (A) Full FOV of the resolution target (20×20mm2). (B) Zoom on the dotted square in A; the vertical dotted line is 2mm long and it is placed over the smallest resolvable features. (C) Intensity profile along the dotted line in B. ... 17 Figure 1-4: Variation of the speckle contrast C with the ratio correlation time to exposure time
τc/T. ... 19 Figure 2-1: L-curve analysis from a LOT reconstruction with SNR=60dB. The parameter that
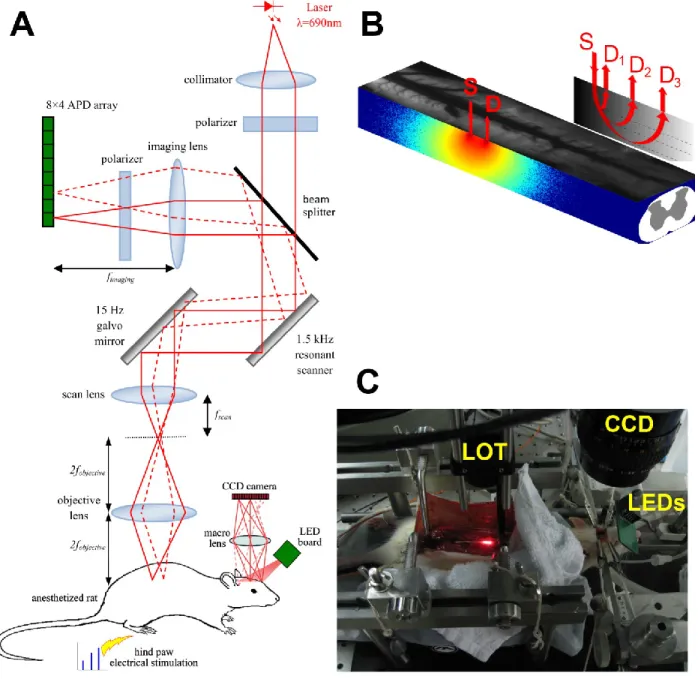
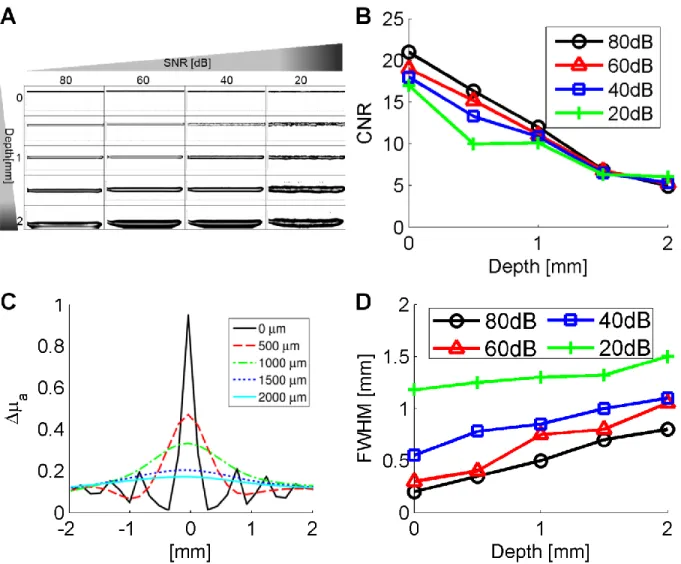
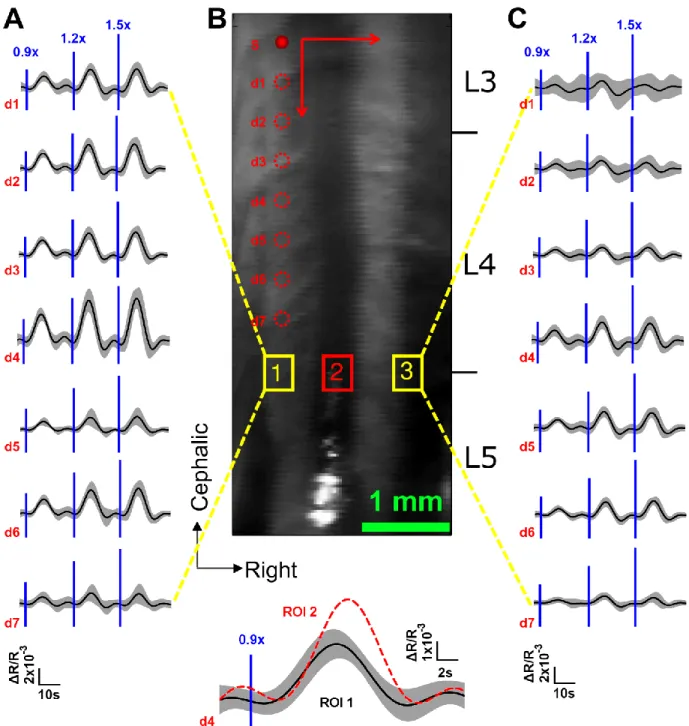
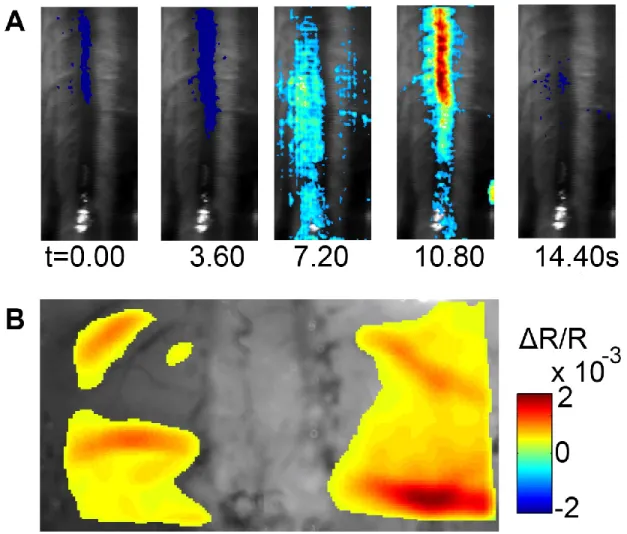
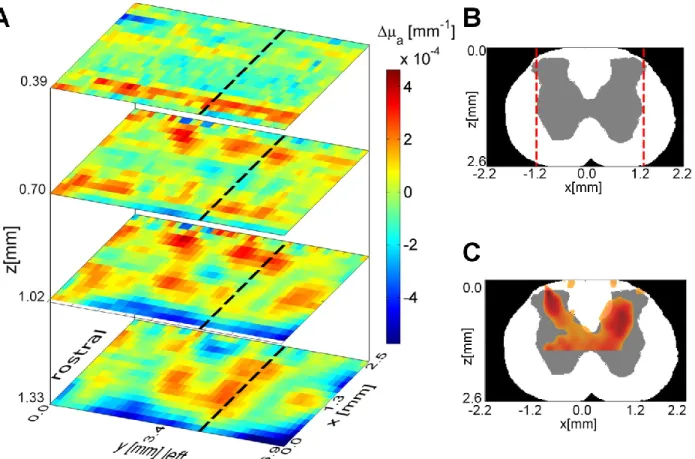
minimizes the error corresponds to the point of maximum curvature of this curve. In this case a value =5e-4 was chosen. ... 26 Figure 2-2: (A) Schematic illustration of multi-modal imaging system, showing LOT system design and CCD based intrinsic imager. (B) Depiction of the sensitivity matrix for a given source-detector pair. (C) Multi-modal imaging system experimental setup. ... 29 Figure 2-3: Regularized solutions and figures of merit for an absorbing stick at different depths and several signal to noise ratios. ... 31 Figure 2-4: Representative slices from the volume at 1 mm (A) Numerical complex phantom with 100% contrast, (B) reconstruction from simulated data. ... 32 Figure 2-5: (A) LOT measurements from an ink-filled tube immersed in an intralipid-ink dilution (µa=0.1mm-1, µs=10mm-1 at 680nm). Each column of data shows the tube at increasing depths z. Sensitivity functions for all source-detector separations rs,d shown on left. All units in mm. (B) representative slice of the reconstructed volume, the absorbing wire is placed along x axis at 1 mm depth. Some heterogeneity is observed near x=0, because the tube is slightly curved at the edge of the container. ... 33 Figure 2-6: LOT hemodynamic response evoked by left hind paw stimulus intensity at 0.9× , 1.2× and 1.5× muscle threshold in normal rat. (A) ROI 1 averaged time traces for all detectors,
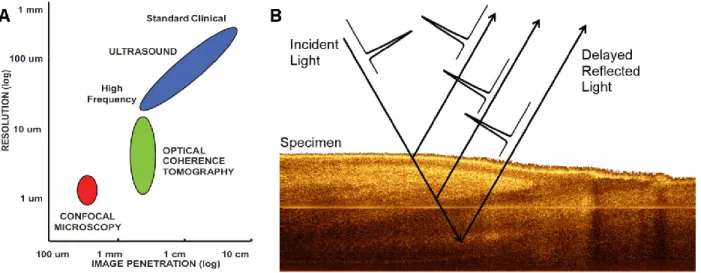
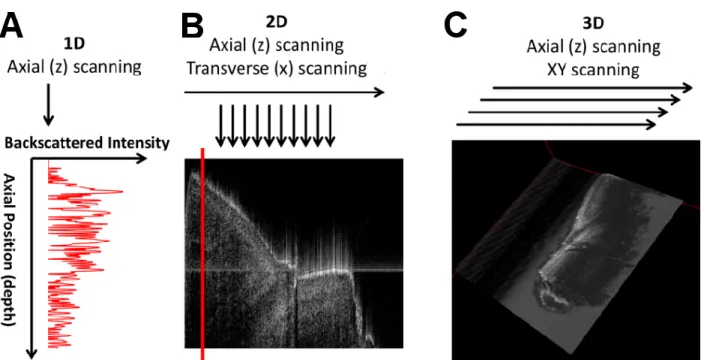
ipsilateral to stimuli. (B) Top: Image of the exposed spinal cord. Bottom: ROI 2 averaged time course showing delay with regard to ipsilateral activation. (C) ROI 3 averaged time traces for all detectors, contralateral to stimuli. ... 35 Figure 2-7: (A) Time course of LOT signals evoked by left hind paw stimulation collected at detector 1 over 15s at 0.9× muscular threshold. (B) Maximum intrinsic optical signal measured simultaneously on the somatosensory cortex. ... 36 Figure 2-8: (A) 3D map of neural activation in the spinal cord induced by left hind paw stimulation at the 0.9× muscle threshold. Ipsilateral activation around z = 0.4 mm is consistent with interneuron activation. (B) Histology based segmented model of lumbar spinal cord of the rat, used for Monte Carlo simulation of light propagation. Dotted red lines indicate the extent of field of view (C) Reconstruction viewed across the segmented volume along the dotted line in (A). ... 37 Figure 2-9: (A) Light propagation models with the gray matter positioned in different places. (B) L2 reconstruction error resulting from incorrect anatomical priors. ... 39 Figure 3-1: (A) OCT resolution compared to other imaging modalities. Reproduced from (Drexler & Fujimoto, 2008). (B) Echoes of light. ... 40 Figure 3-2: Basic configuration of a swept-source OCT. Modified from (Bouma, Tearney, Vakoc, & Yun, 2008). ... 42 Figure 3-3: OCT scanning modes. (A) A-line. (B) B-scan. (C) Volumetric OCT. ... 43 Figure 3-4: OCT system setup. ADC: Analog to Digital Conversion, AL: Aiming Laser, BPD: Balanced Photodetector, CIR: Circulator, COL: Collimator, DAQ: Data Acquisition board, DCB: Dispersion Compensation Block+Prisms, f1 and f2: Unitary relay, FC: Fiber Couplers, FPGA: Field-Programmable Gate Array, M: Mirror, NDF: Neutral Density Filter, PC: Polarization Controller, SPD: Short-pass dichroic, TCO: Telecentric Objective, X and Y: Galvo mirrors. ... 44 Figure 3-5: (A) Swept source laser spectrum. Average from three scans grabbed by the oscilloscope. (B) Schematic of the sample arm. (C) Schematic of the reference arm. For details refer to Figure 3-4 caption. ... 46
Figure 3-6: Dispersion compensation. (A) Axial PSF measured at different depths before dispersion compensation (D.C.). (B) Axial PSF measured at different depths after D.C. (C) FWHM as a function of depth. ... 49 Figure 3-7: (A) Scattering phantom made of resin with two polyethylene tubes. The maximum attainable depth is about 3 mm. (B) Image of a human fingertip, in this case the signal drops at depths >1mm. ... 51 Figure 3-8: Example of blood flow pulsatility in a single artery of a control mouse: (A) Two slices at 90º are measured. The average flow (red-blue) during a cardiac cycle is overlaid onto the structural image (grayscale). (B) The average speed is 0.88 mm/s for the X slice (solid black line) and 0.80 mm/s for the Y-slice (red dash-dot line) due to different size of the ROIs (yellow lines). The speed profile is very similar in both slices confirming that variation is due to heart beat. Variation between the maximum and the minimum speed are calculated (dotted lines). Variability (solid vertical lines) is defined as the standard deviation divided by the mean. ... 54 Figure 4-1: Principle of seed-based functional connectivity. (A) The ΔCMRO2 time course is
extracted from a specific region, e.g. the right somatosensory cortex SR. (B) Correlation
coefficients are computed between SR seed and all other pixels in the brain. The spatial
distribution shows both correlations (negative values) and anticorrelations (negative values), thresholded at an arbitrary value of |r| = 0.35. (C) The time course is shown for the seed region (SR red), a seed positively correlated with this seed region in the contralateral
somatosensory cortex (SL, orange, r = +0.6160) and a region negatively correlated with the
seed region in the right visual cortex (VR, blue, r = −0.5570). ... 58
Figure 4-2: Singular value decomposition of the correlation matrix of CMRO2 estimates is
shown. The first three singular values validate the seed-based correlation analysis. (A) A very strong sensori-motor network (B) Cingulate-Frontal network that anti-correlates with visual cortex (C) Retrosplenial-cingulate network (D) The first three orthogonal components visualized as red-green-blue (RGB) merged image. All images are overlaid on the anatomical image of the cortex acquired at λ=525nm. ... 61 Figure 4-3: Hierarchical clustering of CMRO2 measures (Nclusters = 12). (A) Dendogram showing clustering of pixels timecourses according to their correlation. (B) We see a clear delineation
of somatosensory-motor network in orange and a large network encompassing cingulate, retrosplenial and visual cortices in yellow. Clusters are overlaid on the anatomical image of the cortex acquired at λ=525nm. ... 62 Figure 5-1: (A) Overview of the intrinsic signal optical imaging system. LEDs and laser diode are time-multiplexed and synchronized to the acquisition system. A tungsten electrode is used to record LFP on the left somatosensory cortex. (B) Functional regions on the mouse cortex and seed placement and size, manually constructed from the work of (Bero et al., 2012). Dotted circle shows the placement of the LFP electrode. (C) Electrophysiology of 4-AP induced seizure. Top: Example showing some ictal discharges after an injection. 4-AP injection was finished at time 0. Middle: Zoom on a single ictal discharge. Bottom: Expanded view showing the onset of the discharge, the intermediate phase and the offset. (D) Filtered time traces of HbO2 and HbR at the epileptic focus (dotted circle in B), during
the seizure. ... 72 Figure 5-2: Seed-based HbO2 correlation maps for four mice. One control session and one
post-4-AP injection session are displayed for each mouse. (F: frontal cortex, M:motor cortex, C: cingulate cortex, S: somatosensory cortex R: retrosplenial cortex, V: visual cortex; subscripts L and R refer to left or right hemisphere, respectively). The scale for all correlation maps is from r = -1 to 1. Maps are shown overlaid on the anatomical image of the brain, acquired with green light. Seeds placement and sizes are indicated with black circles. ... 77 Figure 5-3: Regional bilateral functional correlation before and after the 4-AP injection, analysis done for every seed time-trace and its contralateral part. Contrasts shown: (A) HbO2, (B)
HbR (C) CBF and (D) CMRO2. * p<0.05, FDR corrected. Standard error bars shown
(σ/√N), with N=9. ... 79 Figure 5-4: Changes in bilateral functional correlation plotted vs. seizure duration (expressed as a percentage of the recording session) for different cortical regions and different contrasts. .. 81 Figure 6-1: (a) Overview of the intrinsic signal optical imaging system. LEDs and laser diode are time-multiplexed and synchronized to the acquisition system so that each recorded image corresponds to either a single LED wavelength (525, 590, 625 nm) or to the laser illumination (785 nm). (b) Functional regions on the mouse cortex and seed placement and
size, manually constructed from the work of Bero et al. (Bero et al., 2012). Abbreviations: F, frontal; M, motor; C, cingulate; S, somatosensory; R, retrosplenial; V, visual. ... 95 Figure 6-2: Average seed-based correlation maps. Images were manually aligned through an affine registration using ImageJ`s plugin TurboReg (Thevenaz, Ruttimann, & Unser, 1998). HbO2 contrast is shown. The scale for all correlation maps is -1≤r≤1. Maps are shown
overlaid on the anatomical image of one of the mice for reference (λ=525 nm). White circles denote seed position and size. Abbreviations: F: frontal cortex, M: motor cortex, C: cingulate cortex, S: somatosensory cortex R: retrosplenial cortex, V: visual cortex, (L) left seed, (R) right seed. ... 100 Figure 6-3: Regional bilateral functional correlation, comparison performed between control NaCl and treatment group CaCl2; analysis done for every seed time-trace and its
contralateral part. Contrasts shown: (a) HbO2, (b) HbR (c) CBF and (d) CMRO2. Standard
error bars shown (F: frontal cortex, M: motor cortex, C: cingulate cortex, S: somatosensory cortex R: retrosplenial cortex, V: visual cortex). ... 102 Figure 6-4: Functional connectivity diagrams for NaCl (top row) and CaCl2 (bottom row)
subjects. Edge thicknesses depend on the seed-to-seed average correlation coefficients, only edges with |r|>0.3 are shown. Node sizes are proportional to betweenness centrality CBn(G) of each seed. Positive correlations are depicted in warm colors. Negative correlations are depicted in cool colors. ... 104 Figure 6-5: Representative fc maps for all contrasts for a given seed (ML) (a)HbO2 (b)HbR (c)
CBF (d) CMRO2... 113
Figure 6-6: Regional bilateral functional connectivity, comparison performed between control NaCl and treatment group CaCl2; analysis done for every seed time-trace and its
contralateral part. Data points that were more than 3 standard deviations away from the mean were considered outliers and consequently removed. Contrasts shown: (a) HbO2, (b)
HbR (c) CBF and (d) CMRO2. Standard error bars shown (σ/√N), with N=19. (F: frontal
cortex, M: motor cortex, C: cingulate cortex, S: somatosensory cortex R: retrosplenial cortex, V: visual cortex). ... 114 Figure 7-1: (A) Arrow marks injection site. (B) Seeds placement, overlaid a coronal B-scan, averaged over 11 individual B-scans. Abbreviations: M, motor cortex; S1, primary
somatosensory cortex; S1BF, barrel field primary somatosensory cortex; LV, Lateral ventricle; CPu, Caudate putamen. Black dotted line indicates Left Cortex ROI used for locoregional SO2 measurement. White dotted rectangle indicates ROI used for local SO2
measurement in corpus callosum. Scale bar: 1mm. ... 121 Figure 7-2: Locoregional cortical saturation (SO2%) (A) Average SO2 weighted PAT image,
scale bar: 1mm (B)SO2 Comparison performed between LPS group (N=11), and NaCl
(sham) group (N=8). SO2 showed significant decrease in the LPS group compared to NaCl
group in left cortex (L) and corpus callosum (cc). The hemisphere contralateral (R) to injection showed no difference. *P<0.05, ***P<0.001. ... 125 Figure 7-3: TRITC-conjugated lectin staining of brain sections 24h after LPS or saline injection with the associated microvascular skeleton extracted with Angio Tool. A= left cortex; sham, B=left cortex; LPS, C= right cortex; sham, D = right cortex; LPS, E = corpus callosum; sham, F = corpus callosum; LPS. The average microvessel length in the left cortex of brains injected with LPS (B) is greatly reduced compared to brains injected with saline (A). Bar graphs of total microvessel length (G) and average microvessel length (H) in rat brain sections over the cortex and corpus callosum using the skeleton technique with AngioTool. Note the significant decrease in average microvessel length on the left cortex in brains injected with LPS (* p = 0.0093). Scale bar =100 μm. ... 126 Figure 7-4: In the cortex ipsilateral to the LPS injection locoregional SO2 measures are positively
correlated with average vessel length. ... 127 Figure 7-5: Regional bilateral functional correlation, comparison performed between LPS group (N=11), and NaCl (sham) group (N=8); analysis done for every seed time-trace and its contralateral part. Contrasts shown: (A) SO2, (B) HbT (C) HbO2 and (D) HbR.
Abbreviations: (M, motor cortex; S1, primary somatosensory cortex; S1BF, barrel field primary somatosensory cortex). ... 128 Figure 7-6: Framewise indices of data quality, the dotted line in insets A and B represents the threshold to signal suspect frames: (A) Framewise displacement (FD) of head position and (B) DVARS measure. All frames surpassing the threshold in FD and DVARS time courses are flagged, generating a temporal mask: (C)Frames flagged as having a FD>0.001mm and (D)Frames flagged as having a DVARS>3000. These temporal masks are augmented by
also marking 1 frame back and 2 frames forward to accommodate temporal smoothing of PAT data: (E)Augmented FD mask and (F) Augmented DVARS mask. (G) Temporal mask comprised of the intersection of E and F. ... 138 Figure A-1: Screenshots of an example of fcOIS toolbox running under SPM8. Configuration options for each individual module are shown on the right window. Module names are displayed on the left window: (A) Pre-processing stage (B) Analysis at subjects level (C) Analysis at group level. fcOIS toolbox is specifically conceived for batch processing of data. Its modules are executed automatically, one after another, with little user supervision. The processing pipeline is saved to a file, ensuring the reproducibility of the data analysis; this toolbox therefore allows users to concentrate on assessing the results. ... 194 Figure A-2: Screenshots of an example of fcPAT toolbox running under SPM8. Configuration options for each individual module are shown on the right window. Module names are displayed on the left window: (A) Pre-processing stage (B) Analysis at subjects level (C) Analysis at group level (D) Miscellaneous options. For details refer to Figure A-1. ... 195
LIST OF ACRONYMS AND ABBREVIATIONS
This list presents in alphabetical order the abbreviations and acronyms used in the thesis as well as their meanings.
4-AP 4-Aminopyridine
ADC Analog to Digital Conversion
AL Aiming Laser
BOLD Blood Oxygenation Level Dependent BPD Balanced Photodetector
CBF Cerebral Blood Flow CBV Cerebral Blood Volume CHD Coronary Heart Diseases CIR Circulator
CMRO2 Cerebral Metabolic Rate of Oxygen consumption
CNR Contrast-to-Noise Ratio COL Collimator
CVD Cardiovascular disease DAQ Data Acquisition board
DCB Dispersion Compensation Block DFT Discrete Fourier Transform EEG Electroencephalography fc Functional Connectivity
FC Fiber Coupler
fcEEG Electroencephalography Functional Connectivity
FDG Fluorodeoxyglucose
FD-OCT Fourier-Domain Optical Coherence Tomography fMRI Functional Magnetic Resonance Imaging
fNIRS Functional Near-Infrared Spectroscopy FOV Field of View
FPGA Field-Programmable Gate Array fs Sampling Frequency
FWHM Full Width at Half Maximum HbO2 Oxyhemoglobin
HbR Deoxyhemoglobin HbT Total hemoglobin
ICA Independent Component Analysis LFP Local Field Potential
LOT Laminar Optical Tomography LPS Lipopolysaccharide
LSCI Laser Speckle Contrast Imaging LSF Line Spread Function
M Mirror
Mbps Megabits per second
MRI Magnetic Resonance Imaging NA Numerical Aperture
NDF Neutral Density Filter NIRS Near-Infrared Spectroscopy OCT Optical Coherence Tomography
OD Optical Density
OIS Optical Imaging of Intrinsic Signals PAT Photoacoustic Tomography
PC Polarization Controller
PCA Principal Component Analysis PET Positron Emission Tomography PSF Point-Spread Function
PVL Periventricular Leukomalacia RCCA Right Common Carotid Artery
rsMRI Resting-State Functional Magnetic Resonance Imaging RSN Resting-State Network
RTE Radiative Transfer Equation SCI Spinal Cord Injury
SNR Signal-to-Noise Ratio SO2 Oxygen Saturation
SPD Short-Pass Dichroic
SS-OCT Swept Source Optical Coherence Tomography SVD Singular Value Decomposition
TCO Telecentric Objective
INTRODUCTION
Brain function has been traditionally studied in terms of physiological responses to the administration of external stimuli or tasks. From early physiology work (Hubel & Wiesel, 1962) to cognitive activation paradigms in humans (Raichle, 1998), this approach has been very valuable in linking brain topography with function; this perspective considers the brain to be mainly driven by external inputs, ignoring the fact that human brain consumes 20% of the body energy at rest, even though it accounts for less than 2% of total body mass (Raichle, 1998, 2010). A variety of functional imaging techniques have been developed to indirectly record the metabolic traces of neural activity in the central nervous system. About 23 years ago, one of the most promising modalities appeared, called functional magnetic resonance imaging (fMRI). fMRI uses a non-invasive method that relies on Blood Oxygenation Level Dependent (BOLD) contrast, due to the paramagnetic properties of HbR (Ogawa, Lee, Kay, & Tank, 1990).
The empirical motivation for studying spontaneous neural activity arose from the first observation of spatially coherent activity in the fMRI BOLD signal (B. Biswal, Yetkin, Haughton, & Hyde, 1995). In their seminal paper, Biswal and colleagues observed spontaneous fluctuations on the right motor cortex that were correlated with spontaneous fluctuations in its contralateral homologue, even during the absence of an overt motor task. This finding has been replicated by several groups since then, extending the studies from the motor cortex to the visual, auditory, and language processing regions (Cordes et al., 2001; De Luca, Beckmann, De Stefano, Matthews, & Smith, 2006; Fox, Snyder, Zacks, & Raichle, 2006; Greicius, Krasnow, Reiss, & Menon, 2003; Lowe, Dzemidzic, Lurito, Mathews, & Phillips, 2000). Brain regions that showed greater BOLD signal during rest than during task performance have also received attention; these regions that routinely exhibit decreased activity during experimental tasks have been labeled the default-mode network (Raichle et al., 2001). Functional connectivity is a method that describes the correlation of spatially remote areas in the temporal domain (Karl J Friston, 2011) and the regions of coherent activity found with functional connectivity methods have been termed resting-state networks (RSNs) (Fox & Raichle, 2007; la Iglesia-Vaya, Molina-Mateo, Jose, S., & Marti-Bonmati, 2013). Far from being pretty noise, spontaneous fluctuations are correlated within functionally related brain zones (Deco & Corbetta, 2011). While extensively used in humans, the application of fMRI in mice remains difficult, as the small size of murine brain
needs exceptionally good signal-to-noise ratio (SNR) and spatial resolution (Benveniste & Blackband, 2002; Jonckers, Van Audekerke, De Visscher, Van der Linden, & Verhoye, 2011); making it challenging to relate human studies to mouse models of disease, where molecular and genetic mechanisms are well-established. Although BOLD fMRI is widely used in functional imaging, it is subject to confounds due to the competing effects of changes in blood flow and oxygen metabolism. An attractive alternative to work around the limitations of fMRI is to use optical imaging in the small animal. First, it may be possible to reveal functional networks consistently identified in the resting-state. Second, using multiple wavelengths a complete set of hemodynamic parameters may be obtained and then be used to disambiguate the confounds present in the BOLD signal. Finally, translating the advances of functional connectivity fMRI to optical techniques in disease murine models would enable new studies on a multitude of cost-effective and efficient animal models, with high genetic similarity (European Commission Workshop, 2010). Therefore, the goal of this thesis is to combine a variety of optical imaging modalities with resting-state functional connectivity mapping.
The studies presented in this work aim to establish the utility of different optical imaging techniques such as multi-spectral intrinsic optical imaging, laser speckle imaging and photoacoustic tomography (PAT) to assess resting-state connectivity in various murine models. Using multiple illumination wavelengths, relative changes in HbO2 and HbR can be estimated,
while speckle imaging gives access to relative cerebral blood flow (CBF). This then enables estimations of CMRO2, a measurement more closely related to neural activity than hemoglobin
concentrations alone (Brieu, Beaumont, Dubeau, Cohen-Adad, & Lesage, 2010; Zappe, Uludag, Oeltermann, Ugurbil, & Logothetis, 2008). Hence, due to access to distinct hemodynamic components, functional connectivity based on optical imaging of intrinsic signals (fcOIS) may provide additional information that complements resting-state studies with fMRI in the context of neurological and vascular disease. PAT is a technique that combines the intrinsic contrast capabilities of optical imaging with the advantage of high spatial resolution of ultrasound (L. V. Wang & Hu, 2012). A short laser pulse is absorbed by molecules in living tissue, generating an ultrasonic pressure wave, which is detected by an ultrasound transducer to form images (X. Wang et al., 2003). Its non-invasive nature lends itself to application in newborn models and it also provides access to deeper layers of the brain.
The techniques presented in this thesis are an attempt to unravel the functional correlates of several disease models, leading to a better understanding of connectivity changes in rodent models.
Brief literature review
Proxy measures of neural activity
Brain imaging depends largely on evoked hemodynamic signals. In 1878, Mosso tested the hypothesis that blood flow is related to brain activity, recording changes in brain volume related to cerebral blood flow (CBF) on the exposed dura mater in the frontal region of a 37-year old subject (Mosso, 1884; Sandrone et al., 2013; Yu, Schummers, & Sur, 2010; Zago, Lorusso, Ferrucci, & Priori, 2012). He observed that pulsations in the frontal cortex increased during the performance of a computation task. Although modern imaging techniques are not based on the same principles as Mosso’s, his idea of indirect measurements of neural activity may be considered the precursor to modern functional neuroimaging.
When a neuron depolarizes, there is a localized oxygen consumption indicated by an initial increase in deoxyhemoglobin (HbR). A few seconds later (1–2 s), there is a large increase in CBF and cerebral blood volume (CBV) as a compensation mechanism to the initial oxygen utilization. This large mismatch between oxygen supply and consumption leads to a delayed augmentation in oxyhemoglobin (HbO2) concentration and the consequent dilution of HbR (Malonek & Grinvald,
1996). These responses have a temporal width of 4–6 s to even a very brief stimulus; this delay depends on the metabolic filter of each brain region, the choice of estimator and the duration of the stimulus (ON) period (C. H. Liao et al., 2002; Saad, DeYoe, & Ropella, 2003). Thus, activity of the neurons can be indirectly localized and quantified by measuring the hemodynamic changes following electrical activation: the so called hemodynamic response (HDR).
However, the relationship between neural activation and HDR remains complex, even non-linear (Devor et al., 2003). This non-linearity is more pronounced when comparing the HDR to a wide range of stimuli (Richard B. Buxton, Uludag, Dubowitz, & Liu, 2004). Another finding that is still subject to controversy in the literature (Chen & Pike, 2009) is the so-called “initial dip”: a decrease in HDR signal (from a HbR increase) lasting 1–2 s before the standard augmentation in HbO2; this initial dip has been reported in optical imaging (Malonek & Grinvald, 1996) but the
effect is small and not always present (R B Buxton, 2001); in some studies it has been shown that this initial augmentation of HbR is counterbalanced by an equal diminution in HbO2 (Devor et al.,
2003).
It is commonly accepted that precise regulation of blood flow involves the dilation of arterioles (Cox, Woolsey, & Rovainen, 1993), but it is not clear how the signal transfers from neurons to surrounding vasculature. One hypothesis claims that the activation of specific subsets of vasomotor interneurons can directly evoke dilation or constriction of adjacent vessels, transmuting neuronal signals into vascular responses (Cauli et al., 2004). Another hypothesis states that glutamate released from firing neurons initiates calcium waves in astrocytes; this post-synaptic calcium in turn induces the release of several vasoactive agents that are central to CBF increase (Iadecola, 2004). Furthermore, there is a growing body of evidence suggesting that astrocytes may be responsible for a critical component of neurovascular coupling and the HDR (Petzold & Murthy, 2011; Yu et al., 2010).
This complex neurovascular coupling makes the interpretation of optical imaging difficult. Nonetheless, neural activity is undoubtedly reflected in hemodynamic changes, which are detectable by the optical imaging techniques utilized in this work.
Functional connectivity
The term functional connectivity (fc) is applied to a variety of studies that examine coherent inter-regional correlations of neuronal activity during both cognitive tasks and rest (Fox & Raichle, 2007). In the present work, functional connectivity is explored in the absence of external stimuli. It is a technique sensitive to spatial and temporal synchronicity of fluctuations in neural activity from different brain areas, that may be spatially remote (Waites, Briellmann, Saling, Abbott, & Jackson, 2006). In the context of functional neuroimaging, fc is used to describe the relationship between the neurovascular activation patterns of anatomically separated regions. Synchronization has been measured by several methods, ranging from direct measures of neural activity such as local field potential (LFP) (Bressler, Ding, & Yang, 1999; Ding, Bressler, Yang, & Liang, 2000; Magill et al., 2006; Nir et al., 2008; Shmuel, Augath, Oeltermann, & Logothetis, 2006), electro-encephalography (EEG) (Aarabi, Wallois, & Grebe, 2008; Green, Sora, Bialy, Ricamato, & Thatcher, 1998; Mormann et al., 2003; C. J. Stam, Jones, Nolte, Breakspear, & Scheltens, 2007; Thatcher RW, Krause PJ, & Hrybyk M., 1986) and magnetoencephalography
(MEG) (Brookes et al., 2011; L Douw et al., 2013; Linda Douw et al., 2010; Z. Liu, Fukunaga, de Zwart, & Duyn, 2010; Pasquale et al., 2010), to indirect measures of neural-related fluctuations such as functional magnetic resonance imagining (fMRI) (Beckmann, DeLuca, Devlin, & Smith, 2005; B. Biswal et al., 1995; Damoiseaux et al., 2006; De Luca et al., 2006; Fox & Raichle, 2007; Greicius et al., 2003) and a variety of optical imaging techniques: near-infrared spectroscopy (NIRS) (Lu et al., 2010; Mesquita, Franceschini, & Boas, 2010; Sasai, Homae, Watanabe, & Taga, 2011; Wolf et al., 2011; H. Zhang et al., 2010), diffuse optical tomography (DOT) (S. M. Liao et al., 2012; Niu et al., 2011; Brian R. White et al., 2009; Brian R White, Liao, Ferradal, Inder, & Culver, 2012), optical imaging of intrinsic signals (OIS) (Bero et al., 2012; Li, Zhou, Luo, & Li, 2012; Brian R White et al., 2011) and photoacoustic tomography (PAT) (Xiang et al., 2012). The application of the aforementioned techniques will be described in the following sub-section.
Imaging techniques EEG & MEG in humans
EEG is a technique which uses electrodes to record the spontaneous electrical activity of the brain (Gibbs, Gibbs, & Lennox, 1937). Functional connectivity between networks of neurons can be inferred from the synchronization of their respective activities (Thatcher RW et al., 1986) and has been widely studied with EEG measures in several studies, ranging from Alzheimer’s disease (C. J. Stam et al., 2007), to spinal cord injury (Green et al., 1998) to epilepsy (Aarabi et al., 2008; Mormann et al., 2003; Ponten, Bartolomei, & Stam, 2007; Schindler, Leung, Elger, & Lehnertz, 2007; Wendling, Hernandez, Bellanger, Chauvel, & Bartolomei, 2005). Although invasive LFP recordings have been used to investigate task-related connectivity in the macaque cortex (Bressler et al., 1999; Ding et al., 2000; Shmuel et al., 2006; Stevenson & Körding, 2010), and the rodent brain (Magill et al., 2006), its application to human studies remains limited only to conditions where surgery management is needed, e.g. in epilepsy cases (B. J. He, Snyder, Zempel, Smyth, & Raichle, 2008; Nir et al., 2008). MEG is a non-invasive technology in which the magnetic fields induced by neuronal current flow in the brain are measured above the scalp (Cohen, 1972). Functional connectivity explored with MEG has added weight to the neural basis of fMRI (Z. Liu et al., 2010); this technique has been applied to the healthy brain (Brookes et al.,
2011; Pasquale et al., 2010), the epileptic brain (L Douw et al., 2013; Horstmann et al., 2010) and schizophrenic disease (Hinkley et al., 2010).
fMRI in humans
Several studies have shown that fMRI could use blood as a proxy for measuring the response of the neurons to sensory stimulation (Kwong et al., 1992; Ogawa et al., 1992). A similar technique using MRI to map the human visual cortex had appeared a few months earlier (Belliveau et al., 1991), with the inconvenience that a contrast agent had to be injected. fMRI is a safer and more comfortable alternative to positron emission tomography (PET), which uses a radioactive modified glucose called fluorodeoxyglucose (FDG); it is traced as it flows through the human body and its consumption will indicate the particular areas of the brain with a higher metabolism, indicating a higher neural activity (Alavi et al., 1986). PET has been widely used in both health and disease (K J Friston, Frith, Liddle, & Frackowiak, 1993), despite its poor spatial resolution, which is a limitation to human brain imaging (Dharmarajan & Schuster, 2012).
Functional connectivity was first demonstrated by fMRI detecting low-frequency variations (<0.1Hz) in the motor cortex without any external stimuli, i.e. during resting-state (B. Biswal et al., 1995). The original validation of Biswal and colleagues was that left and right hemispheric regions of the primary motor region are not silent, but show a high correlation between their BOLD time-series; the resulting spatial correlations correspond with the brain’s functional activation maps as elicited by task-evoked responses.
Functional communication between separate brain regions plays an important role in complex processes; these correlations yield detailed maps of complex neural systems (B. B. Biswal et al., 2010). The observed RSNs could be consistently identified across subjects and within groups (Damoiseaux et al., 2006; De Luca et al., 2006). Therefore, the examination of functional connectivity might be of high importance because it could provide insights into the intrinsic brain organization and reorganization with cognitive processes, pathology and drug effects (Gusnard, Raichle, & Raichle, 2001; Raichle, 2011; Raichle et al., 2001; van den Heuvel & Hulshoff Pol, 2010). Several interesting studies have sprung up from these observations, assessing possible impaired functional connectivity in aging (Damoiseaux et al., 2008; J. Sun, Tong, & Yang, 2011), dementia (Gili et al., 2011; Greicius, Srivastava, Reiss, & Menon, 2004; Y. He, Chen, Gong, & Evans, 2009; Rombouts et al., 2009; Sanz-Arigita et al., 2010), epilepsy (W. Liao et al.,
2011; C. Luo et al., 2012; Mankinen et al., 2012; Waites et al., 2006; Z. Wang et al., 2011; Z. Zhang et al., 2009), cardiovascular disease (Cheng et al., 2012; Y. Sun et al., 2011; van Norden et al., 2011), schizophrenia (Lawrie et al., 2002; Y. Liu et al., 2008; Whitfield-Gabrieli et al., 2009) and depression (Greicius et al., 2007).
The discovery of functional connectivity MRI has led to a wide application in neuroimaging research (B. B. Biswal et al., 2010; Fox & Raichle, 2007; van den Heuvel & Hulshoff Pol, 2010), including insights into infant brain development (Fair et al., 2007, 2008; Fransson et al., 2007), the preterm infant (Damaraju et al., 2010; Doria et al., 2010; W.-C. Liu, Flax, Guise, Sukul, & Benasich, 2008; Smyser et al., 2010) and pediatric Tourette syndrome (Church et al., 2009).
Optical imaging in humans
Optical imaging has strong clinical potential, because it has the ability to monitor brain function in longitudinal, non-invasive way, not unlike fMRI, while providing better temporal resolution and sensitivity to two distinct endogenous contrasts HBO2 and HbR. The translation of resting
state fMRI to optical techniques, such as NIRS has enabled new developmental studies. Yet, its application poses significant challenges due to the influence of systemic physiology and superficial signals. Spontaneous low frequency fluctuations of brain hemodynamics have been investigated by NIRS (Elwell, Springett, Hillman, & Delpy, 1999; Mesquita et al., 2010; Obrig et al., 2000). Temporal correlations using NIRS have been found in resting-state adults (Toronov et al., 2000; Wolf et al., 2011), in elderly subjects (Schroeter, Schmiedel, & von Cramon, 2004) and in sleeping infants (Taga et al., 2000). The aforementioned findings have motivated several studies using NIRS that have successfully demonstrated functional connectivity (Lu et al., 2010; H. Zhang et al., 2010), outlining frequency-specific characteristics, dependent on the studied brain regions (Sasai et al., 2011). While such studies have shown interesting results, they suffer from performance limitations, such as low spatial resolution (~3cm, barely sufficient to resolve the spatial extent of the BOLD response ~4cm3 (Saad, Ropella, DeYoe, & Bandettini, 2003)) that may average spatial correlations and the need of a large FOV to cover both correlated and uncorrelated regions (Brian Richard White, 2012). These limitations have prompted the use of DOT systems with high-density of sources and detectors; this approach has the capability to yield three-dimensional reconstructions of hemoglobin maps through the resolution of the inverse problem. Resting-state functional connectivity has been since revealed by DOT in both in the
adult brain (Niu et al., 2011; Brian R. White et al., 2009) and the neonatal brain (Brian R White et al., 2012).
fMRI in animals
The application of fMRI in the animal brain has remained scarce, because a high intensity magnetic field is required in order to obtain sufficient SNR and spatial resolution for small animal imaging (Benveniste & Blackband, 2002; Jonckers et al., 2011); until recent demonstrations, functional connectivity-MRI (fcMRI) has been limited to either the rat brain (Bifone, Gozzi, & Schwarz, 2010; B. B. Biswal & Kannurpatti, 2009; Hutchison, Mirsattari, Jones, Gati, & Leung, 2010; Kalthoff, Seehafer, Po, Wiedermann, & Hoehn, 2011; Kannurpatti, Biswal, Kim, & Rosen, 2008; Magnuson, Majeed, & Keilholz, 2010; Pawela et al., 2008, 2009, 2010; van Meer, van der Marel, Otte, Berkelbach van der Sprenkel, & Dijkhuizen, 2010; F. Zhao, Zhao, Zhou, Wu, & Hu, 2008) or the monkey brain (Moeller, Nallasamy, Tsao, & Freiwald, 2009; Shmuel & Leopold, 2008; Teichert, Grinband, Hirsch, & Ferrera, 2010; Vincent et al., 2007). Extending these studies to a well-established and widely used species in clinical research, such as the mouse, would permit the use of this tool in multiple robust disease models. In this context, a recent effort was made to establish a comparison of resting-state functional maps between the mouse and the rat (Jonckers et al., 2011).
Optical imaging in animals
Despite many advantages offered by the non-invasive nature of fMRI, there has been intense debate on the origin of the measured signal, especially because the measured BOLD effect is the combination of several metabolic byproducts: HbR concentration, CBF and CBV within a voxel on the order of the cubic millimeter and within a temporal resolution (repetition time, TR) around 2 – 3 seconds, for a typical fMRI acquisition (De Luca et al., 2006). Therefore, independent measures of HbR, HbO2, CBV and CBF with high spatial (~50μm) and temporal resolution (~5
Hz) is a key to better characterize vascular dynamics at the cortex level.
Optical imaging of intrinsic signals (OIS) is a technique that can be used to compute measurements of blood oxygenation, based on the distinct absorption spectra of HbO2 and HbR.
The setup is relatively simple: light at the appropriate wavelengths is shone upon the exposed nervous tissue and images are then captured with a CCD camera. The neuronal activity changes the local concentration in HbO2 and HbR. Consequently, the light absorption properties of
nervous tissue are modified due to fluctuations in these components, meaning that the amount of reflected light will also change. OIS has been applied in neuroscience research (Frostig, Lieke, Ts’o, & Grinvald, 1990; Grinvald, Lieke, Frostig, Gilbert, & Wiesel, 1986; Ts’o, Frostig, Lieke, & Grinvald, 1990) and has been since a well-established method to image neural activity in the exposed cortex of the animal (Cang, Kalatsky, Löwel, & Stryker, 2005; Dunn, Devor, Dale, & Boas, 2005; W. Luo, Li, Chen, Zeng, & Luo, 2007).
Whereas OIS provides measurements of blood oxygenation, it does not explicitly measure blood flow. Laser speckle contrast imaging (LSCI) is used to provide relative variations in CBF. LSCI uses a similar setup to OIS, but the light is replaced with a diverging laser diode (E. M. C. Hillman, 2007). When this coherent light is incident upon a turbid medium, such as biological tissue, it scatters producing an interference pattern called speckle (Boas & Dunn, 2010). Speckle contrast is quantified from the blurred images at each time point (the ratio of standard deviation to mean intensity). If there are moving scatterers in tissue, such as blood cells, each speckle will be fluctuating in intensity. These fluctuations cause a blurring of the speckle, leading to a reduction in the speckle contrast. Therefore blood flow variations can be determined from speckle contrast variations (Boas & Dunn, 2010; Dunn, Bolay, Moskowitz, & Boas, 2001). CMRO2 can be estimated from blood flow and blood volume measurements (Dunn et al., 2005;
M. Jones, Berwick, Johnston, & Mayhew, 2001; Mayhew et al., 2000). Assuming that changes in CBV are proportional to changes in HbT, the Grubb equation can be used to explore the relationship between HbT and CBF (Grubb, Raichle, Eichling, & Ter-Pogossian, 1974). The simultaneous measurement of multiple hemodynamic parameters has provided a more complete picture of the hemodynamic response to functional activation (Dunn et al., 2005). This technique has assessed lesions in the spinal cord (Brieu et al., 2010) as well as effects of cerebral ischemia on the cerebral cortex (P. B. Jones et al., 2008; Luckl et al., 2010).
Photoacoustic tomography in animals
Photoacoustic tomography (PAT) is a non-invasive technique that combines the intrinsic contrast capabilities of optical imaging with the advantage of high spatial resolution of ultrasound (L. V. Wang & Hu, 2012). A short laser pulse is absorbed by molecules in living tissue, generating an ultrasonic pressure wave, which is detected by an ultrasound transducer to form images (X. Wang et al., 2003). Application of PAT imaging to study functional connectivity is uncommon. An
application was recently showed (Xiang et al., 2012) where epileptic brain networks were analyzed through the Granger causality method (Granger, 1969).
Objectives
O1: The first aim of this thesis was to develop tools for the analysis of functional connectivity
using optical imaging. These tools were then validated in an acute murine model of epilepsy. For this aim the following hypotheses were tested:
H1.1: Regional bilateral functional connectivity is disrupted after the injection of a focal
epileptogenic agent.
H1.2: Changes in functional connectivity correlate with seizure duration.
The article related to this objective is:
Guevara, E., Pouliot, P., Nguyen, D. K., & Lesage, F. (2013). Optical imaging of acute epileptic networks in mice. Journal of Biomedical Optics, 18(7), 076021–076021. doi:10.1117/1.JBO.18.7.076021.
O2: The second objective was to use functional connectivity methods to investigate changes in a
novel carotid stiffness murine model, testing the following hypothesis:
H2.1: Uncoupling is shown between hemodynamic measures and metabolic activity in
bilateral functional correlations.
H2.2: Resting state functional networks derived from hemodynamic signals are disrupted
following a unilateral carotid artery calcification. The paper where this objective is pursued is:
Guevara, E., Sadekova, N., Girouard, H., & Lesage, F. (2013). Optical imaging of resting-state functional connectivity in a novel arterial stiffness model. Submitted to Biomedical Optics
Express.
O3: Finally, the third aim was to use photoacoustic tomography (PAT) imaging resting-state to
assess the impact of an acute inflammatory injury in the neonatal rat brain. The following hypothesis was put under test:
H3.1: Local SO2 values are significantly lower in the injured group, as compared to sham
controls.
H3.2: Bilateral functional connectivity decreases significantly in pups with inflammatory
brain injury.
The article related to this objective is:
Guevara, E., Berti, R., Londono, I., Xie, N., Bellec, P., Lesage, F., & Lodygensky, G. A. (2013). Imaging of periventricular leukomalacia in the newborn rat brain with photoacoustic tomography.
Submitted to PLOS ONE.
Other contributions
Within the work performed for this thesis, preliminary and sometimes complementary results were obtained separately; these efforts are described in the following publications:
In the exploration of optical imaging in the spinal cord, I was able to contribute to the following articles:
Ouakli, N., Guevara, E., Dubeau, S., Beaumont, E., & Lesage, F. (2010). Laminar optical tomography of the hemodynamic response in the lumbar spinal cord of rats. Optics Express,
18(10), 10068–10077. doi:10.1364/OE.18.010068
Beaumont, E., Guevara, E., Dubeau, S., Lesage, F., Nagai, M., & Popovic, M. R. (2013). Functional electrical stimulation post spinal cord injury improves locomotion and increases afferent input into the central nervous system in rats. Journal of Spinal Cord Medicine. doi:
http://dx.doi.org/10.1179/2045772313Y.0000000117 And the following conferences:
Beaumont, E., Guevara, E., Nagai, M., Lesage, F., & Popovic, M. R. (2010). Optimizing the spinal cord neuronal circuitry to restore locomotion after a spinal cord injury by using functional electrical stimulation. In Neuroscience 2010 (Vol. 40, p. 259.28). Presented at the Neuroscience 2010, San Diego, CA, USA: Society for Neuroscience. Retrieved from
the+spinal+cord+neuronal+circuitry+to+restore+locomotion+after+a+spinal+cord+injury+by+us ing+functional+electrical+stimulation%22&source=bl&ots=cJYtrgWvV9&sig=GTeDym6DTe0k jjKtiEFAiaw9Y_U&hl=en&sa=X&ei=5r0SUdCeMIT9ygGXvIGADA&ved=0CCwQ6AEwAA Guevara, E., Abran, M., Belanger, S., Ouakli, N., & Lesage, F. (2010). Comparison of the performance of two depth-resolved optical imaging systems: laminar optical tomography and spatially modulated imaging. In A. P. Wax & V. Backman (Eds.), Biomedical Applications of
Light Scattering IV (Vol. 7573, pp. 757317–10). Presented at the Biomedical Applications of
Light Scattering IV, San Francisco, California, USA: SPIE. doi:10.1117/12.841886
Guevara, E., Ouakli, N., Dubeau, S., Beaumont, E., & Lesage, F. (2010a). Hemodynamic response revealed by laminar optical tomography in rat lumbar cord. In GRSTB 2010 Student
Poster Day. Presented at the GRSTB 2010 Student Poster Day, University of Montreal.
Guevara, E., Ouakli, N., Dubeau, S., Beaumont, E., & Lesage, F. (2010b). Réponse hémodynamique dans la moelle épinière du rat mesurée à l’aide de la tomographie laminaire optique. In 78ième congrès de l’ACFAS. Presented at the 78ième congrès de l’ACFAS, Université de Montréal. Retrieved from http://www.acfas.net/programme/c_78_219.html# Guevara, E., Beaumont, E., & Lesage, F. (2011). Imaginología óptica en la médula espinal. In
18a. Semana de La Ciencia y Tecnología. Presented at the 18a. Semana de La Ciencia y Tecnología, Universidad Tecnológica de Tula–Tepeji, México.
As part of the applications of optical coherence tomography I collaborated in this article:
Sadekova, N., Vallerand, D., Guevara, E., Lesage, F., & Girouard, H. (2013). Carotid calcification in mice: a new model to study the effects of arterial stiffness on the brain. Journal of
the American Heart Association, 2(3), e000224. doi:10.1161/JAHA.113.000224
And the following conferences:
Guevara, E. (2012a, April 27). Optical Coherence Tomography. Presented at the First Mexican-Canadian Biomedical Imaging Meeting, Coordinación para la Innovación y la Aplicación de la Ciencia y Tecnología de la UASLP.
Guevara, E. (2012b, May 16). Tomografía por Coherencia Óptica. Invited conference, Instituto Tecnológico Superior de San Luis Potosí.
Sadekova, N., Vallerand, D., Guevara, E., Lesage, F., & Girouard, H. (2013). La calcification des carotides altère l’homéostasie cérébrale chez la souris. In 21e Réunion Scientifique Annuelle. Presented at the Congrès de la Société Québécoise d’Hypertension Artérielle, Montreal (Canada). Retrieved from http://www.hypertension.qc.ca/gestion/pdf/2013-Sciences-fondamentales.pdf
Finally, the preliminary results contributing to the objective O3 of this thesis were presented in the conference:
Berti, R., Matteau-Pelletier, C., Guevara, E., Londono, I., Lesage, F., & Lodygensky, G. A. (2013). Locoregional Cortical Oxygen Saturation and Resting State Assessment by Photoacoustic Imaging Following an Inflammatory Injury in the Neonatal Rat Brain. In Pediatric Academic
CHAPTER 1
OPTICAL IMAGING OF INTRINSIC SIGNALS
Optical methods, such as intrinsic and speckle imaging have proved being useful to study neural function in the small animal. These optical techniques can distinguish distinct hemoglobin types (HbO2 and HbR) and CBF, providing a whole set of hemodynamic parameters to assess neuralactivity. Both these techniques have been successfully applied to imaging neural activity on the exposed cortex of the small animal (Dunn et al., 2003, 2005; M. Jones et al., 2001).
1.1 Optical Intrinsic Signals (OIS) system description
Optical images based on intrinsic signals (OIS) were acquired with a 12-bit CCD camera (Pantera 1M60, DS-21-01M60-12E, Teledyne Dalsa, Waterloo, ON) with a pixel size of 12μm and full resolution of 1024×1024 pixels. The setup used in this work is depicted in Figure 1-1A:
Figure 1-1: (A) Overview of the intrinsic signal optical imaging system. (B) Sensitivity profile of optical imaging of intrinsic signals (λ=625nm).
A custom-made interface programmed in LabView controls the camera, grabs images and physiological signs, while synchronizing acquisition and illumination. A Macro Lens (105mm f/2.8max, Sigma Corp., Ronkonkoma, NY) with small focal depth (350 μm) is used. Reflectance
images of the brain cortex are recorded with time-multiplexed illumination (525, 590, 625 nm) produced by 10W LEDs (LZ4-00MA00, Led Engin, San Diego, CA). Illumination for speckle imaging was provided by 90 mW, 785 nm laser diode (L785P090, Thorlabs, Newton, NJ) and aperture was adjusted to f/8, so that the pixel size and speckle size are matched (Briers, 2001). Aperture adjustment is important to ensure proper sampling of the speckle pattern: the size of a single speckle should be equal to the width of the diffraction-limited spot size and is given by ⁄ , where λ is the wavelength and f/# is the f-number of the system (Dunn et al., 2001). The four illumination diodes are interleaved, which yields a full-frame rate of 5 Hz for each wavelength. A 2×2 binning on camera is performed to allow continuous data streaming to hard drive. Illumination is usually adjusted so that no part of the brain is under- or over-saturated by any of the wavelengths. The exposure time of the camera is set to 10 ms. The whole optical setup is mounted on an optic table with tuned damping (RS 2000, Newport, Irvine, CA) to avoid spurious signals from vibrations.
1.2 OIS theory
Brain optical absorption in the visible spectrum originates primarily from the two types of hemoglobin: HbO2 and HbR. Knowing their molar extinction coefficients , their differential
path length factor D(λ) and assuming a baseline molar concentration , changes in hemoglobin concentration can then be estimated with optical measurements at two different wavelengths, at least. Figure 1-2 shows the molar extinction coefficients of both types of hemoglobin as a function of wavelength, along with the spectral profile of the LEDs used in the OIS setup.
The analysis of spectroscopic images was based on previously published work (Dubeau, Ferland, Gaudreau, Beaumont, & Lesage, 2011; Dunn et al., 2003). In short reflectance images from each LED wavelength were recorded with the CCD camera and interpreted as changes in attenuation (optical density) , where I is the reflected light intensity and I0 the incident light
intensity. Relative changes in oxy- and deoxyhemoglobin were found using the modified Beer-Lambert law (Delpy et al., 1988) and a Moore-Penrose pseudoinverse:
D(λ) was taken from (Dunn et al., 2005) and values out of the 560-610 nm range were
extrapolated from (Kohl et al., 2000). Total hemoglobin baseline concentration of 100 μM with 60% oxygen saturation was assumed (Dunn et al., 2005) for the spectroscopic analysis. These hemoglobin values were estimated for the whole rat brain in the study by (Mayhew et al., 2000). The hemoglobin molar extinction coefficients (see Figure 1-2) were obtained from (Prahl, 1999); describes the probability of photon interaction (absorption or scattering) with the medium per unit path-length and per molar concentration (L. V. Wang & Wu, 2007, p. 6). Reflectance values were corrected for the spectral response of the CCD camera and convolved with the LEDs spectral power distribution (Brieu et al., 2010).
Figure 1-2: Optical absorption of oxy- and deoxy-hemoglobin (HbO2 and HbR) and measured
spectra of the LEDs (Green, Yellow and Red) used on the OIS imaging system.
In the computation of hemoglobin concentrations light absorption was assumed to be uniform all over the imaged FOV. Since penetration depth in tissue depends on the wavelength, some