Université de Montréal
Development of an Awake Behaving model for
Laser Doppler Flowmetry in Mice
par Dima Obari
Département de pharmacologie et physiologie,
Faculté de médecine
Mémoire présenté à la Faculté des études supérieures
en vue de l’obtention du grade de Maîtrise ès Sciences (M. Sc.)
en pharmacologie
Août, 2017
Résumé
Bien que le cerveau ne constitue que 2% de la masse du corps chez les humains, il présente l’activité métabolique la plus élevée dans le corps, et en conséquence, constitue un organe hautement vascularisé. En fait, l’approvisionnement en sang dans le cerveau est strictement modulé au niveau régional par un mécanisme fondamental nommé couplage neurovasculaire (CNV), qui associe les besoins métaboliques locaux au flux sanguin cérébral [1, 2]. Notre compréhension du CNV sous des conditions physiologiques et pathologiques a été améliorée par un large éventail d’études menées chez les rongeurs. Néanmoins, ces études ont été réalisées soit sous anesthésie, soit chez la souris éveillée et immobilisée, afin d’éviter le mouvement de la tête pendant l'acquisition de l'image. Les anesthésiques, ainsi que le stress induit par la contention, peuvent altérer l'hémodynamique cérébrale, ce qui pourrait entraver les résultats obtenus. Par conséquent, il est essentiel de contrôler ces facteurs lors de recherches futures menées au sujet de la réponse neurovasculaire.
Au cours de l’étude présente, nous avons développé un nouveau dispositif pour l'imagerie optique éveillée, où la tête de la souris est immobilisée, mais son corps est libre de marcher, courir ou se reposer sur une roue inclinée. En outre, nous avons testé plusieurs protocoles d'habituation, selon lesquels la souris a été progressivement entraînée pour tolérer l’immobilisation de tête, afin de minimiser le stress ressenti lors des sessions d'imagerie. Enfin, nous avons, pour la première fois, cherché à valider l'efficacité de ces protocoles d'habituation dans la réduction du stress, en mesurant l'évolution des taux plasmatiques de corticostérone tout au long de notre étude.
Nous avons noté que les souris s'étaient rapidement adaptées à la course sur la roue et que les signes visibles de stress (luttes, vocalisations et urination) étaient nettement réduits suite à deux sessions d'habituation. Néanmoins, les taux de corticostérone n'ont pas été significativement réduits chez les souris habituées, par rapport aux souris naïves qui ont été retenues sur la roue sans entraînement préalable (p> 0,05).
Ce projet met en évidence la nécessité d'une mesure quantitative du stress, car une réduction des comportements observables tels que l'agitation ou la lutte peut être indicative non pas d'un niveau de stress plus faible, mais plutôt d'un désespoir comportemental. Des recherches supplémentaires sont nécessaires pour déterminer si la fixation de la tête lors de l'imagerie optique chez la souris peut être obtenue avec des niveaux de stress plus faibles, et si le stress induit par la contrainte effectuée avec notre dispositif est associé à des changements de la réponse hémodynamique.
Mots clés – débit sanguin cérébral, couplage neurovasculaire, imagerie optique, anesthésie, stress, corticostérone, souris.
Abstract
Whilst the brain only constitutes 2% of total body weight in humans, it exhibits the highest metabolic activity in the body, and as such is a highly vascularized organ. In fact, regional blood supply within the brain is strictly modulated through a fundamental process termed neurovascular coupling (NVC), which couples local metabolic needs with cerebral blood flow [1, 2]. A wide array of optical imaging studies in rodents has enhanced our understanding of NVC under physiological and pathological conditions. Nevertheless, these studies have been performed either under anesthesia, or in the awake mouse using restraint to prevent head-motion during image acquisition. Both anesthetics and restraint-induced stress have been clearly shown to alter cerebral hemodynamics, thereby potentially interfering with the obtained results [3, 4]. Hence, it is essential to control for these factors during future research which investigates the neurovascular response.
In the present study, we have developed a new apparatus for awake optical imaging, where the mouse is head-restraint whilst allowed to walk, run or rest on an inclined wheel. In addition, we have tested several habituation protocols, according to which the mouse was gradually trained to tolerate head-restraint, in order to minimize the stress experienced during imaging sessions. Lastly, we have, for the first time, sought to validate the efficiency of these habituation protocols in reducing stress, by measuring the evolution of plasma corticosterone levels throughout the study.
We noted that the mice had quickly adapted to running on the wheel, and that the overt signs of stress (struggling, vocalizations and urination) were clearly reduced within two
habituation sessions. Nevertheless, corticosterone levels were not significantly reduced in habituated mice, relative to naïve mice that were restrained on the wheel without prior training (p > 0.05).
This project highlights the necessity for a quantitative measure of stress, as a reduction in observable behaviors such as agitation or struggling may be indicative not of lower stress, but rather, of behavioral despair. Further research is needed to determine whether head-fixation during optical imaging in mice can be achieved with lower stress levels, and if restraint-induced stress using our apparatus is associated with changes in the hemodynamic response.
Keywords – cerebral blood flow, neurovascular coupling, optical imaging, anesthesia, stress, corticosterone, mice.
Table of Contents
Résumé ... ii
Abstract ... iv
Table of Contents ... vi
List of Figures ... viii
List of Tables ... ix
Abbreviations ... x
Acknowledgments ... xii
Introduction ... 1
Overview ... 1
1. Anatomy and Ultrastructure of the Cerebral Vasculature ... 2
1.1 Major Arteries of the Brain ... 2
1.2 Intracerebral Vessels ... 3
1.2.1 Architecture of the Cerebrovascular Tree ... 3
1.2.3 Perivascular Innervation ... 5
2. Regulation of Cerebral Blood Flow ... 6
2.1 Cerebral Autoregulation ... 6
2.2 Neurovascular coupling ... 8
2.2.1 Neuronal Signaling ... 8
2.2.2 Astrocytic Signaling ... 8
2.2.3 Role of Pericytes ... 10
3. Effect of Anesthetics on Cerebral Blood Flow ... 11
3.1 Cerebral Hemodynamics ... 11
3.2 Brain Resting Metabolism ... 12
3.3 Neuronal, Glial and Vascular cells ... 13
4. Optical Imaging Techniques for Evaluating the Hemodynamic Response in Awake Behaving Rodents ... 17
4.1 Laser Doppler Flowmetry (LDF) ... 19
4.1.1 Theoretical Background ... 19
4.1.2 Technical Specifications ... 21
4.1.3 Applications in Awake Behaving studies... 23
4.2 Laser Speckle Contrast Imaging (LSCI) ... 23
4.3 Intrinsic Imaging ... 26
4.5 Multimodal imaging and Optogenetics ... 29
5. Implications of Stress in Conscious Imaging ... 31
5.1 Effect of Stress on Cerebral Hemodynamics ... 31
5.2 Stress-induced Modulation of the Neurovascular Unit ... 32
Aims and Hypothesis ... 35
Animals ... 37
Main Procedures ... 37
1. Development of a Custom-Made Restraint Apparatus ... 37
2. Head Bar Installation Surgery ... 40
2.1 Head Bars ... 40
2.2 Anesthesia Induction ... 41
2.3 Surgical Procedure ... 41
2.3 Postoperative Care ... 43
3. Acclimation to Head Restraint... 43
4. Bone thinning ... 43
5. Laser Doppler flowmetry ... 44
6. Corticosterone ELISA ... 44
7. Experimental Series ... 46
8. Statistical Analyses ... 46
Results ... 46
1. Laser Doppler flowmetry ... 46
2. Corticosterone ELISA ... 48 Experimental Series 1 ... 48 Experimental Design ... 48 Findings ... 50 Experimental Series 2 ... 51 Experimental Design ... 51 Findings ... 52 Experimental Series 3 ... 54 Experimental Design ... 54 Findings ... 54 Further Analyses ... 56
Discussion ... 58
1. Development of a head-restraint apparatus for optical imaging in awake behaving mice (objective 1) ... 59
2. Habituation to head-restraint (objective 2) ... 60
3. Quantitative evaluation of stress (objective 3) ... 64
Conclusion and Future Directions ... 68
List of Figures
Figure 1. Arterial blood supply: from the aortic arch to the brain. ... 2
Figure 2. Moving down the cerebral vasculature. ... 4
Figure 3. Perivascular innervation of cerebral blood vessels. ... 5
Figure 4. Autoregulation of blood flow with changing blood pressure. ... 7
Figure 5. Major pathways of neuron and astrocyte-mediated neurovascular coupling. ... 9
Figure 6. Principle of Laser Doppler Flowmetry. ... 21
Figure 7. High resolution image of rat brain vasculature using laser speckle contrast. ... 24
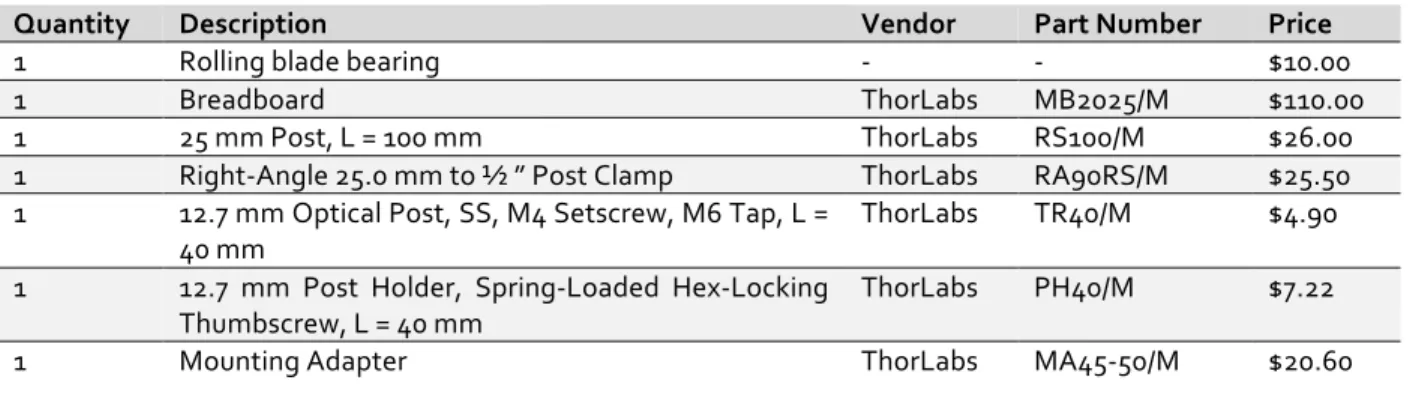
Figure 8. Development of a Restraint Apparatus for Conscious Imaging in Mice. ... 39
Figure 9. Dimensions (in mm) of the custom-made titanium head bar. ... 40
Figure 10. Head bar installation surgery. ... 42
Figure 11. Hemodynamic response to whisker stimulation in the anesthetized and awake mouse. ... 47
Figure 12. Hemodynamic response to sensory stimulation in the awake behaving mouse. ... 47
Figure 13. Hemodynamic response to sensory stimulation in the anesthetized mouse. ... 48
Figure 14. Protocol summary for habituation and blood collection in the first experimental series. ... 49
Figure 15. Variations in corticosterone levels during habituation in the first experimental series. ... 50
Figure 16. Protocol summary for habituation in the second experimental series. ... 52
Figure 17. Differences in corticosterone levels between groups in the second experimental series. ... 53
Figure 18. Protocol summary for habituation in the third experimental series. ... 54
Figure 19. Differences in corticosterone levels between groups in the third experimental series. ... 55
Figure 20. Differences in corticosterone levels between different experimental conditions. .... 57
List of Tables
Table 1. Comparison between different optical imaging techniques commonly used for evaluating NVC in rodents. ... 18 Table 2. List of the parts used for building the head-restrained device. ... 40 Table 3. List of protocols designed to habituate mice to head-restraint in preparation for optical imaging. ... 63 Table 4. Variations in corticosterone levels induced by different types of manipulations. ... 67
Abbreviations
20-HETE 20-hydroxyeicosatetraenoic acid
2D-OIS 2-dimensional optical imaging stereoscopy
AA arachidonic acid
ATP adenosine triphosphate
BKCa large conductance calcium-activated potassium channel
BP blood pressure
BOLD blood-oxygen-level dependent
CA cerebral autoregulation
CBF cerebral blood flow
CBV cerebral blood volume
CMR cerebral metabolic rate
CMRglc cerebral metabolic rate of glucose utilization CMRO2 cerebral metabolic rate of oxygen utilization
COX-2 cyclo-oxygenase-2
EC endothelial cell
EEG electroencephalogram EET epoxyeicosatrienoic acid
ELISA enzyme-linked immunosorbent assay
FMRI functional magnetic resonance imaging
eNOS endothelial nitric oxide synthase
IP3R2 inositol 1,4,5,-triphosphate receptor 2 LDF laser Doppler flowmetry
LSCI laser speckle contrast imaging
MAC minimum alveolar concentration levels MAP mean arterial pressure
MRI magnetic resonance imaging
NIRS near infrared imaging spectroscopy
NMDAR N-methyl-d-aspartate receptor
nNOS neuronal nitric oxide synthase
NO nitric oxide
NVC neurovascular coupling
OFC open field chamber
OIIS optical imaging of intrinsic signals PET positron emission tomography
PGI2 prostacyclin
PGE2 prostaglandin E2
PLA2 phospholipase A2
PLD2 phospholipase D2
SPECT single emission computed tomography
SR101 sulforhodamine-101
TPLSM two-photon laser scanning microscopy
Acknowledgments
I would like to extend my deepest gratitude to my supervisor Dr. Hélène Girouard, for her continuous support, guidance and kindness, which have forever shaped my personal and professional development. Thank you for always being there and believing in me, for all the opportunities and enriching experiences that you’ve granted me, and for the invaluable knowledge that I’ve been able to acquire in your lab. It’s been a true honor to be your student. I have grown so much during these past two years, and I can only hope to make a similar impact on another person’s life, someday along the line.
I’d like to also express sincere thanks to Dr. René Cardinal for his continued support, and the members of my thesis committee, Dr. Éric Thorin and Dr. Christopher Rose, for sharing their critical insights. I also thank Dr. Lesage’s laboratory for an enriching collaboration, and for their contribution with the head-restraint device and the open field chamber.
This dissertation would also have not been possible without the help and support of Diane Vallerand, who was present through every step of this process, and was always extremely kind, supportive, and definitely a real pleasure to work with!
Thanks to my dear friends and colleagues – Sherri, Gervais and Xuewei – with whom I’ve shared countless laughs and precious moments, right from the start. You guys are the best.
Thanks to all members of the Cerebrovascular lab – Lin, Sonia, Stéfane, Nasr, Maryam, Florencia and Adrián – you’re my second family, and I am grateful to have shared this part of my life with you.
Very special thanks to my family for their support and for always believing in me, and to all of my friends for being there every step of the way.
Last, but certainly not least, I’d like to thank my fiancé, Anas Wattar. Thank you very much for your continued love and support throughout this process… I can’t wait to walk down that isle with you.
Introduction
Overview
We first provide a general description of the major arteries that supply blood to the brain, and how they divide into progressively smaller vessels which penetrate deep into the parenchyma (Section 1). As we will see, blood flow through cerebral vessels is strictly modulated by a dynamic and complex interplay between different regulatory mechanisms including cerebral autoregulation and neurovascular coupling, which act to ensure constant supply of energy to neural tissue (Section 2).
Whilst much of the research on the regulation of cerebral blood flow (CBF) has been achieved in vivo using anesthetized animals, anesthetics have been demonstrated to exert significant effects on the CBF. We discuss how different types of anesthetics alter cerebral hemodynamics and metabolism, as well as neural dynamics, brain physiology and bodily homeostasis (Section 3). We then introduce several imaging modalities which are commonly used to investigate neurovascular coupling, and have been used in awake behaving studies in order to avoid the effects of anesthesia on CBF (Section 4).
Because imaging in the awake, restrained animal is often associated with increased stress levels, it is important to understand the effects of stress on CBF. In our last section, we discuss the effects of different types of anesthetics on cerebral hemodynamics, resting brain metabolism, neuronal and glial dynamics, cerebral physiology and bodily homeostasis, and how these effects in turn can modulate the neurovascular response to sensory stimulation in rodents (Section 5).
1. Anatomy and Ultrastructure of the Cerebral Vasculature
1.1 Major Arteries of the Brain
While the brain only constitutes 2% of the human’s bodyweight, it exhibits remarkable metabolic activity, consuming a colossal one fifth of the body’s total energetic expenditure. As such, it is no surprise that the brain is a highly vascularized organ. In fact, with every passing minute, the heart supplies the central nervous system (CNS) with 0.75 liters of warm blood, gushing from the left ventricle into the aortic arch and through two sets of large arterial branches: the left and right common carotid arteries, and the left and right subclavian arteries (Figure 1), which serve the anterior and posterior aspects of the brain, respectively [5].
Figure 1. Arterial blood supply: from the aortic arch to the brain.
The brain is perfused by two sets of large arteries: the internal carotids (anterior system) and the vertebral arteries (posterior system). The latter merge into the basilar artery and join at the base of the brain with the internal carotids and communicating arteries, forming the circle of Willis (figure adapted from [6]and[7]).
Anteriorly, the common carotid arteries give rise to bilateral external and internal carotids. The internal carotid arteries supply the anterior part of the cerebrum, providing the vast majority of the cerebral blood flow (CBF) (80%). These run upward the neck and enter the skull through the carotid canal. They then pierce into the dura mater and enter the subarachnoid space, where they bifurcate into their terminal branches, the anterior cerebral arteries and middle cerebral arteries. Posterior to the carotid arteries, the subclavian system branches out into the left and right vertebral arteries, which supply 20% of the CBF. These arteries penetrate the cranium through the foramen magnum, and merge medially into the single basilar artery, which terminates by splitting into the bilateral posterior cerebral arteries (Figure 1).
The anterior, middle and posterior cerebral arteries fuse together through anterior and posterior communicating arteries into an anastomotic ring located at the base of the brain, known as the Circle of Willis (Figure 1). This arterial ring allows for blood reaching one hemisphere to circulate around the ring and perfuse the opposite side of the brain [8], thus enabling continued cerebral perfusion in the event of occlusion or stenosis of the internal carotid or vertebral arteries [9].
1.2 Intracerebral Vessels
1.2.1 Architecture of the Cerebrovascular Tree
As they leave the circle of Willis, the large intracranial arteries run along the surface of the brain, and branch out into pial arteries and progressively smaller arterioles and capillaries (Figure 2).
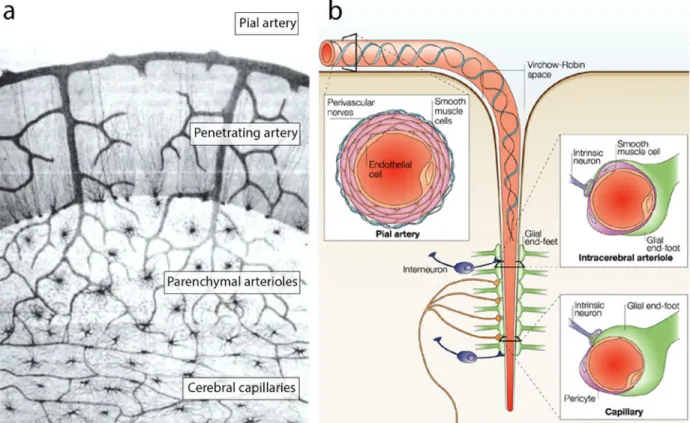
Figure 2. Moving down the cerebral vasculature.
a) Illustration by Camillio Golgi (1843-1926) detailing branches of the vascular tree, from the cortical surface down to the microvascular bed. b) Pial arteries penetrate into the Virchow-Robin space and come in direct contact with the astrocytic endfeet as they dive deeper into the brain tissue (figure adapted from [10] and[1]).
Pial arteries are large vessels (200-1000 µm diameter in humans) which lie atop of the pia mater (innermost layer of the cerebral meninges), and consist of an innermost layer of endothelial cells (ECs), vascular smooth muscle cells (VSMCs) [5], and an outer layer termed adventitia [11]. These arteries dive into tissue at a right angle to the brain surface and give rise to penetrating arteries (40-200µm), which reach an extension of the subarachnoid space termed Virchow-Robin. As the penetrating arteries reach further into the tissue, this space disappears, and the parenchymal arterioles become closely associated with astrocytic endfeet. At the bottom of the cerebrovascular tree, capillaries (7-9 µm) form a dense network consisting of a continuous layer of ECs, surrounded by pericytes and a basal membrane on which astrocytic processes are apposed [11].
1.2.3 Perivascular Innervation
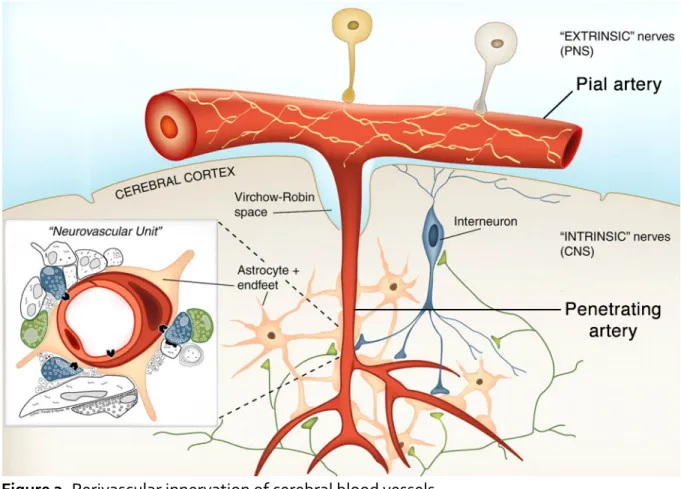
Throughout the cerebral vasculature, nerve fibers are intimately associated with the vessel wall components (Figure 3). Pial arteries at the surface of the brain are supplied by extrinsic nerve fibers from the autonomous nervous system [12, 13]. As they dive into the brain tissue, penetrating arteries lose their peripheral nerve supply and, once they move past the Virchow-Robin space, receive intrinsic innervation from within the neuropil. These neurons may signal through the astrocytes which surround the parenchymal vessels, causing the latter to vasodilate in response to neuronal activity. This association between neuronal needs and CBF is termed neurovascular coupling (NVC) [14] and will be addressed in Section 2.3.
Figure 3. Perivascular innervation of cerebral blood vessels.
2. Regulation of Cerebral Blood Flow
Whilst the brain is one of the body’s most metabolically active organs (see Section 1.1), neurons store little energy as glycogen and relies almost entirely on circulating glucose as a source of fuel. As a result, even minor decreases in blood supply can disrupt brain function and yield irreversible damage to the cellular structures within minutes [15]. Conversely, pathological increases in CBF can cause cerebral edema, which would increase intracranial pressure and lead to severe neurologic complications and death [15]. It follows that strict control of CBF is absolutely critical, in order to ensure a constant and adequate supply of glucose and oxygen to the neural tissue, whilst preserving normal ranges of cerebral blood volume (CBV) and intracranial pressure. Hence, the brain is endowed with two regulatory mechanisms of CBF – cerebral autoregulation (CA) and neurovascular coupling (NVC) – which will be discussed below.
2.1 Cerebral Autoregulation
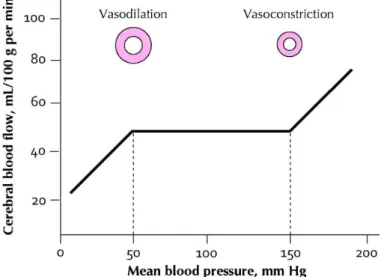
CA is the process by which CBF is maintained constant despite fluctuations in perfusion pressure [16]. In normotensive adults, cerebral perfusion is maintained at ~50 mL per 100g of brain tissue per minute, when mean arterial pressure (MAP) is within the range of 50 – 150 mmHg [17]. Above and below this range, the protective autoregulatory response is lost and the relationship between CBF and MAP becomes linear [18, 19] (Figure 4).
CA is proposed to be mediated by myogenic and neurogenic mechanisms. The myogenic response refers to the intrinsic ability of VSMCs to counteract normal fluctuations in blood pressure (BP) which occur during everyday activities such as sleep, changes in posture and exercise [20]. This is achieved through the constriction and dilation of large cerebral arteries and arterioles in response to increases and decreases in intraluminal pressure, respectively [18, 21]
(Figure 4). Since the myogenic response is maintained in vessels denuded of endothelium [22] and in sympathetically and parasympathetically denervated animals (cats) [23], this mechanism is considered inherent to VSMCs and independent of neural and hormonal factors [24].
Figure 4. Autoregulation of blood flow with changing blood pressure.
Cerebral perfusion is maintained at a constant value of 50 mL per 100g of brain tissue per minute via CA, provided mean arterial pressure is within the autoregulatory range of 50 – 150 mmHg. Above and below the autoregulatory range, CA is lost and CBF passively follows the perfusion pressure (figure adapted from [25]).
Neurogenic control is thought to intervene during challenging during challenging circumstances, when the myogenic mechanism of CA has been overwhelmed. Indeed, the large extracranial arteries and pial arteries are extensively innervated by both the sympathetic and parasympathetic branches of the autonomous nervous system [26] (see Section 1.2.3), which have been shown to alter the limits of the autoregulatory response [23, 27]. It has been proposed that during acute hypertensive states, the sympathetic branch is activated and increases vascular tone [28], thereby protecting the microvasculature against damage and rupture. However, if the arterial pressure exceeds 200 mmHg, the cerebral vessels are no longer able to constrict, and the CBF follows changes in perfusion pressure passively [29].
2.2 Neurovascular coupling
Whilst the aforementioned mechanisms of CA are aimed at keeping the CBF within a predetermined autoregulatory range, NVC provides a dynamic modulation of local blood flow, whereby neuronal activity induces a regional increase in CBF in order to match local energetic demands [30, 31]. This mechanism is mediated through various metabolic pathways which involve neurons, astrocytes and pericytes.
2.2.1 Neuronal Signaling
Neurons are proposed to constitute the driving force behind NVC, due to their elevated energy consumption during neurotransmission [32], in addition to the important role of glutamatergic transmission [33, 34] and receptor activation [35, 36] in eliciting a rapid increase in CBF.
In fact, the release of glutamate during neuronal activity has been found to activate N-methyl-d-aspartate receptors (NMDARs), leading to Ca2+ influx into neurons and the synthesis of nitric oxide (NO) by neuronal nitric oxide synthase (nNOS), which elicits dilation of the VSMCs [37, 38] (Figure 5). Indeed, NO induces vasodilation both in brain slices and in vivo, and inhibition of NO synthesis in the cortex has been shown to attenuate the CBF increases that follow neuronal activity [39], thus confirming its role in NVC.
2.2.2 Astrocytic Signaling
It is no surprise that astrocytes are also implicated in NVC, as they are ideally positioned to transduce neuronal signals into a vascular response. Indeed, astrocytic endfeet cover about 99% of the abluminal surface of blood vessels [40], and a single astrocyte can contact up to 140,000 synapses [41].
Accordingly, ATP released during neuronal activity was shown to stimulate astrocytic P2X1 receptors, leading to an increase in astrocytic Ca2+ and the activation of phospholipase D2 (PLD2). This results in the synthesis of vasoactive arachidonic acid (AA) derivatives and subsequent vasodilation (Figure 5).
In addition to activating PLD2, elevations in astrocytic Ca2+ can also induce vasodilation through the opening of BKCa channels [42], which results in K+ efflux into perivascular space [43, 44]. The subsequent increase in extracellular K+ activates inwardly rectifying K+ channels and induces vasodilation [45-51] (Figure 5).
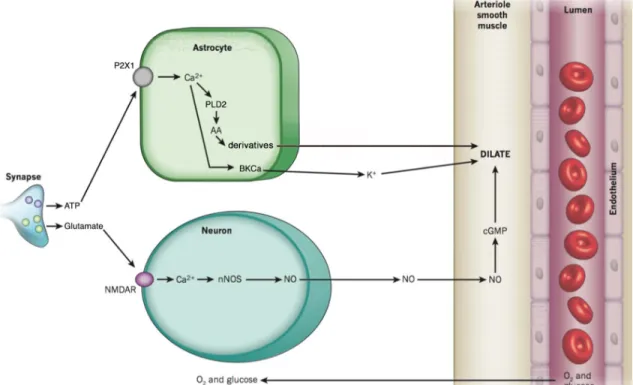
Figure 5. Major pathways of neuron and astrocyte-mediated neurovascular coupling.
Neural activity may induce an increase in CBF through the release of (1) glutamate, which acts on neuronal NMDAR to elicit synthesis of vasodilatory NO, and (2) ATP, which activates astrocytic P2X1 receptors to induce production of vasoactive AA derivatives, and the release of K+ which has strong dilatory effects on the vasculature. These interactions between neurons, astrocytes and vascular cells effect changes in cerebral blood flow, in a bid to match the delivery of glucose and oxygen with the local energetic needs. AA, arachidonic acid; BKCa, large conductance Ca2+-activated K+ channel; cGMP, cyclic guanosine monophosphate; NMDAR, N-methyl-D-aspartate receptor; nNOS, neuronal nitric oxide synthase; NO, nitric oxide; PLD2, phospholipase D2; (figure adapted from [52]).
2.2.3 Role of Pericytes
Pericytes, a type of vascular mural cells which wrap around cerebral capillaries [53], possess contractile properties similar to VSMCs [54], and thus may contribute to NVC by modulating capillary diameter. Indeed, several in vitro experiments have subsequently shown pericytes to respond to vasoactive substances such as AA derivatives, and to induce localized vasoconstrictions [55]. Since on average, neurons are anatomically closer to capillaries (8-23 µm) than to arterioles (70–160 μm), these properties of capillary vessels would allow the vascular network to respond to changes in metabolic demands at a more local level [56]. Subsequently, pericytes could propagate the vascular response to upstream arterioles through gap junctions between the pericytes themselves or between pericytes and the underlying endothelium [55].
It is possible that the signaling pathways which govern the dilation and constriction of pericytes are similar to those established for VSMCs, and implicate Ca2+-dependent synthesis and release of vasoactive AA derivatives from astrocytes (Figure 10). However, these dynamics remain to be explored.
3. Effect of Anesthetics on Cerebral Blood Flow
Thus far, most studies on CBF regulation and NVC have been conducted in vivo under anesthesia. Indeed, anesthetics have been widely used during image acquisition, in order to minimize motion artifacts and prevent the induction of stress in the animals (see Section 5). Further, anesthetic preparations have the advantage of enabling the rigorous monitoring of physiological parameters, such as blood gases (pO2 and pCO2), pH and pressure. This is usually
achieved in acute studies with rodents through invasive procedures such as the cannulation of the femoral artery, which allows to continuously monitor the BP through an attached pressure transducer, and artificial ventilation, which is an effective method for maintaining blood gas levels within the physiological range [57].
In spite of the significant role anesthetics have played in neurovascular research, studies increasingly show that anesthesia produces a neurological condition that is distinct from any physiological state, leading to broad physiological changes and importantly, significant alterations in the hemodynamics response. This is particularly apparent in mice, which display poor reproducibility and inconsistent NVC in comparison with rats and other species [58-64]. In this section, we discuss the effects of different types of anesthetics on cerebrovascular dynamics, resting brain metabolism, neuronal and glial dynamics, and how these effects in turn can modulate the neurovascular response to sensory stimulation in rodents.
3.1 Cerebral Hemodynamics
Studies have found anesthesia to affect the neural-vascular relationship in rodents in a number of ways. First, the amplitude of the hemodynamic response was found to be approximately four times smaller in rodents anesthetized with urethane (1 – 1.25 g/kg) compared with
unanesthetized rodents, both subsequent to visual [62] and sensory stimulation [65]. Similar findings were obtained with α-chloralose (60 mg/kg) and propofol (0.8 mg/kg/min), whereby the size of the activation area in the brain and the BOLD response were significantly reduced following limb stimulation [66, 67].
Second, the spatial dynamics of the neural-vascular response have been shown to differ markedly between different anesthetic conditions. For instance, cortical mapping with intrinsic imaging created focal localization under pentothal, whereas anesthesia with isoflurane produced broader and more heterogeneous activation maps in the monkey somatosensory cortex [68].
Last, anesthetics also interfere with the temporal dynamics of the response, with responses in anesthetized animals increasing more slowly, peaking later, and taking more time to return to baseline compared with awake animals [69]. Indeed, the BOLD responses subsequent to hindpaw stimulation in mice had markedly different shapes under distinct anesthetic regimes (isoflurane, medetomidine, propofol and urethane) [70].
Hence, anesthesia exerts considerable influence on cerebral hemodynamics, affecting the size, spatial coordination and temporal profile of the hemodynamic response, with different effects depending on the type and dosage of anesthetic used.
3.2 Brain Resting Metabolism
It is well known that the brain exhibits a particularly high metabolic demand (see Section 2). However, nearly all anesthetics have been shown to drastically reduce the basal cerebral metabolic rate (CMR) in a dose-dependent manner. CMR is usually assessed in terms of variations in glucose utilization (CMRglc), measured using 2-deoxyglucose in animals [71].
In particular, general anesthetics such as isoflurane and halothane have been demonstrated to decrease CMRglc through inhibitory actions on mitochondrial ATP synthesis in rats [72] and mice [73]. Effectively, isoflurane was shown to reduce CMRglc in rats by 11%, 70%, 74% and 81% compared with the awake state, at the respective isoflurane minimal alveolar concentration (MAC) levels 0.5, 1.0, 1.5 and 2.0 [74, 75]. Further, α-chloralose (60 mg/kg) [76-78], pentobarbital (10 or 30 mg/kg) [79, 80] and phenobarbital (150 mg/kg) [81] were found to attenuate CMRglc by ~40-55% relative to the awake condition, especially in regions which exhibit high metabolic activity such as the cortex.
Anesthesia-induced changes in CMR have been shown to affect normal cerebral oxygenation. Indeed, researchers have found substantial variability in the tissue oxygenation under anesthesia [82], which hinders comparisons between the awake and anesthetized conditions. Furthermore, using a recently developed two-photon phosphorescent probe which provides micron-scale measurements of cerebral oxygenation, Lyons and colleagues showed oxygen tension to be greatly enhanced under 2% isoflurane [83]. Effectively, since most general anesthetics suppress CMR in a dose-dependent manner, it is expected that anesthetics will decrease the cerebral utilization rate of oxygen, thus leading to a rise in the oxygenation of brain tissue [84].
3.3 Neuronal, Glial and Vascular cells
Since most anesthetics drastically attenuate cerebral metabolism, it is only to be expected that they would also dampen neuronal activity. In fact, anesthesia has been shown to exert strong inhibitory effects over baseline firing in neurons [85-88]. Specifically, anesthesia causes neurons to hyperpolarize by increasing inhibition and decreasing excitation [89, 90]. Indeed, whilst
synaptic inhibition in awake animals is similar to excitation in amplitude, in the anesthetized state, inhibition was shown to be much stronger than excitation [91-93]. The increase in synaptic inhibition observed under anesthesia is thought to be mediated through common pathways which involve the potentiation of GABA and glycine-mediated inhibitory transmission, and the suppression of glutamatergic excitatory transmission [94].
As a result, anesthetized animals exhibit oscillations (1 Hz) between a depolarized up-state, which resembles the sustained depolarization in awake animals, and a hyperpolarized down-state, during which synaptic activity is completely suppressed for a brief duration (~0.1 second). These changes in neuronal firing patterns are reflected in EEG recordings by a shift from high-frequency, low-amplitude EEG activity, to low-frequency, high amplitude patterns resembling NREM sleep [95, 96]. Accordingly, mice anesthetized with isoflurane (1.0-1.5%), ketamine-xylazine (120 mg/kg and 10 mg/kg) or urethane (1250 mg/kg) exhibited significantly altered electrocorticographic activity, with slower-frequency spiking compared with awake mice [97]. Similarly, anesthetizing rats with halothane (0.7-1.5%) lead to a dose-dependent increase in delta waves, indicative of a depressed basal neuronal activity [87, 88]. Nevertheless, the effect of anesthetics on neuronal activity is not uniform across the brain. Rather, anesthesia was shown to influence spontaneous cortical activity in a region- and depth-dependent manner. Indeed, both isoflurane (1.5%) and ketamine (30 mg/kg and 1-2 mg/kg) exert a greater and more uniform modulation of frontal areas, in comparison with a preferential modulation of layer IV of the cortex in sensory brain regions [96, 98, 99].
In addition to dampening neuronal activity, anesthetics also greatly reduce the Ca2+ signaling frequency in astrocytes [97, 100]. This is a critical issue, since astrocytes play an
essential role in supporting neuronal function (e.g. by supplying them with nutrients) and mediating the neurovascular response to sensory stimulation (see Section 2.2.2). Indeed, anesthetizing mice with isoflurane (1.0-1.5%), ketamine-xylazine (120 mg/kg and 10 mg/kg) or urethane (1250 mg/kg) reduces Ca2+-transient frequency by a factor of 10, bringing it down from 2.33 in the awake state to 0.24-0.39 mmHz per cell under anesthesia. Nevertheless, how anesthesia alters the role of astrocytes in NVC needs to be further explored.
Last, some anesthetics have been shown to exert direct effects on vascular cells in the brain. Indeed, most volatile anesthetics (isoflurane, desflurane and halothane) are known to have potent vasodilatory properties, in spite of their depressive effect on cerebral metabolism. Accordingly, anesthesia with isoflurane (0.5 – 1.5 MAC) was found to induce a dose-dependent relaxation of canine cerebral arteries [101, 102] through the activation of ATP-sensitive K+ channels [103] and a decrease in Ca2+ signals by blocking Ca2+ channels in VSMCs [104-106]. Similarly, halothane is thought to promote vasodilation by depleting sarcoplasmic Ca2+ stores in VSMCs [107, 108] and triggering the release of relaxing factors from ECs [109]. Hence, a known disadvantage of using volatile anesthetics is that they increase CBF whilst decreasing cerebral metabolism, leading to altered dynamics between neuronal activity and vascular responses [110].
To conclude, anesthetics have been widely used to investigate the hemodynamic in animal models in vivo, leading to significant improvements in our understanding of the pathways which underlie NVC in physiological and pathological conditions [52]. That said, anesthetics exert considerable influence on cerebral metabolism, neuronal and glial dynamics, thereby altering neural-vascular dynamics and affecting the reproducibility of the hemodynamic
response (see Section 3.1). Hence, caution is required when comparing data from different studies or generalizing experimental results from the anesthetized animal to the awake human. Fortunately, recent technical advancements have facilitated the use of optical imaging modalities in the awake, unrestrained animal, thus enabling researchers to investigate critical aspects of CBF regulation and NVC under more appropriate conditions.
4. Optical Imaging Techniques for Evaluating the Hemodynamic
Response in Awake Behaving Rodents
As previously discussed, the regulation of CBF involves a dynamic and complex interplay between different mechanisms, which act to ensure constant perfusion of the brain parenchyma and an adequate supply of oxygen and nutrients to active neurons. Investigation of these mechanisms has been made possible owing to optical imaging techniques, which provide powerful tools for monitoring regional hyperemic changes in both small animals and humans [111-113]. Specifically, Laser Doppler flowmetry (LDF) is the most commonly used optical imaging technique for monitoring CBF, and hence will be described in depth in the sections below. We also provide a brief review of several other optical techniques that are commonly used for intraoperative imaging of CBF and the neurovascular response in awake behaving rodents, including laser speckle contrast imaging (LSCI), optical imaging of intrinsic signals (OIIS), two-dimensional optical imaging spectroscopy (2DOIS) and two-photon laser scanning microscopy (TPLSM) (see Table 1 for a comparison between these modalities). Last, we discuss how these technologies can be combined with other imaging modalities and optogenetic techniques to yield complex information on the cerebrovascular response.
Table 1. Comparison between different optical imaging techniques commonly used for evaluating NVC in rodents.
Technique & Principle Spatial Resolution
Temporal
Resolution Penetration Depth Advantages Limitations
Laser Doppler Flowmetry (LDF)
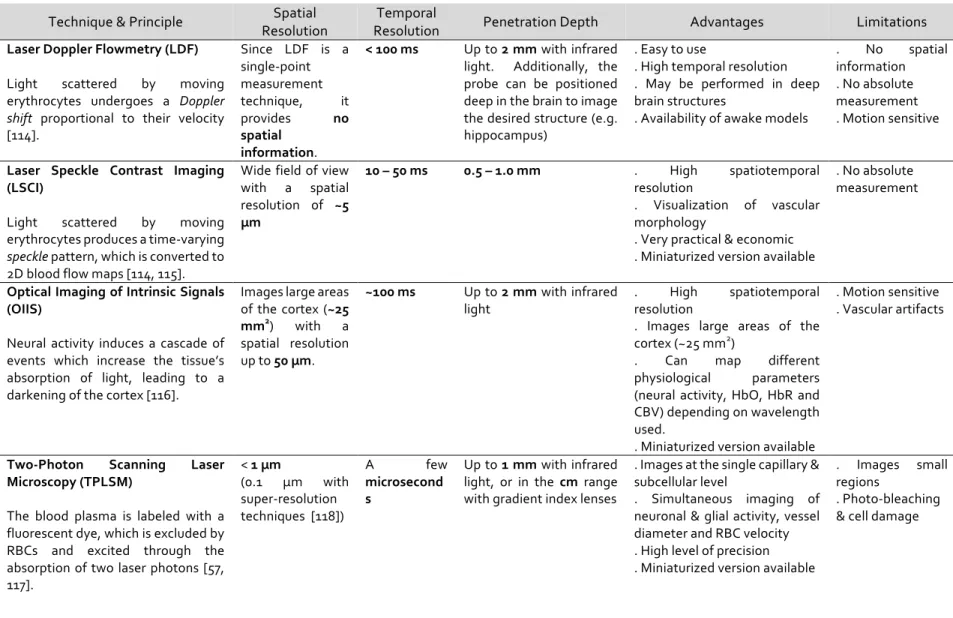
Light scattered by moving erythrocytes undergoes a Doppler
shift proportional to their velocity
[114]. Since LDF is a single-point measurement technique, it provides no spatial information. < 100 ms Up to 2 mm with infrared light. Additionally, the probe can be positioned deep in the brain to image the desired structure (e.g. hippocampus)
. Easy to use
. High temporal resolution . May be performed in deep brain structures
. Availability of awake models
. No spatial information . No absolute measurement . Motion sensitive
Laser Speckle Contrast Imaging (LSCI)
Light scattered by moving erythrocytes produces a time-varying
speckle pattern, which is converted to
2D blood flow maps [114, 115].
Wide field of view with a spatial resolution of ~5 µm 10 – 50 ms 0.5 – 1.0 mm . High spatiotemporal resolution . Visualization of vascular morphology
. Very practical & economic . Miniaturized version available
. No absolute measurement
Optical Imaging of Intrinsic Signals (OIIS)
Neural activity induces a cascade of events which increase the tissue’s absorption of light, leading to a darkening of the cortex [116].
Images large areas of the cortex (~25 mm2) with a spatial resolution up to 50 µm. ~100 ms Up to 2 mm with infrared light . High spatiotemporal resolution
. Images large areas of the cortex (~25 mm2)
. Can map different
physiological parameters (neural activity, HbO, HbR and CBV) depending on wavelength used.
. Miniaturized version available
. Motion sensitive . Vascular artifacts
Two-Photon Scanning Laser Microscopy (TPLSM)
The blood plasma is labeled with a fluorescent dye, which is excluded by RBCs and excited through the absorption of two laser photons [57, 117]. < 1 µm (0.1 µm with super-resolution techniques [118]) A few microsecond s Up to 1 mm with infrared light, or in the cm range with gradient index lenses
. Images at the single capillary & subcellular level
. Simultaneous imaging of neuronal & glial activity, vessel diameter and RBC velocity . High level of precision . Miniaturized version available
. Images small regions
. Photo-bleaching & cell damage
4.1 Laser Doppler Flowmetry (LDF)
Laser Doppler flowmetry (LDF) is an optical imaging technique which provides continuous, real-time evaluation of blood flow in cerebral vessels [119-122]. This technique is based on the Doppler shift, which describes the change in the frequency of a wave, subsequent to relative movement between the source of the wave and the observer. This technique is routinely used in clinical [123-126] and experimental applications [127-133] involving CBF measurement.
4.1.1 Theoretical Background
A common example of Doppler shift phenomenon is the variation in the pitch of a siren noise from an emergency vehicle as it passes by; the received frequency of the sound waves is highest during the vehicle’s approach, and lowest whilst the vehicle is moving away. This is because as the vehicle is approaching, each successive sound wave is emitted in greater proximity to the observer than the previous wave. Thus, the time needed for the successive waves to reach the observer is progressively reduced, causing the sound waves to combine and resulting in a greater sound frequency. Conversely, when the vehicle is receding, the successive waves take longer to reach the observer, which causes the waves to spread out and leads to a reduced frequency.
Because this change in frequency is contingent on the relative velocity of the source of the wave and the observer, the Doppler shift can be used to measure velocities. This relationship between the original frequency (f), the shifted frequency (f’), the relative velocity of the source and the observer (v) and the wave’s velocity (c) can be summarized in the equation below [114]:
This mechanism of wave propagation also applies to light; in fact, the optical Doppler shift constitutes the underlying principle of several imaging methods including ultrasound Doppler [134] and LDF [135]. In the latter technique, a small fiber-optic laser probe (diameter 0.5 – 1 mm) is placed over the cerebral cortex at the desired position for CBF measurement. This probe emits a beam of monochromatic laser light with a wavelength ranging between 670 and 810 nm, which is above the absorbance spectrum of erythrocytes and below that of water. This light is transmitted to the target tissue, and is absorbed and reflected by static and dynamic cells. Specifically, when the emitted light is absorbed by erythrocytes coursing through the cerebral blood vessels, the light’s wavelength due to the movement of these cells, resulting in a Doppler frequency shift (Figure 6) [114, 136, 137]. The magnitude of this shift is commensurate with the number and velocity of the moving cells. Hence, when the backscattered photons are received by the photodetector, the obtained signal is processed and the blood flow velocity can be deduced following Bonner and Nossal’s algorithm [137]. Due to the diffuse scattering of light within tissue, the LDF signal is independent of the flow’s direction. In fact, LDF is used to evaluate relative variations in CBF with the presumption that flow geometry does not change [131].
Figure 6. Principle of Laser Doppler Flowmetry.
This optical imaging technique measures CBF based on the Doppler frequency shift (blue) of backscattered light imparted by moving erythrocytes in cerebral vessels.
4.1.2 Technical Specifications
Flow imaging with Laser Doppler provides precise, real-time quantitative measurements of regional CBF and is distinguished by its superior temporal resolution (milliseconds), allowing to track rapid variations in flow. This feature is especially important for studying fast vascular responses to functional activation, e.g. subsequent to whisker or forepaw stimulation in rodents. However, because LDF is a single-point measurement technique, it offers little to no spatial information [138-140], and the measurements are restricted to a small sampling volume of 1 mm3 which may not reflect the spatial heterogeneity of the cerebral microvasculature (e.g. capillaries vs. venules) adequately [141-143]. Whilst additional spatial resolution can be achieved with a scanning version of LDF [144], this is performed at the cost of a severely impaired temporal resolution (several seconds) due to time-consuming scanning, and thus is not recommended for the study of stimulation-induced changes in flow [145, 146].
tissue properties such as the vessels’ structure and density, which alter the path length traveled by the photons irrespective of blood flow velocity. Hence, it is recommended when measuring cortical CBF that the fiber-optic probe be placed away from large superficial vessels, which would otherwise drastically reduce the attained depth [137, 147-149]. For imaging deep brain structures such as the hippocampus, a small corticostomy (~1.5 mm diameter) is performed so that the probe can be positioned at the desired location [150]. Penetration depth is also highly dependent on the wavelength of the emitted light, with infrared light penetrating deeper (several mm) than the blue and green light (0.15mm), and increases with the separation distance between the emitting and receiving fibers of the probe. Specifically, for near-infrared light (780 nm), penetration depth reaches approximately 0.5, 1 and 2 mm for separation distances of 0.125, 0.25 and 0.5 mm [151].
Compared with other imaging techniques, LDF is relatively easy to use, and the nature of the signal is well understood. In fact, the LDF signal clearly originates from the variations in flow velocity within the tissue being imaged. However, because the sensitivity of the probe to CBF is influenced by the distance between the tip of the probe and a particular vessel, the signal cannot be quantified in absolute units of CBF (e.g. mL/100g/min); rather, it is expressed as variations relative to a baseline value obtained under control conditions. Consequently, in order to be able to compare results from different experiments, the fiber-optic probe must be calibrated with specific motility standards, or an absolute measure of flux must be obtained through another method (e.g. quantitative autoradiography) [120, 152].
Moreover, one of the inherent limitations of this technique is its marked sensitivity to motion artifacts [120, 153]. This can result either from motion of the imaged tissue, or
movement of the fibers of the LDF probe. Fiber movement can be prevented by using an integrated probe which includes both the light emitting and receiving fibers [154-156]. Additional care should be taken during signal acquisition by placing the LDF setup away from vibrating instruments such as perfusion pumps, and by positioning the probe using a micromanipulator.
4.1.3 Applications in Awake Behaving studies
Since anesthesia greatly influences the animal’s physiology, including cerebral autoregulation and the neurovascular response (see Section 3), many LDF systems have been proposed for imaging in the awake animal [69, 121, 132, 140, 157, 158]. In 1994, Sato’s group recorded the regional CBF in conscious rats in response to inhalation of 7% Co2, by chronically attaching a LDF probe to the cortex and restraining the rat in a cloth hammock [157]. More recently, Takuwa and colleagues established a system for measuring CBF in conscious, freely moving mice, to enable the chronic investigation of CBF in a relatively natural environment [140]. In subsequent studies, the authors used this system to investigate the hemodynamic response in the awake, freely moving mouse during sensory stimulation [132] and neural deactivation [133]. Further, Tajima and colleague confirmed the reproducibility of CBF measurements in longitudinal studies using awake mice, using LDF at baseline, 1 hour later, and 7 days following the baseline measurement. In this study, the authors also improved the LDF system by stabilizing the fiber-optic probe on the cortex with a polyvinyl chloride tube, which is crucial for obtaining accurate measurements over extended recording sessions [158].
4.2 Laser Speckle Contrast Imaging (LSCI)
imaging (LSCI), whereby a coherent laser light is projected onto an area of the skull or cerebral cortex. As the emitted light is scattered from different parts within the illuminated surface, it travels across distinct path lengths before being perceived by a photodetector (Figure 7). This variation in path lengths yields a constructive and destructive interference that changes with the positioning of the scattering particles, resulting in a randomly changing intensity pattern referred to as “speckle” [159]. In the brain, the movement of erythrocytes within blood vessels produces a time-varying speckle at each pixel in the image. Spatial variations in the speckle pattern can be plotted to produce two-dimensional maps of CBF, which show changes in flow velocity over time (Figure 7) [160].
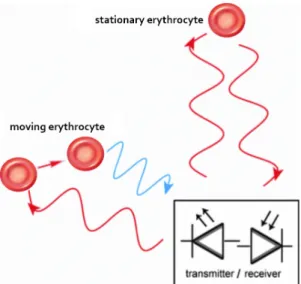
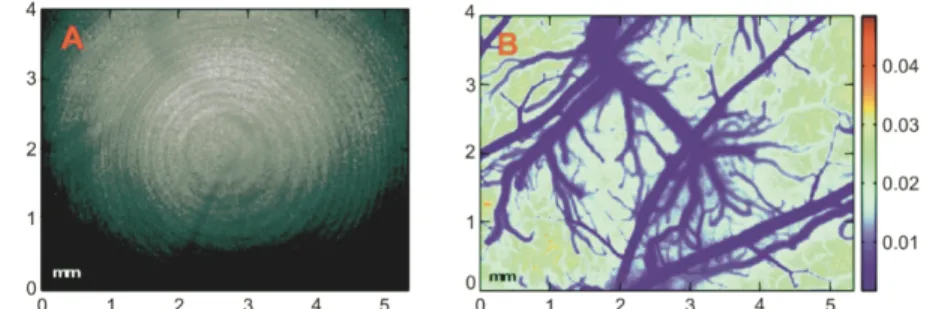
Figure 7. High resolution image of rat brain vasculature using laser speckle contrast.
Example of (a) a raw speckle image from the barrel cortex of a rat, and (b) its derived flow index map (figure reproduced from [115]).
Similarly to LDF, LSCI can be used to monitor CBF and functional activation in animal models with high temporal resolution (milliseconds). However, whilst the information obtained with LDF is spatially constrained, LSCI offers wide-field two-dimensional mapping of cortical CBF with excellent spatial resolution (~ 5-10 µm), allowing clear visualization of individual blood vessels [161, 162]. Similar high-resolution maps can be obtained using a laser Doppler scanner; however, this modality cannot compete with laser speckle on imaging speed. Indeed, a single Doppler scan requires several minutes to complete, whereas LSCI instruments enable full-field
imaging of CBF without requiring any scanning, and thus can be used to provide real-time images and even videos with some recent technologies. Nevertheless, parallel processing of the Doppler signals from each pixel, e.g. using on-chip processing, is being currently investigated by several groups as a means to enable the production of full-field images in real time [115, 163]. Once these techniques are fully developed and commercialized, laser Doppler scanners may become more popular than LSCI due to their inherently superior spatial resolution. However, the implementation of this approach would likely be very costly, and LSCI may still have room to compete by offering a relatively inexpensive and easy-to-use alternative [115].Moreover, whilst most of the current LSCI techniques require the use of anesthesia, several miniature LSCI imagers have been proposed to enable imaging of cortical CBF in the awake active rodent. These imagers are sufficiently small (~3 cm high) and lightweight (≤20 g) to be carried by the rat without hindering its movement, and offer similar spatiotemporal resolution compared with conventional LSCI systems [164, 165].
That said, LSCI shares many of the limitations described earlier for LDF (see Section 4.1.2). Indeed, due to the scattering nature of the cortical tissue, this technique also suffers from limited penetration depth and poor depth resolution, and thus can only be used to investigate vascular dynamics close to the cortical surface [166]. In addition, just like with LDF, the information obtained with LSCI cannot be expressed in absolute units. Moreover, LSCI does not permit rigorous quantification of CBF velocity, since the exact relation between the speckle contrast factor K and the flow velocity has yet to be determined [160]. Lastly, this technique is susceptible to artifacts which can be caused by variations in the parameters of the image acquisition system or in the optical characteristics of the imaging window. Hence, whilst LSCI is
a powerful tool for mapping CBF changes on the cortical surface, careful control of imaging parameters is warranted when comparing data from different imaging sessions [167].
4.3 Intrinsic Imaging
Intrinsic imaging techniques such as optical imaging of intrinsic signals (OIIS) and two-dimensional optical imaging spectroscopy (2D-OIS) are also frequently used to investigate cerebral hemodynamics [65, 168-181]. These approaches are based on the distinct optical absorption spectra of oxyhemoglobin (HbO) and deoxyhemoglobin (HbR) [31]. Because HbO is locally converted to HbR upon oxygen delivery to the neural tissues, the relative concentrations of HbO and HbR can be used to infer the blood’s oxygenation levels and metabolic activity [112]. Hence, when the cortex is illuminated with laser light, active areas can be differentiated from inactive regions of the cortex based on a change in their optical reflectance and absorption properties, commonly known as optical intrinsic signals.
Intrinsic imaging offers several technical advantages over other imaging modalities. Indeed, the spatial resolution of OIIS is very high relative to other experimental imaging techniques, making it ideally suited for the study of NVC at the level of arterioles, capillaries and veins. As such, this technique can determine patterns of cerebral hemodynamics over large areas of the cortex (~25 mm2) with a spatial resolution up to 50µm and high temporal resolution (~100 ms) [169, 175, 182-184]. As with LDF and LSCI (see Sections 4.1.3 & 4.2), the depth of optical maps is determined by the wavelength of the laser light that is used to illuminate the cortex, with visible light detecting change at a maximum depth of 1 mm [185] and near-infrared light reaching up to 2 cm below the pial surface [186, 187]. Further, since intrinsic imaging does not necessitate contact with the cortical surface or the use of potentially phototoxic dyes (as
with extrinsic imaging techniques), it is minimally invasive and thus has been applied to imaging studies in awake, freely moving monkeys [188], cats [189], rats [180, 190] and mice [191].
The real power of intrinsic imaging stems from its ability to measure changes in blood volume, oxygenation or light scatter, according to the chosen wavelength of laser light [176, 192, 193]. That said, a major problem with the intrinsic method is that the motion-induced noise and vascular artifacts associated with intrinsic signals are often of similar or larger magnitude than the signals themselves [194-196]. As such, it is critical to minimize motion by ensuring complete head stabilization of the imaged subject. Interestingly, the choice of wavelength has been shown to influence the presence of vascular artifacts, with orange light offering the best signal to noise ratio in the visual cortex [197], and green light in the auditory cortex [198].
4.4 Two-Photon Laser Scanning Microscopy (TPLSM)
The aforementioned imaging modalities (LDF, LSCI & IOS) have greatly enhanced our knowledge of cerebral hemodynamics, by allowing to image broad changes in blood flow, volume and oxygenation. TPLSM complements these techniques by enabling a systematic analysis of cerebral hemodynamics at the level of individual microvessels, in conjunction with simultaneous measurements of neuronal and glial activity. Moreover, the deep red and infrared light used with TPLSM can penetrate deep into the tissue, reaching up to 1 mm in depth, or in the cm range when using gradient index lenses directly into the cortex from a hole in the skull [199-201]. Since its invention, this modality has been used extensively to image cerebrovascular dynamics in in vitro [42, 202-206]and in vivo [207-213].
With TPLSM, a laser beam is focused through an objective lens and onto a micrometers-sized area within a specimen, in order to excite fluorescent molecules (fluophores) [214]. When
the excited fluophore reverts to its ground state, a photon is emitted and the emission light is captured by the objective, thus yielding an image of the fluorescent structures within the biological sample [215-217]. Two complementary parameters, vessel diameter and RBC velocity, are used to assess the hemodynamics of cerebral vessels. To measure these parameters in vivo, the plasma is labelled with an intravenous bolus of space-occupying high-contrast molecules, such as dextran-conjugated fluorescent dyes (e.g. fluorescein isothiocyanate) [218]. This enables the visualization of hemoglobins as dark shadows against a bright fluorescent background.
Notably, TPLSM can be used in conjunction with anatomical markers such as traditional dyes and functional markers, in order to enable real-time monitoring of specific structural dynamics (e.g. cellular morphology or protein localization). Moreover, the use of functional markers such as voltage-sensitive fluorescent dyes and fluorescent ion indicators, can provide simultaneous recordings of the activity of neurons, glias and VSMCs [204-206, 210, 219]. This is important since it can allow to determine the complimentary roles of these cells in initiating NVC under physiological conditions, and the mechanisms that lead to its dysfunction in different pathologies. Lastly, the recent development of miniaturized, head-mounted two-photon microscopes has opened the door to two-photon imaging in the awake, freely moving animal [220].
That said, whilst TPLSM provides superior spatial resolution, allowing to visualize individual microvessels and subcellular compartments, the imaging of vascular dynamics and cellular activity is limited to vessels and cells that are closely associated and lie in the same imaging plane. This is problematic since somatosensory-evoked NVC extends laterally across
the brain surface and deep into the cortex, and is associated with significant trial to trial variability [57, 221]. Nevertheless, this limitation has been recently overcome with the advent of volumetric imaging, which utilizes an elongated, V-shaped point spread function to visualize a three-dimensional brain volume [222].
4.5 Multimodal imaging and Optogenetics
All in all, optical imaging techniques utilize the optical properties of the imaged tissue such as reflectance, scattering and fluorescence, in order to produce image contrast. In section, we have described different optical imaging systems, including laser Doppler, laser speckle, intrinsic imaging and TPLSM, each of which has contributed significantly to our current understanding of the cerebral vasculature and the hemodynamic response. Since these techniques have been developed based on different concepts, they are distinguished in terms of spatial resolution, temporal resolution, depth penetration as well as the nature of the information they provide (Table 1). Hence, whilst LDF and LSCI provide excellent temporal resolution, intrinsic methods present greater versatility since they allow to track several vascular parameters (CBF, CBV and oxygenation). Further, all three aforementioned systems, along with macroscopic imaging techniques (e.g. fMRI, PET and NIRS) allow to visualize broad changes in cerebral hemodynamics, whereas TPLSM conveys microscopic information regarding single capillary flow and subcellular dynamics. Therefore, different imaging modalities can be combined in order to yield complimentary information about the cerebral vasculature, as has been done by many research groups [223-231]. For example, Ringuette and colleagues recently investigated the relationship between regional CBF, oxygen saturation and intracellular Ca2+ dynamics using three different optical imaging systems (LSCI, OIS and Ca2+-sensitive dye imaging) [230]. In
another recent study, Takuwa et al. developed a multimodal imaging system for simultaneous measurement of CBF by LSCI and PET in awake behaving mice [231].
Furthermore, optical imaging can be combined with optogenetic techniques to manipulate cell-specific vasoactive signaling cascades in vivo. Indeed, several transgenic mouse lines have been developed with cell-type specific expression of light-gated ion channels or pumps of bacterial origin, such as channelrhodopsin-2 (ChR2) and halorhodopsin. These genetically encoded optical actuators can be activated using specific laser wavelengths (e.g. blue-green light for ChR2 or yellow for halorhodopsin), leading to activation of cells that express the transgene [232, 233]. Hence, optogenetics can be used to investigate the specific neuronal subtypes and neurotransmitters that are involved in the initiation of the vasodilatory or vasoconstrictive responses during functional hyperemia. However, to ensure cell specificity, measures must be taken in order to inhibit the spread of depolarization to other cell types. For instance, unless synaptic communication is prevented, photoactivation of pyramidal cells elicits connectivity between different brain areas, leading to the firing of several cellular types and the release of many neurotransmitters [34, 234]. Moreover, Rungta and colleagues have recently found light per se to cause a Ca2+ decrease in VSMCs and to induce vasodilation, independently of neural and glial activity, thus warranting the careful use of optogenetics in studies involving the cerebral circulation [235].
5. Implications of Stress in Conscious Imaging
5.1 Effect of Stress on Cerebral Hemodynamics
One concern that arises when performing imaging in conscious animals is that they may experience high levels of stress due to head immobilization or the imaging procedure itself. As we will see, stress has been shown to produce systematic effects on the brain and to induce variations in CBF, CMR and NVC through effects on neuronal and glial populations as well as the cerebrovascular system.
Indeed, in an early review by Kety and colleagues, it was observed that one human participant who had showed considerable fear throughout the test situation exhibited markedly elevated CMR of oxygen (CMRO2) (5.0 mL/100 g/min) relative to his physiological range (3.2-4.2 mL/100 g/min) [236]. The authors concluded that apprehension or stress could lead to increases in cerebral metabolism. Similarly, another study in humans showed pain-induced stress to increase CBF by approximately 10%, especially in frontal brain regions [237]. These clinical observations were replicated experimentally with rats, with 5 to 30 minutes of immobilization with a muscle relaxant inducing up to twofold increases in both CBF and CMRO2 [238, 239].
Additional stressors that were found to increase CBF and CMR in laboratory animals include ethanol withdrawal [240, 241], hypotension [242], hypoxia [243, 244] and conditioned fear [245, 246]. In contrast to pharmacological immobilization and the aforementioned stressors, Ohata and colleagues found physical immobilization (5-15 minutes) to decrease CBF by ~12-14% in wild type rats [247], and to have no effect on CBF in spontaneously hypertensive rats except in the frontal lobe where flow was increased by 21% [248]. However, in the latter studies, the restraint procedure elicited hyperventilation in the rats, leading to a significant decrease in the levels of
vasodilatory CO2. Hence, the resulting constriction of cerebral vessels could have offset
stress-evoked increases in CBF or led to reduced flow. Interestingly, tissue lactate was reported to increase during physical restraint [249], reflecting an increase in CMRglc. These findings suggest that restraint stress increases metabolic demands in the brain, though these changes may not always be accompanied by an increase in CBF, due to altered cerebral hemodynamics.
Indeed, chronic immobilization (2 hours per day, for 10 consecutive days) was found to attenuate changes in CBF in the rat somatosensory cortex of following inhalation of high amounts of CO2 [250]. Similarly, chronic immobilization (2 hours per day, 3 weeks) diminished the cerebrovascular response to electrical stimulation of the rat hindpaw, as observed by the reduced variations in CBV and pial arterial dilatations relative to the control condition. Moreover, when rats were subjected to varying lengths of immobilization stress, the hemodynamic response was the least decreased in the acute restraint group (2 hours, single session), and the most decreased in the chronic 6-week restraint group, suggesting that stress exerts cumulative effects on NVC [251].
5.2 Stress-induced Modulation of the Neurovascular Unit
As with anesthesia-evoked NVC impairment (see Section 3.1), stress induction in conscious animals likely interferes with cerebral hemodynamics by effecting changes in neural, vascular and glial cells. Indeed, chronic stress exposure has been demonstrated to influence the physiology of neurons and to elicit detectable microscopic changes in neuronal networks involved in the processing of anxiogenic and fearful stimuli. Specifically, changes include the modulation of the dendritic arborization, spine and synapse count in the amygdala, the hippocampus and the prefrontal cortex [252]. These stress-induced structural changes are partly