HAL Id: hal-02063356
https://hal.uca.fr/hal-02063356
Submitted on 25 Jan 2021
HAL is a multi-disciplinary open access
archive for the deposit and dissemination of
sci-entific research documents, whether they are
pub-lished or not. The documents may come from
teaching and research institutions in France or
abroad, or from public or private research centers.
L’archive ouverte pluridisciplinaire HAL, est
destinée au dépôt et à la diffusion de documents
scientifiques de niveau recherche, publiés ou non,
émanant des établissements d’enseignement et de
recherche français ou étrangers, des laboratoires
publics ou privés.
Simulation of carbon monoxide redistribution over
central Africa during biomass burning events
(Experiment for Regional Sources and Sinks of Oxidants
(EXPRESSO))
S. Cautenet, D. Poulet, C. Delon, Robert Delmas, J.-M. Grégoire, J. Pereira,
S. Cherchali, O. Amram, G. Flouzat
To cite this version:
S. Cautenet, D. Poulet, C. Delon, Robert Delmas, J.-M. Grégoire, et al.. Simulation of carbon
monox-ide redistribution over central Africa during biomass burning events (Experiment for Regional Sources
and Sinks of Oxidants (EXPRESSO)). Journal of Geophysical Research: Atmospheres, American
Geo-physical Union, 1999, 104 (D23), pp.30641-30657. �10.1029/1999JD900393�. �hal-02063356�
JOURNAL OF GEOPHYSICAL RESEARCH, VOL. 104, NO. D23, PAGES 30,641-30,657, DECEMBER 20, 1999
Simulation
of carbon monoxide redistribution
over central Africa
during biomass burning events (Experiment for Regional
Sources and Sinks of Oxidants (EXPRESSO))
S. Cautenet,
• D. Poulet, • C. Delon, 2 R. Delmas,
2 J.-M. Gr•goire, 3
J. M. Pereira, 4 S. Cherchali, s O. Amram, s and G. Flouzat s
Abstract. The Regional Atmospheric
Modeling System
(RAMS) is used to assess
a
realistic estimate of emissions by savanna fires from NOAA advanced very high resolution
radiometer (AVHRR) satellite imagery during the Experiment
for Regional Sources
and
Sinks of Oxidants (EXPRESSO) campaign.
The daily amounts
of gases
released
by
biomass burning depend on burnt biomaterial, the mass of which is estimated from two
independent
methods:
classification
of vegetation
formations
(CV) or net primary
productivity
(NPP). The area of the burnt zone is derived from satellite imagery.
The
percent of burnt biomass
or combustion
factor (a) is determined
by an adjustment
procedure
using two model runs and assumed
to be 40%, a value consistent
with the
biomass wetness. The simulated CO redistribution is compared with aircraft measurements
(tracks and profiles). Two events
of 4 and 5 days are examined,
where flights above forest
and savanna zones have been performed. In this study we show that the main mechanisms of the chemical species spatial redistribution originates from mesoscale features. The RAMS results are in rather good agreement with the aircraft measurements (vertical
profiles or horizontal legs) over forest and savanna.
The difference between the CO
simulated
fields obtained from CV or NPP is weak (about 20% or 30%), and it is difficult
to discriminate the best method because this difference is generally inferior to the gap between model and observations. One may consider this study as a preliminary approach
to improve the estimate of released
gases
by biomass
burning with the help of mesoscale
modeling and the knowledge of the real sources.
1. Introduction
In recent years, evidence has begun to accumulate indicating that emissions from biomass burning are a dominant pertur- bation of atmospheric chemistry in the tropics, with a signifi- cant impact on the Earth's climate [Crutzen and Andreae, 1990; Levine, 1991; Delmas et al., 1991]. Most vegetation fires take place in tropical and equatorial regions, and there are strong seasonal variations in the extent and frequency of the savanna fires. In Africa (where half of the world's savanna biome is located [Andreae, 1991]), biomass burning plays an important role in the enhancement of the atmospheric greenhouse gases such as CO2, CH4, or ozone in the free troposphere [Ra- manathan et al., 1985; Cofer et al., 1990, 1996]. Large amounts of chemical compounds emitted by fires are distributed along the Intertropical Convergence Zone (ITCZ) on both sides during the dry seasons. From November to March the fire area
•Laboratoire de M•t•orologie Physique/OPGC, CNRS and Univer-
sit• Blaise Pascal, Aubi•re, France.
2Laboratoire de'A•rologie/OMP, CNRS and Universit• Paul Saba-
tier, Toulouse, France.
3Space Applications Institute, Global Vegetation Monitoring, Joint
Research Center, Ispra, Italy.
4Department of Forestry, Universidade Tecnica Lisboa, Lisbon. SCentre d'Etudes Spatiales de la Biosphere, Unit• Mixte de Recher- che Centre National d'Etudes Spatiales, Universit• Paul Sabatier,
CNRS, Toulouse, France.
Copyright 1999 by the American Geophysical Union.
Paper number 1999JD900393.
0148-0227/99/1999JD900393 $09.00
covers west and central Africa (Northern Hemisphere), but from July to October the fires are located in southern and east Africa (Southern Hemisphere). The aerosols and trace gases emitted by fires are transported above the central equatorial Atlantic. Many investigators have shown the role of large-scale circulations and convective transport in bringing these trace gases from sources to this accumulation zone [Chatfield et al., 1996; Krishnamurti et al., 1996; Pickering et al., 1996; Wang et al., 1996; Browell et al., 1996; Fishman et al., 1990, 1992, 1996; Garstang et al., 1996; Thompson et al., 1996].
Previous experiments (Fire of Savanna (FOS)/Dynamique et Chimie Atmosphfirique en For•t Equatorial (DECAFE) in 1991 and the Southern African Fire-Atmosphere Research Initiative (SAFARI) in 1992) have helped to characterize the burnt biomass, the fire behavior, and the emissions from Af- rican savanna fires [Menaut et al., 1991; Delmas et al., 1991; Scholes et al., 1996; Stocks et al., 1996; Trollope et al., 1996]. They showed that during the dry season, the regional scale photo- chemistry is basically regulated by biomass burning emissions.
During the Experiment for Regional Sources and Sinks of Oxidants (EXPRESSO) campaign, conducted in November and December 1996, aircraft measurements of atmospheric chemistry and meteorological parameters have been achieved. These data are associated with remote sensing imagery of the fire pattern. The aircraft data have been collected far from the main burning areas, at distances ranging between 200 and 500 km south of the region where intense savanna fires occur (central Cameroon and Central African Republic, southern Chad, northeast Central African Republic and southern Su- 30,641
30,642 CAUTENET ET AL.: CO REDISTRIBUTION OVER CENTRAL AFRICA
[,
[ Rain
forest
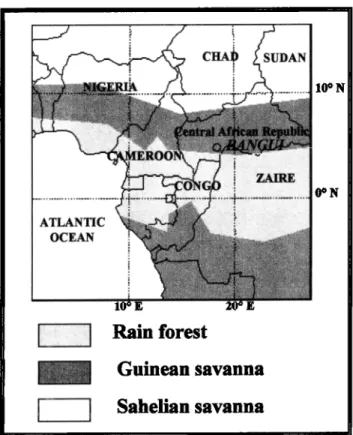
Guinean savanna Sahelian savanna 10 ø N 0 ø NFigure 1. Location of countries and vegetal cover in central
Africa: rain forest and Guinean and Sudanian savannas.
dan, Figure 1), with a view to checking the redistribution of pollutants near the ITCZ above moist savanna or forest cover.
Since photochemistry in the lower atmosphere is primarily driven by the sources of reactive trace compounds, in our study the first requirement is to get a realistic estimate of emissions by savanna fires. This is done through the detection and map- ping of burnt surfaces using daily acquisition of NOAA ad- vanced very high resolution radiometer (AVHRR) satellite pictures and the after-imagery of burnt surface characteristics [Pereira, 1999; Pereira et al., this issue]. Maps of burnt areas with a resolution of 0.25 ø x 0.25 ø are converted into trace gas flux maps through empirical relationships, taking into account aboveground vegetation exposed to fires, combustion com- pleteness, and emission factors. Large uncertainties affect most of these terms. These formulae originate from previous campaigns. The main aim of this modeling work is to assess the relevance of these relationships using a chemical tracer, carbon monoxide, assumed to be stable during its transport through- out the experimental domain. We use the Regional Atmo- spheric Modeling System (RAMS) [Pielke et al., 1992]) me- soscale model in its nonhydrostatic version coupled with a CO emission module. We run the model with two nested grids. Two events, which have substantially different meteorological contexts, have been simulated: one from November 23 to 26,
the other from November 28 to December 2. For the meteo-
rological fields over central Africa and for the CO concentra- tion field, the model validation is based upon experimental data sampled during flights over two ecosystems: Guinean sa- vanna and forest. All the flights are located south of the ITCZ: for the first event, far from the ITCZ; for the second, in close proximity to the ITCZ.
This paper presents first the methods of evaluation of the
CO fluxes from daily maps of burnt areas. Then we show (1) a general overview of the meteorological conditions over central Africa during EXPRESSO, during the dry season, based on numerical results in the large grid; and (2) a mesoscale study with the fine grid, which highlights the main mechanisms of the chemical species' spatial redistribution: organized conver- gence/divergence zones localized along the ITCZ over central Africa, horizontal exchanges between savanna and forest eco- systems, and vertical transport from the boundary layer to the free troposphere. We examine the redistribution of CO fields, and we compare them with aircraft observations. Finally, this numerical method enables us to provide a first approach for checking the previous estimated CO fluxes from savanna fires in central Africa which will be applied to all trace gas fluxes having a significant impact on regional scale photochemistry.
2. Vegetation Fire Studies
Satellite remote sensing is the only technology that allows consistent data collection of the spatial and temporal distribu- tion of fires at the scale required by the EXPRESSO experi- ment.
A portable monitoring system was developed and operated, in collaboration with the Institut Frangais de Recherche Sci- entifique pour le D0veloppement en Coop0ration (ORSTOM) and the National Research Institute (NRI), in central Africa for the in situ, real-time acquisition and processing of NOAA AVHRR imagery [Janodet et al., 1996; Grdgoire et al., this issue]. The acquisitions were initiated on October 1, 1996 and ended on December 2. One AVHRR scene per day was pro-
cessed in situ to locate active fires and burnt areas within a
region
of 1,600,000
km
2, centered
on the Central
African
Re-
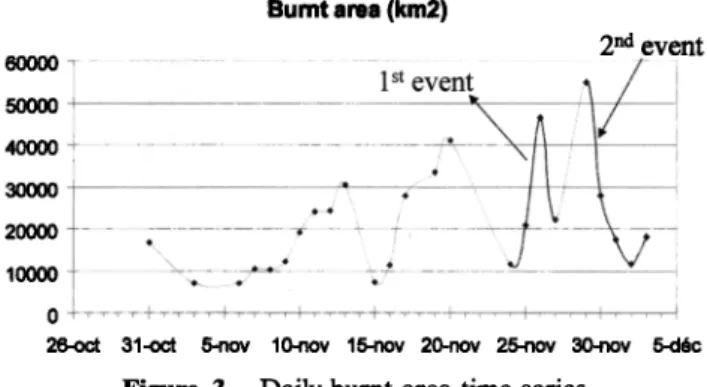
public (4ø-12øN, 8ø-28øE). The detection of the image pixels containing one or more active fires was done using the contex- tual algorithm of Flasse and Cecatto [1996] applied to the visible, infrared, and thermal infrared channels of NOAA AVHRR images. Mapping of burnt areas was performed using the method developed by Pereira [1999], which discriminates burnt surfaces using three types of spectral information: (1) the GEMI3 spectral index, a modified version of the global envi- ronmental monitoring index (GEMI) [Pinty and Verstraete, 1992]; (2) the reflectance values of channels 1 and 2 of AVHRR; and (3) the reflective part of the response in AVHRR channel 3. From the daily fire maps, temporal com- posites were done (Figure 2), as well as an analysis of fire distribution by vegetation type within the EXPRESSO study area. A detailed analysis of fire occurrence during the month of November 1996 is presented by Pereira et al. [this issue] and Grdgoire et al. [this issue]. According to these authors the main causes of error are significant cloudiness, radiometric noise, and an incomplete satellite coverage of the area under study. They derive a burnt area which therefore can be underesti- mated in some instances because of an extensive cloud cover; on the other hand, the next days are overestimated as they are assigned the burnt surfaces not retrieved during the previous period. Thus the daily burnt area (Figure 3) shows large vari- ation and can double from day to day. However, when cumu- lated over a 4- or 5-day event, their estimate of the total burnt area is accurate (+15% approximately [Pereira et al., this is- sue]) because during the dry season the cloud cover is not persistent. In our modeling study we cannot accurately recon- struct the true spatiotemporal distribution of fires, which could
CAUTENET ET AL.: CO REDISTRIBUTION OVER CENTRAL AFRICA 30,643
4oO,O,,N
2'0'0'•
10o0,0'•
ß , , ,"
I 2'0'0"•
10'O'O"E 12"O•ff'E 14'O'O'E 16' 0'0'• 18'00'E 20"ffi)' E 22 "O'O"E 24'0'0"E
F < 2.5 % 2.5 % <F < 5.0%
F> 5.0%
Figure 2. Detection of active fires during the dry season field experiment: percentage of AVHRR pixels detected as fire pixels in each 0.25 ø x 0.25 ø cell for 25 days (October 31 through December 2, 1996) [Peteira et al., this issue; GrEgoire et al., this issue].
be the origin of some discrepancies. We have to keep this in mind when analyzing our results.
3. Estimate of CO Fluxes
Fire is a regular phenomenon in savanna regions, which occurs each winter during the dry season in central Africa. The herbaceous mass in savannas ranges from 1000 kg ha -• in semiarid areas to 7000 kg ha -• over optimum sites. Moist savannas have high levels of herbaceous productivity, with an- nual production values of up to 4800 kg ha -• for central Af- rican miombo [Rutherford, 1978]. However, the wet savanna (80% of moisture) in Lamto (west Africa) exhibits a mass of dry matter of 8000 to 9000 kg ha -• [Lacaux et al., 1993, 1995].
The emission of any gaseous or particulate compound from biomass burning depends on two parameters: the amount of biomaterial burnt and the emission factor (EF), which repre- sents the proportion of a given compound released during the combustion. For regional flux determination, in which the amount of biomass burnt can be estimated, the simplest ap- proach is based on an equation such as
60000 50000 40000 30000 20000 10000 Burnt area (km2) 2 nd event
e
e-•i•, /-
1
st V
i
•.e
'"
26-oc! 31-oct 5-nov 10-nov 15-nov 20-nov 25mov 30mov 5-d•c
Figure 3. Daily burnt area time series.
(I) IX] = B aEF[X] (1) where •[X] represents the emission flux of the compound X, B is the biomass exposed to fire (kg m-2), cr is the fraction of the biomass which is actually burnt (also called combustion factor), and EF[X] is the emission factor of the compound X
(g kg-• dry fuel). Each
of these
terms
depends
on vegetational
composition, environmental conditions, land use patterns, and fire regimes (ignition potential, fire behavior). These factors influence the quantity and the distribution of emission chem- istry. Finally, large uncertainties exist on each term of (1)
which we will examine in the next sections.
3.1. Biomass Exposed to Fire
Two independent methods to estimate the biomass density are used in this study. The first evaluates the biomass from classification of vegetation according to a vegetation types map [Peteira et al., this issue], hereafter referred to as CV; the second evaluates the biomass from net primary productivity or
NPP.
For CV the biomass density is obtained from the literature. Maxima and minima biomass density values were taken into account because these vegetation types present a high interan- nual variability. The values for the Sudanian savanna range
between
2 and 4 t ha -• [Menaut
et al., 1991];
those
for Guinean
savanna range between 3.6 and 7.9 t ha -• according to data from the Oak Ridge National Laboratory Distributed Active Archive Center (ORNL DAAC) data base (available at http:// www'eøsdis'ørnl'gøv/npp/npp-høme'html' 1998). For dense forest the minimum and maximum values range between 94 and 457 t ha -• [Brown and Gaston, 1996].
For the second method (NPP) the biomass density is ob- tained by a new approach. The methodology for this estimation of biomass exposed to fire at regional scale is based on a functional classification of the vegetation formations estab-
30,644 CAUTENET ET AL.: CO REDISTRIBUTION OVER CENTRAL AFRICA
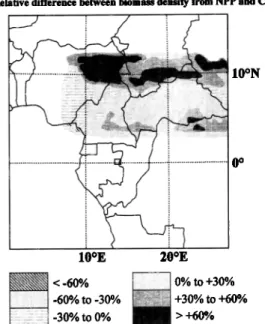
Relative difference between biomass density from NPP and CV
10øN 0 o 10øE 20øE
.•<-60%
-60% to-30% -30% to 0% 0% to +30% +30% to +60% > +60%Figure 4. Difference between assessment of biomass density from net primary productivity (NPP) and classification of veg- etation formations (CV) (NPP biomass density - CV biomass density). These values are averaged on cells of 60 km x 60 km.
lished from NOAA AVHRR data with resolution of 8 km in
space and 10 days in time over a period of 11 years (1983 to 1993). Time series analysis techniques provide an opportunity to identify and describe coherent structures in the observation using few parameters. The approach used merges those objects that have similar temporal behaviors. This clustering model allows analysis of the phenological behavior of the terrestrial surface at small scale. The map obtained accounts for the mean annual functioning of the vegetation and for the interannual variability of the vegetation formations.
Then a model [Kumar and Monteith, 1982] is used to esti- mate regional net primary productivity (NPP). The model as- sumes a decomposition of NPP into independent parameters such as incident solar radiation, radiation absorption efficiency by canopies ei, and conversion efficiency of absorbed radiation into organic dry matter e b. A similar approach has already been used for the estimation of the terrestrial biosphere NPP by Heimann and Keeling [1989] and Ruimy et al. [1994], but the precision for some of the input parameters has been greatly improved, as recommended by Ruimy et al. [1994], compared to previous uses of this model on a regional or global scale. The radiation absorption efficiency 8i has been derived from the time series classification profiles for each vegetation class using the time evolution of the normalized difference vegetation index (NDVI) cycle (obtained in the previous step above). The eb vegetation map is established from NDVI time series clas-
sifications which take into account the interannual variation in
vegetation cover and from the distinction between trees and herbaceous species. Better biomass estimates are obtained. However, the estimation of biomass density is difficult, and the total error can reach 80% in some cases. Figure 4 shows the difference between the biomass density as evaluated from CV and NPP. The average variation is about 30% between the two methods, and the values are generally higher (positive differ- ence) for NPP than CV except for Guinean savanna in Nigeria. We note that the higher values are found in Guinean more
than in Sudanian savannas.
3.2. Combustion Factor (t•)
The combustion factor (a) determines the ratio of burnt to
total biomass in the field. It is a direct function of fuel moisture
which varies according to plant species and as a function of time during the dry season. Early fires ignite the fairly humid grass cover with difficulty and burn only 20-25% of the grass cover. Middle to late fire destroys most of the herbaceous biomass (up to 100%); however, due to spatial heterogeneity only 65-95% of the biomass is consumed on average in humid savanna [Menaut et al., 1991]. Large variations were observed in the SAFARI campaign where 98% of available grass fuels, but only 32% of downed and dead woody fuels, were consumed
[Shea et al., 1996].
Giving, a priori, an average value to a is somewhat specu- lative since the grass cover moisture is not homogeneous over the entire savanna region, and varies all along the campaign. During the EXPRESSO campaign the fires mainly took place over Guinean savanna where grass and woods often are mixed. The a value may range from almost 1 (dry biomass) to much lower values (wet vegetation). This point will be discussed in
section 4.
3.3. Emission Factor
The emission factor is generally calculated by reference to CO2 on the basis of the experimental emission ratio: ER - A[X]/A[CO2] corresponding to the excesses of these two con- stituents in the fire plume compared with the average concen-
tration in ambient air. The emission factor is derived from the
emission ratio ER using the carbon mass balance method, since the amount of carbon in the biomass material (around 45%) presents little variation and most of the carbonaceous species can be measured [Delmas et al., 1995]. The emission ratio is highly dependent on the type of combustion, especially the relative importance of the two main phases of the combus- tion, flaming and smoldering. Whatever the combustion phase, the main compound emitted is CO2, which represents between 85% and 90% of the carbon released into the atmosphere [Lobert et al., 1991].
Three complete data sets were obtained during prescribed savanna fires in Australia [Hurst et al., 1994a, b], the FOS/ DECAFE experiment on the Ivory Coast [Lacaux et al., 1993, 1995] and the SAFARI campaign in South Africa [Cofer et al., 1996; Andreae et al., 1996a, and references therein].
The most recent data set obtained during the SAFARI cam- paign is certainly the most complete as it concerns measure- ments carried out by several groups in different ecosystems. ACO/ACO2 (mol%) ratios measured in the various ecosystems range from 3.5 _+ 1.0 in semiarid savanna in Zimbabwe [Le Canut et al., 1996] to 9.4 _+ 1.3 in a mixed forest-shrub area in the humid mountain area of Natal, South Africa [Koppmann et al., 1996]. The average ACO/ACO2 ratio is a good indicator of the quality of the combustion, low values being associated with intense flaming conditions. An average value of 6.2% is con- sidered as representative of CO emission ratios for average savanna fires [Andreae et al., 1996a]. Using this value and the carbon mass balance method, we come up with an average emission factor of 65 g (CO)/kg of dry matter for savannas and 230 g (CO)/kg of dry matter for forests.
During the EXPRESSO campaign the observed domain had an area equal to 1,970,000 km 2, (12øN to 4øN in latitude and 8øE to 28øE in longitude). Between October 31 and December
2, 1996,
an area
of 514,000
km2
was
burnt.
The relationship
(1)
CAUTENET ET AL.: CO REDISTRIBUTION OVER CENTRAL AFRICA 30,645 (a) ' ' I{IøE 20øE 11/23/96
[-'-• 0 to
15
(b)
10OE 20OE
11/25/96 10ON 0 o 11/24/96 11/26/96CO surface emission (kg ha-1 d-1)
' 15
to
45
1
45
and
more
10øE 20øE 10øE 20øE
11/28/96 11/29/96 11/30/96 ,, , 12/01/96 12/02/96 lOON 10ON 0 o CO flux (kg. ha 4 day 4)
• .... 0 to
20
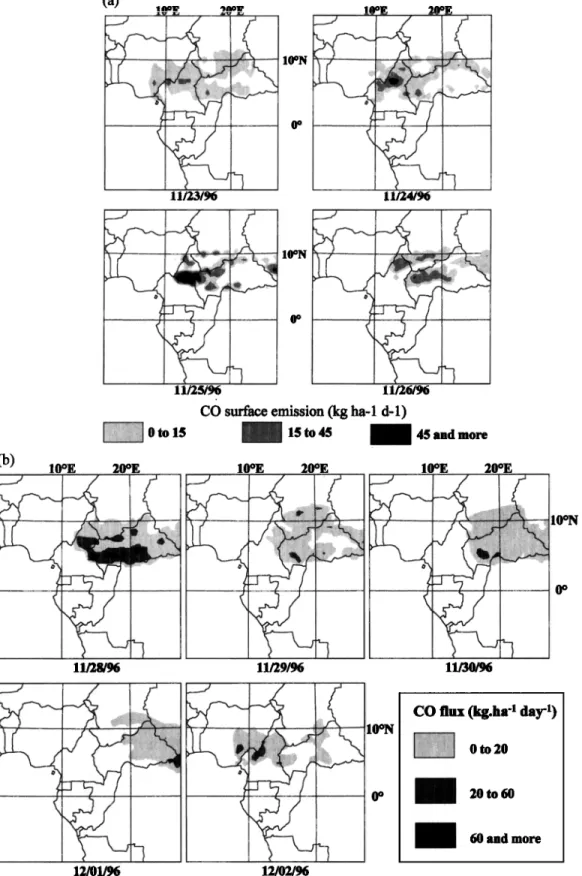
20 to 60 60 and moreFigure 5. Emitted carbon monoxide fluxes at the surface for (a) November 23, 24, 25, and 26, 1996, and (b) November 28, 29, and 30, and December 1 and 2. These fluxes are calculated from the CV method with asav = 0.8. They are averaged on cells of 60 km x 60 km.
(CO)for --- 230 g/kg) gives 16 Mt of CO emitted during this period, that is, 313 kg ha -1 of burnt area. These values are more important than those obtained in the SAFARI experi- ment, where an average value of 200 kg ha -1 was found.
Figures 5a and 5b exhibit the CO emission fluxes averaged on grid 1 (cells equal to 60 km x 60 km), for the 4-day event from November 23 to 26, 1996 (first event, Figure 5a) and for the 5-day event from November 28 to December 2 (second
30,646 CAUTENET ET AL.: CO REDISTRIBUTION OVER CENTRAL AFRICA EXPRESSO
10 ø E 20 ø E
10 ø N
0 ø N
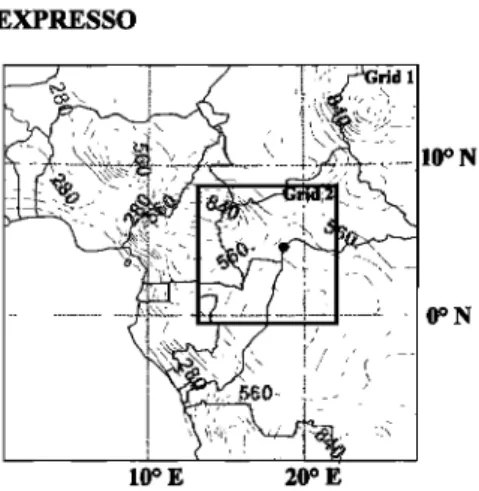
Figure 6. Topography in meters and two nested grids in the simulated domain. The coarse grid (or grid 1) has 50 grid points with spacing of 60 km, and the fine grid (or grid 2) has 50 grid points with spacing of 20 km.
event, Figure 5b). There is a maximum in central Cameroon on November 25 and in the Central African Republic on Decem- ber 28. Some values are very high, for example, 144 kg ha -•
d -• (cell of 60 km x 60 kin) where the unburnt
regions
are
mixed with burnt ones. For the second event the emissions are more extended and more intense than the first. We remark
that for both studied events (1) the surface emission shifts eastward day by day and (2) the daily intensity of CO flux vanes strongly from one day to the next by a factor of 3 due to the remote sensing method. Every day, more or less intense fires are located in the north of the EXPRESSO domain, about
200-500 km from aircraft observations.
4. Numerical Model
Our modeling task is based upon the regional atmospheric modeling system (RAMS) code [Pielke et al., 1992]. RAMS is a primitive equation prognostic model developed for the sim- ulation and forecasting of weather systems. This model runs using the nonhydrostatic option. The cloud convection model included in RAMS is the explicit scheme of Tripoli and Cotton [1982]. The model predicts soil temperature and moisture from the prognostic soil model [Tremback and Kessler, 1985], which takes into account the vegetation cover and the type of soil according to Avissar and Pielke's [1989] model. Many previous investigations on regional pollution have made use of RAMS [Lyons et al., 1995; Millan et al., 1997; Edy and Cautenet, 1998].
The simulated domain exhibits three classes: rain forest, mixed forest/savanna (Guinean savanna or moist savanna), and Sudanian savanna or dry savanna (Figure 1). The topography (Figure 6) is available from the NOAA web site at http:// www.ngdc.noaa.gov/mgg/global. We can see that the relief is not negligible: Adamaoua Plateau is located in central Cam- eroon (grid 1) and in the northwestern Central African Re- public (grid 2). The "wall on top" condition is used as a top boundary condition. The lateral boundary condition uses the Davies [1976] relaxation method to nudge the RAMS solution to the observations (European Centre for Medium-Range Weather Forecasts (ECMWF) data). The nudging .is weighted at t,he five outermost points. The radiation scheme [Chen and Cotton, 1988] predicts the longwave and shortwave radiation tendencies. It includes the radiative effect of water vapor,
ozone, and carbon dioxide. The turbulence scheme is the Sma- gorinsky deformation eddy viscosity described by Tripoli and Cotton [1982], where adjustments to the vertical exchange co- efficients were made using a Richardson number/moist Brunt- Vaisala frequency enhancement factor. The advection opera-
tor is the flux form of the sixth order for the horizontal
advection and a forward form of the vertical advection [Trem- back et al., 1987]. The time split scheme [Tremback et al., 1987] is used for the model time integration. In addition, RAMS has the capability to thoroughly describe the transport of passive scalars including three-dimensional (3-D) advection and tur- bulent diffusion. We use this option to study the CO transport.
The initialization is obtained from the 0000 UTC ECMWF
data and from assimilation of the 0000 UTC Bangui (4.23øN, 18.34øE) soundings and surface data. A weak nudging of me- teorological fields is carried out every 24 hours. The run begins
at 0000 UTC on November 23 and ends at 2400 UTC on
November 26 for the first event; it begins at 0000 UTC on
November 28 and ends at 2400 UTC on December 2 for the
second event. Two nested grids are used (Figure 6). The coarse grid (or grid 1) domain is bounded by 0øE to 30øE longitude, and 20øN to 10øS in latitude. This domain consists of 50 grid points in the x direction and 50 grid points in the y direction. The horizontal coarse grid spacing is 60 km in both the east- west and north-south directions with 30 sigma-z levels. The vertical grid spacing is 25 m near the ground, with a geometric
stretch ratio of 1.2 and a maximum interval of 1000 m above
3000 m up to the model top. The geometric stretch ratio is used to provide a higher resolution close to ground. The time step used for grid 1 is 60 s. The fine grid (hereafter named grid 2) is centered on Bangui (4.23øN, 18.34øE) and illustrates the EXPRESSO region. There are also 50 points with a horizontal fine grid spacing of 20 km in both the x and y directions. The vertical spacing is the same as in the coarse grid. The two grids communicate with each other in a two-way scheme described by Clark and Farley [1984]. The nested grid allows a wider range of motion scales to be modeled simultaneously and in- teractively. The time step for grid 2 is 20 s.
For estimating the planetary boundary layer and the mixing meteorological quantities in the lower troposphere, we inves- tigated the realistic comprehensive surface heat flux over sa- vanna and forest. The parameters for the soil and vegetation
modules have been chosen so that latent and sensible heat
fluxes in forest and in savanna are realistic with respect to observations (C. Delon et al., unpublished manuscript, 1999). Averaged sensible flux is 63 W m -2 in forest and 95 W m -2 in Sudanian savanna, while averaged latent flux is 350 W m -2 in forest and 240 W m-2 in savanna. The Bowen ratio is about 0.2
for forest and 0.4 for savanna. The modeled maxima values
conform to measurements in a magnitude of 30%.
The numerical model is coupled on-line with the emission module. For each cell, if the fire activity is detected by satellite, the daily burnt biomass density is evaluated according to the CV or NPP method. It depends on the burnt areas. Then, at each time, CO fluxes are estimated at any grid point following (1). CO emission is assumed to occur only during daytime and at a constant rate during 9 hours (from 1000 to 1900 UTC) [Moula et al., 1996; Menzel et al., 1991]. Runs with a variable rate (depending on sinusoidal time, with a maximum at 1500 UTC) have been performed, but the effect on CO redistribu- tion is negligible. For each fire event, two runs are carried out
CAUTENET ET AL.: CO REDISTRIBUTION OVER CENTRAL AFRICA 30,647
EXPRESS0 - 11/25 - Grid I EXPRESSO -12/1 - Grid 1
10øE 20OE
10øN
0 o
10OE 20OE
10ON
Figure 7. Horizontal mixing ratio of water vapor at 250 m in grid 1 for November 25 and for December 1 at 1200 UTC. Shading denotes the position of the ITCZ obtained from the strong horizontal gradient (15 g
kg
-• and 10 g kg-•). Close to Bangui,
the observed
values
in aircraft
measurements
are 17 g kg
-• on
November 25 and 15.2 g kg -• on December 1.
run A, and 0.4 for run B. The contribution of burning forest in CO flux is very small, so afor may keep the same value for both runs (0.25). These two values represent 100% of the variability of CO emission. This point needs to be highlighted here.
The choice of the a values may seem somewhat arbitrary. However, in previous sections, we have discussed the uncer- tainties associated with the various factors making up the CO flux: burnt area (100%), biomass exposed to fire (80%), and now a (100%). The emission factor is assumed to be known with a rather good accuracy and may be neglected in the present discussion. All these uncertainties lead us to use a tuning technique when running the model, rather than exam- ining each term of the CO flux formula. The first run (or run A) with a = 0.8 for both events gives overestimates in CO concentrations (when compared with experimental data). The second run (or run B) with a = 0.4 is much more realistic for both events (all the other factors remain unchanged). The effect is to divide the CO flux by 2, so that any term (burnt area, biomass density, a, or emission factor) could undergo this modification; however, it seems logical to divide a because the surface wetness precludes a complete burning and, also, a is the only parameter constant at any grid point.
In the fire areas a forcing of the air temperature equal to 3øC is performed so as to obtain a mean value about 1000 m for the convection column height above ground level. For dry savan- nas in the SAFARI experiment, Stocks et al. [1996] show that the convection column height above ground level varies be-
tween 500 and 2200 m. For moist savanna the column is lower:
During the EXPRESSO campaign, fires mainly burn the bio- mass of Guinean savanna, a moist savanna. For this reason, the dry convection column is weakly developed in the vertical.
The background concentration is assumed to be 200 ppb in the boundary layer (below 1000 m) and 100 ppb above free troposphere because these are the smallest observed values in the EXPRESSO campaign. These are the model initial values.
5. Large-Scale and Mesoscale Features
Although the two modeled periods are very different as regards the ITCZ position (Figure 7), the large-scale mean flow patterns are typical of the dry season that dominated in the EXPRESSO period. In Figure 7, at 250 m above the surface, the water vapor mixing ratio exhibits a strong horizon-
tat gradient: 18 g kg -• at 10 g kg -• for both days. On the meridian line of Bangui, the ITCZ falls between 7øN and 8øN for November 25, and between 5øN and 6øN for November 30. It separates two air masses: the dry air advected by Harmattan
flow and the oceanic air from Monsoon flow. The surface air
moisture near Bangui is relatively high (17 g kg-•) for the first event, and slightly lower (15.4 g kg -•) for the second. These results (position of ITCZ and humidity) agree with aircraft and surface measurements (C. Deton et at., unpublished manu- script, 1999).
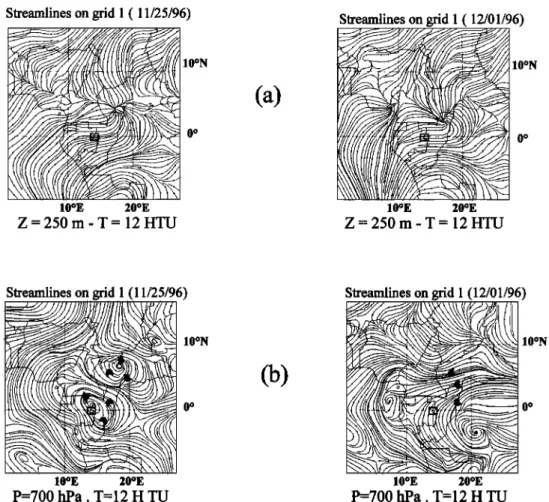
The streamlines near the surface (Figure 8a) show that the flow is well established north of 10øN (Harmattan from north- east) and below the equator (Monsoon from south). Between 0 ø and 10øN, the structure is very complex and depends on ITCZ position. Convergence and divergence zones associated with recirculation regions alternate along the ITCZ character- ized by the confluence of two flows. At 700 hPa, approximately 3 km above surface level (Figure 8b), the flow principally
comes from east-northeast for both cases. In the middle of the
troposphere, at 500 h Pa, approximately 5.5 km above surface level, easterly winds greater than 10 m s -• are well established
for the entire domain.
The most outstanding feature is the strong wind shear, Af- rican Easterly Jet, between the lower and upper levels in the zone located near the ITCZ, with very weak winds (about 2 to 5 m s -•) in the boundary layer close to the ITCZ and strong
winds
(greater
than 10 m s -•) in the free troposphere.
In this
type of simulation with two nested grids, not only are the large-scale fields described, but also the local circulations (val- ley and mountains or sea breezes, weak vegetation breeze between savanna and rain forest zones, cloud convection). These realistic dynamics contribute to give a better transport. In savanna regions the dry convection in the boundary layer is an important phenomenon. In the forest zone a shallow con- vection develops during afternoon (aircraft observations point out some stratocumutus clouds) and enhances the mixing pro- cesses within the boundary layer.
During the first event the vertical cross section of meridian winds at Bangui in grid 2 shows that the winds are weak (2 m
s -•) in the boundary
layer
inside
Monsoon
flow and higher
(4
m s -•) above savanna (Figure 9a). We note a zone with very
30,648 CAUTENET ET AL.: CO REDISTRIBUTION OVER CENTRAL AFRICA Streamlines on grid 1 (11/25/96)
53
•z" ••
10øN 0 o 10øE 20øE Z = 250 m - T = 12 HTU(a)
Streamlines on grid 1 ( 12/01/96) 10øN ß'
•
0
ø
10øE 20øE Z = 250 rn - T = 12 HTU Streamlines on grid 1 (11/25/96) 10OE 20OE P=700 hPa. T=12 H TU 10ON 0 o(b)
Streamlines on grid 1 (12/01/96) • I 10øN 10øE 20øE P=700 hPa. T=12 H TUFigure 8. Streamlines in grid 1 (a) at 250 m and (b) at 700 hPa in grid 1, for November 25 and for December
1 at 1200 UTC.
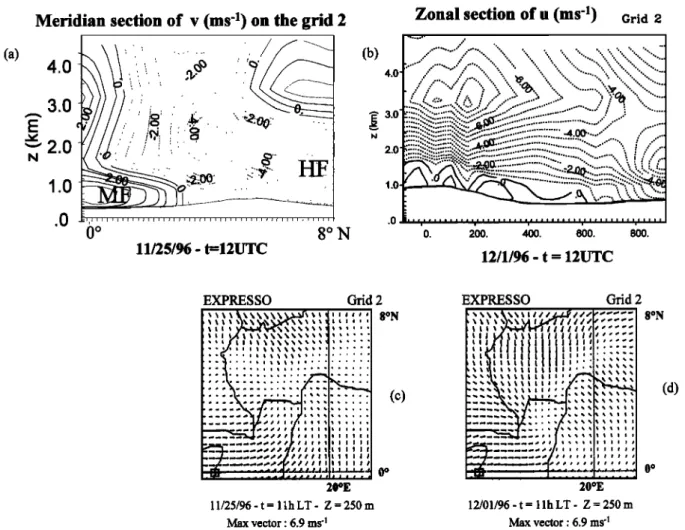
which is connected to the divergence zone (Figure 9c) or the convergence zone (Figure 9d). However, between 2000 and 3000 m in the middle of grid 2 (Bangui), winds are stronger (Figures 9a and 9b). The eastern component is about 5 to 8 m
s -1, which
constitutes
the African
Eastern
Jet (AEJ). In the
vertical section of the zonal wind component, we note that the local effect of the topography u is weakly positive in a globally negative Harmattan flow (Figure 9b). These results are in good agreement with the aircraft and sounding observations (Figure 10). The aircraft measurements above savanna or forest show that below 1000 m, in the Monsoon flow, the wind is weak (1 m s-•) and has a southwestern direction; above 1000 m, in the
Harmattan flow, the wind has a northeastern direction. At Bangui, the wind vector becomes regular above 3000 m (8 rn s-•). At 3000 m in altitude, the winds are weaker over savanna than over forest (Figures 9a, 9b, and 10). During the second event the wind in the boundary layer over savanna is mainly north, whereas the direction is very variable over forest (Figure 10). During the second event the ITCZ position was very low in latitude and located near Bangui. Large differences in wind pattern are observed (grid 2): In particular, the area covered by wind with a southward component reaches far lower latitudes, about 5øN, but only 8øN for the first event (Figures 9c and 9d). This is in agreement with observations (Figure 10).
This region is a convergence zone where strong updrafts develop (Figure 11). Although the region was under the Har- mattan flow, the topography plays its role to raise the pollut- ants (Figure 11). These local features are significant in these
meteorological situations where the wind is weak in the bound- ary layer.
In these cases of dry convection, we see that it is very im- portant to simulate the divergence/convergence zones associ- ated with the ITCZ (event 1 and event 2, respectively): This is the driving mechanism which pumps pollutants from lower levels up to free troposphere.
The vertical profiles of modeled potential temperature (Fig- ure 12) exhibit some differences between, on one hand, sa- vanna and rain forest regions, and fire zones on the other hand. We note a stronger instability near fires than in the Guinean savanna or the forest zone. In both cases, Guinean savanna and forest, the boundary layer is not very thick (1200 m). Above this layer, the troposphere is rather stable, which leads to weak vertical motions (some centimeters per second), of the same order as subsidence velocities. These features are confirmed by the observations during the EXPRESSO experiment (C. Delon et al., unpublished manuscript, 1999).
6. Aircraft Tracks
The aircraft involved in the EXPRESSO campaign was the
French research aircraft Fokker 27 Avion de Recherche At-
mosph6rique et de T616d6tection (ARAT). It measured the main meteorological and chemical parameters [Delmas et al., this issue]. Seven flights cover the two events we have modeled. Flights 45, 46, and 47 refer to the first event, whereas flights 50, 51, 52, and 53 refer to the second event. We have drawn the
CAUTENET ET AL.' CO REDISTRIBUTION OVER CENTRAL AFRICA 30,649
(a)
Meridian section
of v (ms
-1) on the grid 2
4.0 3.0 1.0 .0 0 ø 8 ø N 11/25/96- t=12UTC (b) 4.0
3.0
Zonal section
of u (ms
-1) Grid
•.o-
•
•.•"., ...
,.... ,...
.0 Illlllllllllllll I IllIll III II Illlllllllllllllllllll I I
O. 200. 400. 600. 800. 12/1/96- t = 12UTC EXPRESSO Grid 2 ::::::::::::::::::::::: (½) •0øE 11/25/96 - t = 1 lh LT - Z = 250 m Max vector' 6.9 ms 'l EXPRESSO Grid 2 8øN 0 o l, _ 20øE 12/01/96 - t = 1 lh LT - Z = 250 m Max vector' 6.9 rns 4
Figure 9. (a) Vertical meridian cross section of the v component in grid 2 centered at Bangui. HF denotes Harmattan flow, and MF denotes Monsoon flow. (b) Vertical zonal cross section of the u component in grid 2 at Y - 45 close to high topography. (c and d) Wind vector in grid 2 for November 25 and December 1 at
1200 UTC.
spatial tracks in grid 2 for both cases (Figure 13). We get five flights above forest and three above savanna because flight 53 is above savanna and forest as well. Flights were planned be- tween 1100 and 1300 (local time), the period of maximum radiation and fully developed boundary layer. These flights included profiles and legs with departure and return to Bangui. We note that the flights are far from emission sources, except for flight 51 above savanna (Figures 5 and 13). In Figure 13 the surface ITCZ is reported. Although these flights cover only a small part of central Africa, they characterize the air masses located south of the ITCZ for the first event and near the
ITCZ for the second event. The observed air masses represent
a domain of about 300 km x 300 km.
7. Redistribution of Carbon Monoxide Over Central Africa
The redistribution of pollutants emitted by biomass burning in savanna regions over central Africa is difficult to simulate because of the recirculations. In this work we investigate the redistribution of an inert tracer: carbon monoxide CO, which
has a lifetime of 1 month.
7.1. Comparisons With Observations
As stated in section 2, the emitted CO mass depends on burnt areas which are very variable day by day. We said that
estimates of CO emissions are certainly not very accurate on a daily basis, but must be quite reliable when cumulated over several days (4 or 5 days). Figure 3 shows this apparent vari- ability. During the first couple of days of the first event, the emissions are weak, but on the third day (November 25), they
are very
intense,
reaching
144 kg ha
-• d -• (Figure
5); for the
second event, they decrease every day.
For this reason, we compare observed and modeled values only at the end of each event. The corresponding flights are flight 47 (first event) and flight 53 (second event). It is a tough problem because of the difficulty of CO source assessment, and
also because of the accumulation of small errors in wind fields
on successive days.
Figure 14 displays these comparisons between modeled and
measured CO concentrations for both events.
Flight 47 (first event) consists of an horizontal leg at 500 m above ground level (up to 5500 s) over forest far from sources, then a northward ascent (up to 3500 m) toward the polluted zone, and finally a descent to 2000 m. During the first leg the model shows background values (200 ppb) for both runs A and B, whereas the measured values are much greater (300 ppb). During the ascending northward leg, closer to source zones, the agreement is much better, but only for run B. The same remark applies for the last descending leg. Flight 53 (second event) is almost meridian: a first leg southward above forest
30,650 CAUTENET ET AL.: CO REDISTRIBUTION OVER CENTRAL AFRICA
Aircraft measurements for the 1st event
4OOO 3000 2000 1000
Monsoon
0 45 90 135 180 225 270 315 360Wind direction (o)
...
Forest
zone
(Flight
46)-
... Savanna
zone
(Fright
45)
I
4000
3000
2000
1000
Aircraft measurements for the 2nd event
,
-180 -135 -90 -45 0 45 90 135 180
Wind direction (o)
... 'P0rest zone (Flight 52) ... Savanna zone (Flight 51)
Aircraft measurements for the 1st event Aircraft measurements for the 2nd event
4000
3000 2000 1000 0 5 10 15 20 Wind speed (m/s)...
.Forest
zone
(Flight
46)
...
Savanna
zone
(Flight
45)]
4000,
3000-
2000- 1000- 0 5 10 15 20 Wind speed (m/s)...
Forest
zone
(Flight
52)
...
Savanna
zone
(Flight
51)
]
Figure 10. Profiles of wind in the EXPRESSO campaign for flights 45 and 46 on November 24 and 25 and for flights 51 and 52 on November 30 and December 1.
(about 3800 s), a second leg northward (over forest, then sa- vanna). The flight is continually descending from 2000 m above ground level to about 500 m. Run A is not realistic at all (severe overestimations). The values from run B are much more satisfactory, although they are greater than observations in the first leg. During the second leg, the modeled values from run B become increasingly satisfactory, and particularly near
the surface. In its entirety, the values obtained from run B are
more accurate than those from run A.
Figure 15a shows two CO profiles from the flights 45 and 46 (November 24 and 25, 1996) of the EXPRESSO campaign: the first for the savanna zone and the second for the forest zone. Figure 15b exhibits the corresponding simulated CO profiles obtained from runs A and B. For run B, the two methods (CV
EXPRESSO Grid 2 EXPRESSO Grid 2
4.0
2.0
ß ß 1.0 .0 I I I I I I I I I I I I I I I I I I I I I I I I I I I I I I I I I I I I I I I I I I I I I I I I'0.
•00.
i00.
•00.
t•00.
0.
200. 400.
600. 800.
W(cm
s
-] ) - x (kin)
W(cm
s
-] ) - x (kin)
(a)
(b)
Figure 11. Vertical
cross
section
of ascent
speed
(cm s -•) in grid 2 (a) close
to high
topography,
Y = 45
CAUTENET ET AL.' CO REDISTRIBUTION OVER CENTRAL AFRICA 30,651
I ... Flight
45
Flight
46
2ooo 15003000
...
•--•
...
2500 .. •_t-' 500 ... Savanna (11/24/96)Forest
(11/25/96)
I
3000 2500 20001500
1000 500 0 0 r f 304 306 308 310 312 314 316 318 300 305 310 315 Potential Temperature (øK) 320 Potential Temperature (øK)Aircraft measurements
Numerical results
Figure 12. Potential temperature simulated and measured near Bangui (Guinean savanna) (dashed line) and inside the forest zone (solid line).
or NPP) are performed. In both cases (savanna or forest), run A overestimates the CO concentration values, and for run B the values obtained from the method of NPP are higher (about 30%) than for CV. In savanna the modeled profile has a maximum in agreement with observation for the value, but the position is lower. For the forest zone, below 1000 m, inside the boundary layer, we have abnormally high CO concentrations (greater than 250 ppb), which shows that the complex dynam- ical situation can lead to the transport of the pyrogenie emis- sion within the forest, inside Monsoon flow. Entrainment at the top of the forest boundary layer also contributes strongly to increase the pollution in this a priori undisturbed area (C. Delon et al., unpublished manuscript, 1999). The model results show that the two maxima of CO concentration (350- 450 ppb) at 1000 m and 2500 m are due to the motion of the compounds emitted by bush fires located in the Central Afri- can Republic and in Cameroon where active fires are very important (Figure 5a).
7.2. Numerical Results
As explained above, we examine only the last two days of
each event.
7.2.1. First event. We first focus on meridian movements
(18øE). In Figure 16 we see that on November 25 (day 3, Figure 16a) the pollutants remain near surface because of the atmo- spheric stability and wind weakness in the Monsoon flow. The ITCZ acts as a dynamical barrier and precludes any southward exchange. In contrast, on November 26 (day 4, Figure 16b) the blockings have been overcome: convergences associated with the ITCZ induce a strong vertical transport, whereas a non- negligible southward horizontal transfer from savanna to forest zone is observed. As regards zonal (4øN) movements (Figure 17), we note that on November 25 the vertical exchanges were not quite zero, as a weak and narrow vertical plume exists around abscissa 300 km (Figure 17a), which corresponds to 16øE (and therefore could not be detected in Figure 16a). On
1 st event 2 nd event 200E ... Flight 45 ß savanna - 11/24/96 Flight 46' forest - 11/25/96 ... Flight 47' forest - 11/26/96 200E ... Flight 50: forest- 11/29/96 , Flight 51: savanna - 11/30/96 ... Flight 52: forest- 12/01/96 ++++ Flight 53: forest/savanna- 12/02/96
30,652 CAUTENET ET AL.: CO REDISTRIBUTION OVER CENTRAL AFRICA 0,9 0,8 altitude 0,6
0,4
! 0,3 0,20,1
4,0
o
•35
3:o
800 2800 4800 6800 8800Time
(s) Flight
47 (11/26/96)
I•-4000
•
t-2000 •k00i
1,2 1 o,8 0,4 0,2 0 800 1800 2800 3800 4800 5800 68002000
1000 -0 - 5,04,0
- 3,0 7800 Time (s)Flight 53 (12/02/96)
Figure 14. Detailed comparisons of model and observations for (top) flight 47 (over forest, November 26, 1996) and (bot- tom) flight 53 (over forest and savanna, December 2, 1996).
Solid line denotes aircraft observation of CO, dotted line de- notes modeled CO from run B, and dot-dashed line denotes
modeled CO from run A.
November 26 the vertical transport between the boundary layer and the free troposphere extends to a large fraction of grid 2, that is, +_200 km around the surface ITCZ. The trans- fers are well organized in the vertical and toward the west as well, and the associated concentrations are quite high. We note, however, that vertical transport is generally very weak except in the convergence zones due to the ITCZ or topogra- phy. We note also that the horizontal transport becomes im- portant above the boundary layer and is mainly governed by
the Harmattan flow.
At a larger scale, in grid 1 (Figures 18a and 18c), the hori-
zontal fields in CO concentration at 1100 m above surface
(upper limit of the boundary layer) exhibit very high concen- trations (maximum equal to 1020 ppb from the CV method and 1190 ppb from the NPP method) near fires (central Cam- eroon and central Africa), whereas far from fires (around 300 km), the CO concentration remains weaker, about 250-300 ppb. We conclude that in the boundary layer the maximum of CO is closely linked to maximum emission (central Cameroon) and the polluted area spreads mainly in the zonal direction. Above the boundary layer, at 2000 m (Figures 18d and 18f), the maxima are always over central Cameroon, and the CO distri-
bution is located above 3øN in latitude due to recirculations
(Figure 18e) over central Cameroon and the Central African Republic, with values around 250-350 ppb. In Figures 18e and
18f the maxima obtained from the two methods are nearly the same (570 and 630 ppb).
We note that during this event the structure of the CO plume, some peaks (maxima CO concentrations) with strong gradients in their immediate surroundings, is not qualitatively modified during the transport. This feature originates from the wind weakness at any level (Figures 18b and 18e) over the fire zone (Cameroon and east of the Central African Republic). The transfer between the boundary layer and the free tropo- sphere is not horizontally uniform. It depends on ascents as- sociated with local circulations, but in this case the plume does not spread to the south below 3øN.
7.2.2. Second event. For this event (Figure 19), on De- cember 1, even though the emissions are located in the Central African Republic or Sudan, we note that at 1100 m above the surface (Figure 19a), the plume spreads up to the equator
above the forest zone and follows the southward shift of the ITCZ. We note a maximum south of the Central African Re-
public, but no pollutant over Cameroon: The emissions are negligible in this region and the wind is oriented southward (Figure 19d). At 2000 m (Figure 19a) the CO plume has the same pattern as at 1100 m. On December 2 (Figure 19c), the plume spreads over all of central Africa. The wind fields (Fig- ures 19e and 19 0 have the same pattern at both levels. They bring out pollutants from far away from the equator to the Southern Hemisphere.
8. Discussion
The EXPRESSO campaign raised many questions about the
CO concentration. Let us limit these to two "abnormal" fea-
tures. First, high concentrations (greater than 250 ppb) in the forest zone have been observed (a value which is much greater than expected). Second, inside the boundary layer, there are very small differences in CO concentration between forest and Guinean savanna regions even though the latter would be more polluted than the former. A tentative explanation of both phenomena could be the following. In central Africa the bio- mass burns at the beginning of the dry season. During this period the surface ITCZ is either high in latitude (7ø-8øN) as for the first event, or lower (4ø-6øN) as for the second event. The emission maps (Figures 5a and 5b) point out that many fires are located inside the Monsoon flow, below 8øN as for the
first event or even below 6øN as for the second event. Hence
many burnt areas are located in Guinean savanna, within the Monsoon flow. The gases emitted in these zones move slowly toward the southern forest zone and stay near ground. They may be lifted when local circulations result in convergence zones (Figures 11, 16, and 17), so that the transfer between the boundary layer and the free troposphere is not systematic. Consequently, the emitted gases are only partly transferred to the Harmattan flow above boundary layer. Then, the forest region is polluted (Figure 16) by the gases which stay near ground, and by entrainment processes which reinject the pol- lutants from the free troposphere into the forest boundary layer. Above the boundary layer an effective transport of the pollutants is possible, and they can cover a very long distance up to the Southern Hemisphere (Figures 19b and 19c). Cros et al. [1992] report observations over Congo of ozone plumes originating from central Africa fires.
The ITCZ cannot completely block the transport of pollut- ants toward the south, because its surface line is continuously moving (Figures 7 and 8) and fires may be found in Monsoon
CAUTENET ET AL.: CO REDISTRIBUTION OVER CENTRAL AFRICA 30,653
Aircraft measurement
3500 ... 3000 2500 2000 1500 1000 500 I' I I 150 250 350 450CO profile (ppb) - Savanna zone.
3000 2500 2000 1500
Aircraft measurement
3500 .1000
500 '" i I 1;0 250 350 450CO profile (ppb) - Forest zone.
3.5
erical results
ß 3.0 2.5 2.0 1.5 1.0 0.5ß ' I
100'2 ' '"700
'CO profile (ppbv) - Savanna zone
Numerical results
3.5 3.0 2.5 2.0 1.5 1.0 0.5 /) . / ...-" / ./' 200' 300'400 ' 500t 600 J 700' 800'CO profile (ppbv) - Forest zone
(a) (b)
Figure 15. CO concentration profiles measured near Bangui (Guinean savanna) from flight 45 and in forest from flight 46. CO concentration profiles simulated are as follows: solid line denotes profiles from run A, dotted line denotes profiles from run B and the NPP method, and dashed line denotes profiles from run B and
the CV method.
Meridian section of CO (ppb) on grid 2
ß
cC52>
(a)
il, fillit , , i ,-400 200 y gm)
200 400
11/25/96 - t=l 2UTC 4.0' 2.0- 1.0- .0M• •ridian section of CO •,ppb) on grid 2
i,,, ... ,,,,,,,,, ... , ... ,,,,•,1•,,,,,,, .... -400. -200. O. 200. 400.
y (km) 11/26/96 - t =12UTC
(b)
Figure 16. Vertical cross section of meridian CO concentration from run B and the CV method, at the middle of the grid 2 on (a) November 25 and (b) November 26, 1996.
30,654 CAUTENET ET AL.: CO REDISTRIBUTION OVER CENTRAL AFRICA
Zonal section
of CO (ppb) on the grid 2
4.0
3.0
••..._
2.0 1.0.0
...
...
... e'06":
...
x (kin) 11/25/96 - t=12 UTCZonal section
of CO (ppb) on the grid 2
4.0 2.0 1.0 .0 0" ... •01 ... ;•'601 ... 6•0( ... •0'i .... x (km) l l/26/96 - t =l 2 UTC
(a)
(b)
Figure 17. Vertical cross section of zonal CO concentration from run B and the CV method, at the middle of the grid 2 on (a) November 25 and (b) November 26, 1996.
flow, in Guinean savanna, or even forest regions. The synoptic meteorology conditions are different from these of west Africa where the ITCZ is a barrier for the transfer of biomass burning compounds [Edy and Cautenet, 1998].
Moreover, we can mention that high CO concentrations (2 ppm) have been modeled near fires; these values are realistic, because they are confirmed by measurements during the SA- FARI campaign [Le Canut et al., 1996].
Our main aim was to test the capability of the mesoscale model coupled with a CO emission module to retrieve the
fields of redistributed CO. To evaluate the surface fluxes emit-
ted by fires, we first estimate the biomaterial cover from either of two independent methods, which we have named CV and
NPP. Next, the CO fluxes are calculated from (1). Use of this equation in the model leads to a good order of magnitude in
CO concentration after calibration of the constant a. Under
this condition the comparisons show that the numerical results from run B and the aircraft measurements are in relatively good agreement for two tracks (Figure 14) and for two profiles (Figure 15). The global shapes of modeled vertical CO profiles are quite similar to experimental ones (agreement for the maxima and minima), and the numerical values fit fairly well (within an error range of about 30%). On the other hand, in view of these uncertainties, it is not possible to decide which of the two methods for biomass assessment, CV or NPP, is the best, because they differ by 30% in vegetation cover. Never-
co
concentration
(ppb)
from...CV
Wind
vector
CO
concentration
(ppb)
from
NPP
(a)
(b)
(c)
Z=l100m- 11/25/96- t=-12 H T.U. Z=l100m _ 11/25/96-t=12 H T.U. Z=l100m - 11/25/96- t=12 HT.U.
Maximum
Value:
1020
ppb
Maximum
Value:
10.7
m/s
Maximum
Value:
1190
ppb
CO c0nceptration (ppb) from CV (d) Z=2000m - 11/25/96 - t=12 H T.U. Maximum Value:570 ppb (e) Wind vector •-' . ,• • i •'• • ' ,"i: ' '""'.:" .',-..•4-.•.?• Z=2000m - 11/25/96 - t 2•15'ff M•im• Value:7.4 •s CO concentration (ppb) fi'om NPP
...
&.,?,
.;
Z=2000m - 11/25/96 - t=12 H T.U. Maximum Value:630 ppbFigure 18. Horizontal cross section of CO concentration from the CV and NPP methods, and winds at 1100 and 2000 m in grid 1 for the first event.