HAL Id: hal-03026483
https://hal.archives-ouvertes.fr/hal-03026483
Submitted on 26 Nov 2020
HAL is a multi-disciplinary open access
archive for the deposit and dissemination of
sci-entific research documents, whether they are
pub-lished or not. The documents may come from
teaching and research institutions in France or
abroad, or from public or private research centers.
L’archive ouverte pluridisciplinaire HAL, est
destinée au dépôt et à la diffusion de documents
scientifiques de niveau recherche, publiés ou non,
émanant des établissements d’enseignement et de
recherche français ou étrangers, des laboratoires
publics ou privés.
Biogenic volatile organic compound emissions in central
Africa during the Experiment for the Regional Sources
and Sinks of Oxidants (EXPRESSO) biomass burning
season
J Greenberg, A Guenther, S Madronich, W Baugh, A Druilhet, R Delmas, C
Delon
To cite this version:
J Greenberg, A Guenther, S Madronich, W Baugh, A Druilhet, et al.. Biogenic volatile organic
compound emissions in central Africa during the Experiment for the Regional Sources and Sinks of
Oxidants (EXPRESSO) biomass burning season. Journal of Geophysical Research: Atmospheres,
American Geophysical Union, 1999. �hal-03026483�
JOURNAL OF GEOPHYSICAL RESEARCH, VOL. 104, NO. D23, PAGES 30,659-30,671, DECEMBER 20, 1999
Biogenic volatile organic compound emissions
in central Africa
during the Experiment for the Regional Sources and Sinks of
Oxidants (EXPRESSO) biomass burning season
J.P. Greenberg,
A.B. Guenther, S. Madronich, and W. Baugh
National Center for Atmospheric Research, Boulder, Colorado
P. Ginoux
NASA Goddard Space Flight Center, Greenbelt, Maryland
A. Druilhet, R. Delmas, and C. Delon
Laboratoire d'Aerologie, Toulouse, France
Abstract. The recent aircraft and ground-based
Experiment
for the Regional Sources
and Sinks
of Oxidants (EXPRESSO) campaign
in central Africa studied
atmospheric
trace gases
and
aerosols
during the biomass
burning season.
Isoprene,
emitted from vegetation,
was the most
abundant
nonmethane
hydrocarbon
observed
over the forest and savanna,
even though intense
biomass
burning activity was occurring
several
hundred
kilometers
to the north. The isoprene
flux, measured
directly from midmorning
to noon by a relaxed eddy accumulation
technique,
was
approximately
890 gg isoprene
m
-2
h -• from
the
tropical
rain
forest
and
semideciduous
forest
landscapes
and
570 gg isoprene
m
-2
h -• from
transitional
and
degraded
woodland
landscapes.
Model estimates
derived from satellite landscape
characterization
coupled with leaf enclosure
emission
measurements
conducted
during EXPRESSO compared
well with these measured
fluxes. Isoprene concentrations and fluxes were used to determine the oxidant balance over the
forest and savanna.
Radiative transfer
calculations
indicate that the observed
strong
vertical
gradient
of the NO2 photolysis
rate coefficient
could be explained
by the presence
of substantial
amounts of absorbing aerosols, probably from biomass burning. Chemical (box) model
simulations
of the planetary
boundary
layer (PBL), constrained
by measured
isoprene
emission
fluxes and concentrations,
show that this suppression
of photolyric
radiation lowers OH
concentrations
by about a factor of 2 relative to aerosol-free
conditions.
Consequently,
the direct
contribution
of PBL photochemistry
to ozone production,
especially
from biogenic isoprene,
is
small.1. Introduction
The tropics contain 40% of the global land area and account for about 60% of the global annual net primary productivity [Rodin et al., 1975]. The diversity of vegetation species in the tropics is far greater than that found at other latitudes. Tropical forest and savanna landscapes, however, are being converted to agricultural uses and pastures at about 1% per year. Biomass burning in the tropics (largely by humans) is primarily responsible for this conversion and has been shown to exert a dominant influence on the ecology and the atmospheric chemistry of most of the tropics [Crutzen and Andreae, 1990]. Biomass burning releases huge amounts of CO, nonmethane hydrocarbons (NMHCs), NOx, etc. Satellite observations over 5 years indicate that 70% of all biomass burning occurs in tropical areas, half of that in Africa [Dwyer et al., 1998]. The seasonality of African climate results in different burning periods for northern and
Copyright 1999 by the American Geophysical Union. Paper number 1999JD900475.
0148-0227/99/1999JD900475509.00
southern Africa, with, on average, more burning occurring
annually north of the equator [Hao and Liu, 1994].
The biosphere in tropical savannas and forests also releases large quantities of hydrocarbons [Guenther et al., 1995; Brasseur
et al., 1999]. Considerable effort has been devoted to characterizing biogenic hydrocarbon emissions in the temperate
regions of North America and Europe, with a good deal of
success. However, the extremely high species diversity in poorly
characterized tropical landscapes, as well as few measurements of biogenic emissions in tropical regions [Zimmerman et al., 1988;
Guenther et al., 1996; Klinger et al., 1998], has resulted in
highly uncertain estimates for biogenic emissions in the tropics.
Emissions from biomass burning and the products of their
photochemistry have been shown to reach the tropical forest
[Andreae et al., 1992; Cachier and Ducret, 1991]. Chemical interactions of biomass burning and biogenic emissions north of
the equator in Africa are potentially large and may lead to
enhanced levels of 03 in the lower atmosphere [Lopez et al.,
1992]. In particular, at the Intertropical Convergence Zone (ITCZ), air (polluted with biomass burning emissions) from the
savanna to the north may potentially mix with relatively clean air
(with strong biosphere emission influence) from forests and
CAR
EQUATOR
..
ROC
RH%
Plate l(a). Relative humidity (RH) gradient and (b) winds near the surface (950 mbar) in the EXPRESSO region
of the Central African Republic {CAR) and the Republic of Congo (ROC) on November 29, 1996, showing the ITCZ and the extensive mixing between monsoon (Southern Hemisphere) and Harmattan (Northern Hemisphere) airflow. A similar scenario existed over the EXPRESSO experimental period. RH and winds are produced from
GREENBERG ET AL.: BIOGENIC VOC EMISSIONS IN CENTRAL AFRICA 30,661 savanna-forest mosaics, coming in from the south. In addition,
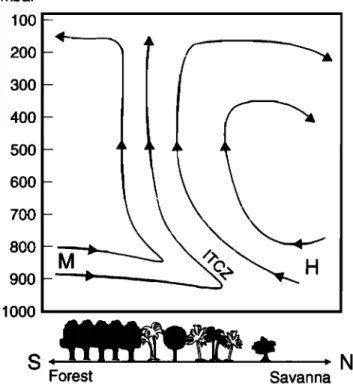
mass flow from the Hadley circulation may lift the converging air through the troposphere, up to 100-200 mbar, where this mixture may also be transported over long distances (Figure 1). The continuing chemical reaction of biomass burning and biogenic trace gases emitted into this circulation may, therefore, have long-range consequences.
The Experiment for the Regional Sources and Sinks of Oxidants (EXPRESSO) investigated processes controlling chemical composition of the tropical troposphere above central AI¾ica and their potential impact on the global atmosphere. The study area of the campaign was in the region of the ITCZ, from the savannas of the Central African Republic (CAR) to the tropical forests of the Republic of the Congo (Congo). Aircraft experiments (November and December 1996) were designed to determine the contributions of biomass burning and biogenic emissions to the chemistry above central African forest and savanna landscapes. These flights originated in Bangui, the
capital of CAR (4ø24'N 18ø31'E). This paper characterizes the
numerous nonmethane hydrocarbons (NMHCs) from fires and the biosphere and relaxed eddy accumulation (REA) direct flux measurements of isoprene from savanna and forest landscapes. Chemistry of biomass burning and biogenic emissions in the boundary layer is presented, incorporating the results of other measurements (03, NO, NOx, J•4o2, CO, and a suite of aerosol measurements, etc.) made during the EXPRESSO aircraft campaign by other investigators. The net production of 03 in the boundary layer over forest and savanna landscapes is estimated. A complete overview of EXPRESSO is presented by Delmas et
al. [this issue].
mbar IO0 2OO 3OO 4OO 5OO 6OO 7OO 8OO 9OO IOO0
S--
N
Forest SavannaFigure 1. Schematic of the general atmospheric dynamics in central Africa, depicting the Intertropical Convergence Zone
(ITCZ), monsoon flow (M) and Harmattan flow (H) in the
EXPRESSO region.
2. Experimental Details
2. 1. Experimental Region
The EXPRESSO aircraft measurements in the CAR and
Congo were made in the vicinity of the ITCZ. Here, the monsoon layer of moist, southwesterly air, originating over the South Atlantic and passing over the tropical rain forest, is overridden by a dry, northeasterly Harmattan flow from the arid areas of northern Africa (Figure 1). At the ITCZ the monsoon layer is several hundred meters thick. In September the ITCZ reaches its
northernmost position (20øN). For the northern part of the Congo
and southern CAR, this corresponds to the peak of the wet
season. In October the ITCZ moves southward, toward its
southernmost position (8øN) in January. The main dry season for
the EXPRESSO area occurs from December to February, when the ITCZ is located near its southernmost position.
The amount of annual rainfall and the length of the dry period determine the type of vegetation. Rainfall is maximal and most evenly distributed from 4øS to 4øN; the region is dominated by tropical evergreen, seasonal, and edaphic torest. To the north, annual raintall progressively decreases and the duration and intensity of the dry season increase; largely evergreen forest gradually gives way to forest with a larger deciduous component, then to woodland and dry savanna. Much of the transition between forest and savanna was formerly continuous rain forest. The savanna woodlands are particularly influenced by human activity, with large areas burned each year during the dry season.
During the November-December 1996 EXPRESSO experiment, evidence of significant mixing between the monsoon and Harmattan layers was observed. A relative humidity gradient (30-40% in the northern CAR and 80-90% in the Congo)
extended over 400 km through the study area. Plates l a and lb show the relative humidity gradient and surface winds in the region during this period. Biomass burning activity, monitored by satellite, varied during the course of the November-December experiment (P. A. Brivio et al., unpublished manuscript, 1999). More intense burning activity, which potentially impacted the study region, occurred toward the beginning of the experiment, but was usually more than 400 km distant (Cameroon, Chad, Sudan, Zaire). Fires closer to Bangui occurred less frequently and were generally not as intense. Using Bangui as the endpoint, 4- day trajectory analyses at 850 mbar were northerly (originating in southern Sudan and Chad), while 500-mbar trajectories were generally from distant areas in northern and western Africa
[Delmas et al., this issue].
2.2 Sampling of Volatile Organic Compounds (VOCs)
2.2.1. Sample collection. Air samples were collected onto solid adsorbent cartridges for the characterization of VOCs in the study region. The cartridges were a three-stage combination
(from
weakest
to strongest
adsorbent)
of glass
beads,
Carbotrap
©,
and
Carbosieve
S-Ill © (sold
under
tradename
Carbotrap
200
© by
Supelco, Inc., Bellefonte, Pennsylvania). This formulation was suitable for the determination of NMHCs in the C3 - C•2 mass
range. At aircraft collection temperatures (25ø-35øC), the
retention volume of propane and propene may have been exceeded, so that their concentrations reported here may be as much as 20% higher in some cases.
Cartridges were stored at approximately-30øC before and
after flights, except during transport to and from the Central African Republic. During transport the cartridges were kept in an
Samples were analyzed by gas chromatography with flame ionization and atomic emission detectors for quantitation and mass spectrometry for peak identifications. Details of the analytical procedures and techniques have been presented earlier [Greenberg et al., 1994, 1996, 1999].
2.2.2. Whole air sampling. Samples were collected by an automated cartridge collection system. Eight cartridges were installed onto the system immediately before flights and removed immediately after flights. Cartridges were isolated on the sampler until the time of sampling. Samples flows were set at 300 mL
min
-• by a mass
flow controller.
All tubing
routing
sample
air to
the cartridge was stainless steel and was heated to approximately
70øC. The sampling sequence was commenced manually when
the aircraft entered the research areas. Sample flows were recorded continuously, and the cartridge sampling sequence was controlled by a minicomputer/data logger. Seven cartridges were sampled during the flight; the eighth was used as a system blank for each flight. Typical sample volumes for the whole air samples were 3 to 4.5 L.
A separate system was used for the relaxed eddy accumulation (REA) flux measurements. The REA technique
segregates air in upward or downward moving eddies into
separate reservoirs; the air in the reservoirs is later sampled to determine the concentration of trace gases. The flux of the trace gas is computed from the difference in the concentration between
the two reservoirs, the variance of the vertical wind about the
mean value, and a constant associated with atmospheric stability. The REA system has been described separately (C. Delon et al, unpublished manuscript, 1999); parameters of REA sampling, including up and down eddy sample switching frequency (10 Hz), vertical velocity threshold (0. low ), sampling time lag (0.1 s), low-lYequency vertical wind filter (0.02 Hz), etc., were assigned from simulations and empirical data.
A gust probe installed on the boom of the aircraft measured fast vertical and horizontal winds. True vertical wind speed was computed by subtracting the vertical motion of the aircraft, measured by the inertial navigation system, from that measured by the gust probe. Air was continuously pumped at a constant
flow rate from an inlet on the boom and the flow was diverted to
up or down eddy sampling lines, which led to the REA bag
collection system inside the aircraft, or to a vent position when there was no sampling. The REA collection system consisted of
up and
down
eddy
Tedlar
© bags
and
a pumping
system
used
to
evacuate the bags between samples. REA samples were collected over a constant altitude path length of approximately 30 km; the sampling distance was sufficient to sample the spectrum of eddies observed in the boundary layer [Lenschow, 1975]. After sample collection, CO2 from each bag was measured in situ and VOCs samples (approximately 900 mL) were collected from the up and down eddy reservoirs. Samples were collected onto Carbotrap
200
© solid adsorbent
cartridges
(described
above).
Up to five
REA sample pairs were collected on each flight. At least one unsampled cartridge pair on each flight was used for analytical blanks.
2.2.3. Locations of sample collection. Whole air and REA samples were collected over the CAR and the Congo during nine flights between November 24 and December 2, 1996. Flight altitudes ranged from approximately 100 m to 4000 m above ground level. Three flights focused over transitional woodland/savanna areas (two near Boali, 4.5øN, 18øE) and another four flights over the tropical forest (three near Enyele, 3øN, 18øE). One flight flew south over the forest-savanna
interface; another flew north over the savanna, toward the
biomass burning in northeastern CAR and southern Sudan. An additional flight flew south to the region near Bomassa, Congo, where a 65-m walkup tower was constructed for the EXPRESSO experiment (D. Serca et al., unpublished manuscript, 1999).
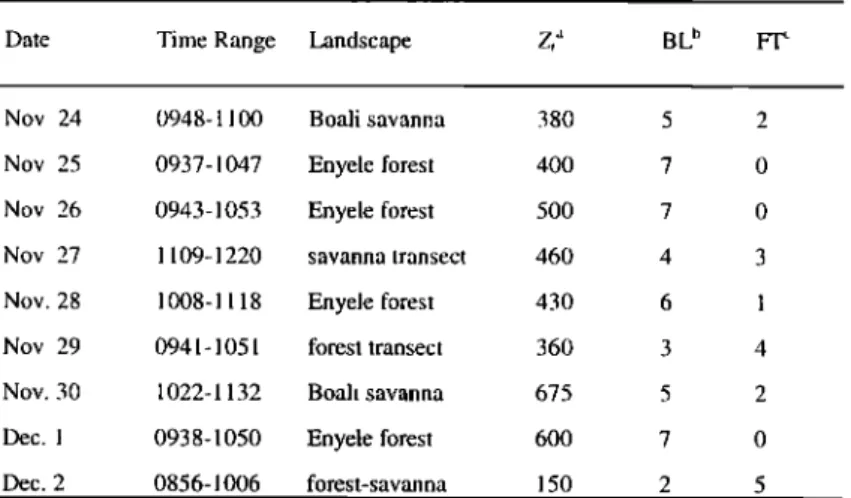
Whole air sample collection was over 10-15 min, so that the concentrations were integrated over a large spatial extent (50-100 km). There was no large-scale burning in the aircraft study area. Most flights took place during the morning (0930 to 1200 local time), in order to avoid afternoon thunderstorm activity. Flight parameters are given in Table 1.
Most REA flux samples were collected over a 30 km x 30 km expanse of transitional (degraded) woodland (12 flux measurements) near Boali in the CAR and a larger plot over the tropical lorest (nine flux measurements) near Enyele in the northernmost part of the Congo (Plate 2). An additional eight measurements were made over other forest and woodland areas within 250 km of Bangui.
Table 1. EXPRESSO Aircraft Flight Details
Date Time Range Landscape Zt a BL b
Nov. 24 0948-1100 Boali savanna
Nov. 25 0937-1047 Enyele forest Nov. 26 0943-1053 Enyele forest
Nov. 27 1109-1220 savanna transec!
Nov. 28 1008-1118 Enyele forest
Nov. 29 0941 - 1051 forest transect Nov. 30 1022-1132 Boali savanna
Dec. I 0938-1050 Enyele forest
Dec. 2 0856-1006 forest-savanna 380 400 500 460 430 360 675 600 150
aAverage height of boundary layer during flight.
bNumber
of boundary
layer
samples.
GREENBERG ET AL.' BIOGENIC VOC EMISSIONS IN CENTRAL AFRICA 30,663
2.3. Atmospheric Chemistry Model.
A zero-dimensional (0-D or box) photochemical model was
used to examine the chemical interaction of fire emission
products,
VOCs, and biogenic
isoprene
in the boundary
layer
over the forest and savanna. The chemical mechanism consisted
of about 3340 gas phase reactions among approximately, 1250 explicit species, as described by Madronich and Calvert [1990]
and updated
by Aumont et al. [1999]. Photolysis
rates were
calculated with the tropospheric ultraviolet-visible (TUV) model
[Madronich and Flocke, 1998] for late November, 0.5 km above
a surface of 5% albedo, and climatological total 03 column of
260 Dobson
units (DU, equal to 2.69x10
•9 molecules
cm-2).
Absorption and scattering by aerosols was considered (see
below). Time integration
of the chemical
rate equations
was
started at midnight with the initial conditions given in Table 2 and was carried out for 2 days, the first of which is considered as a model spin-up period, with results (see below) reported from
the second day.
The height of the planetary boundary layer (PBL) was taken as 0.1 km at night, growing linearly to 1.0 km (savanna) or 0.7
km (forest)
between
0800 (local time) and 1400; remaining
at
this maximum
value
until 1600; then decreasing
linearly
to reach
again the nighttime value at 1800. During the growth of the PBL
(0800-1400),
the rate of entrainment
of air which
in the previous
time step was just above the PBL is represented as a first-order
source
or sink for chemical
species
in the PBL, for example,
for
species x,
(dXpBL/dt)entrainmen
t = - Kentrainmen
t (XpBL-
Xbg
)
where
XpBL
is the concentration
of the species
in the PBL, and
Xbx is the concentration
above the PBL (free tropospheric
background).
The first-order
rate constant
Kentramment
is estimated
from
the rate
of growth
of the PBL height
as 6.4x10
's s
-• (forest)
and
1.1x10
-4 s
-• (savanna)
during
0800-1400,
and
is zero
at all
other
times.
Values
of Xbx
were
assumed
constant
with time,
and
were set to zero for all VOCs (corresponding to simple dilution of PBL air), except for those listed in Table 2, for which measurements above the PBL were available from aircraft/lights
during EXPRESSO; otherwise, a reasonable
climatological
estimate was made.
Emissions of isoprene and NO were included and were assumed to be time dependent. For isoprene, emissions (from REA flux measurements) were taken as zero at night (1800 to
0600),
increasing
linearly
to 700 gg C m
'2 h -• (savanna)
or 1200
gg C m
'2 h '• (forest)
(see
below),
remaining
at this level until
1600, and then decreasing linearly to 1800. For NO a similar time dependence was assumed, but from a minimum nighttime value of 10 s molecules cm -2 s -• to a maximum of 106 molecules
cm
'2 s
'l, corresponding
approximately
to the middle
of the values
considered by Lopez et al. [1992]. Deposition of reactive species was parameterized using the resistance-in-series method of
Wesely
[1989],
with
maximum
deposition
velocity
of 3 cm s
-• for
radicals and HNO3 (zero surface resistance). For nonradical organics, surface resistance was estimated based on reactive moieties (e.g., aldehyde or alcohol groups). In the 0-D model, surface emissions and surface deposition velocities were transformed into effective zero-order and first-order rate constants (respectively) into the PBL volume, and thus were scaled with the inverse of the PBL height.
3. Results and Discussion
3.1. VOC Concentrations
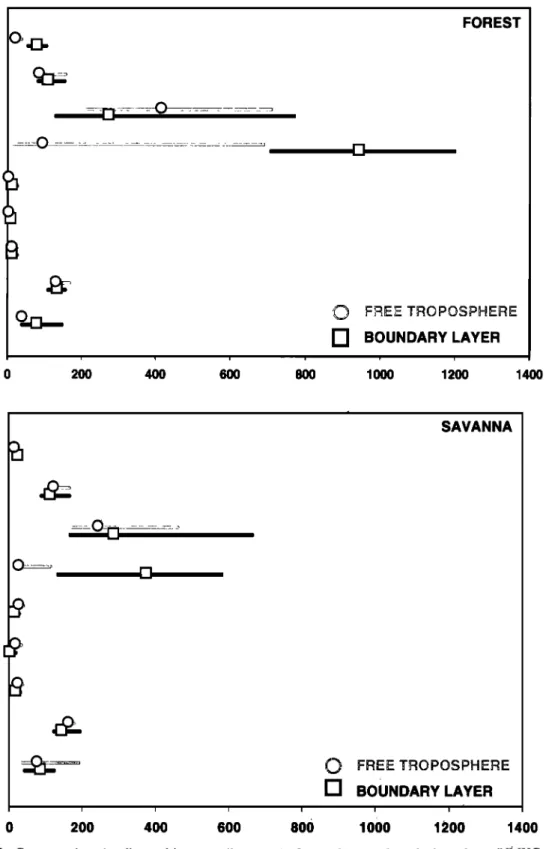
Median (and interquartile range) mixing ratios over the various landscapes are shown in Figure 2. Median values are reported, since observations are not normally distributed; interquartile ranges include the central 50% of the measured mixing ratios. For most NMHCs, except those which are
primarily biogenic emissions (isoprene and c½~pinene), the mixing
ratios are slightly higher over the savanna than over the forest. Except tbr biogenic emissions, the differences in the concentrations of most NMHCs in the boundary layer and free troposphere over each region were small. Isoprene and •~pinene are much higher 'in the boundary layer over the forest than over the savanna.
The scale and extent of mixing, indicated by the relative humidity gradient (Plate l a), were also shown by the mixing
ratios of VOCs (Figure 2) and CO [Delmas et al., this issue]
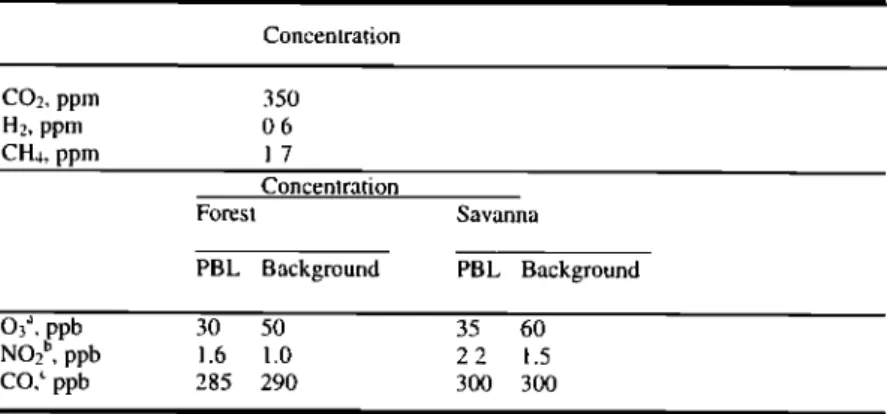
Table 2. Initial Conditions and Background (Free Troposphere) Concentrations
Species for Zero-Dimensional Model Simulations
Concentration CO2, ppm 350 H2, ppm 0.6 CH4, ppm 1.7 Concentration Forest Savanna PBL Background PBL Background O3:', ppb NO2 b, ppb CO, • ppb 3O 50 35 60 1.6 1.0 2.2 1.5 285 290 300 300
For H20, relative humidity is 50%. For nonmethane hydrocarbons, values are from
Figure 2.
:'B. Cros et al. (unpublished mansucript,'1999).
t•T.
Marion
and
P. Perros
(unpublished
manuscript,
1999).
GREENBERG
ET AL.: BIOGENIC
VOC EMISSIONS
IN CENTRAL
AFRICA
30,665
! , [ 200 400 600 800 , El , FOREST ?•E: TRQ'•QS?H •- BOUNDARY LAYER ! i 1000 1200 1400 SAVANNA E3 BOUNDARY LAYER , , i i i i i i 0 200 400 600 800 1000 1200 1400Figure 2. Concentrations
(median
and interquartile
ranges)
of several
nonmethane
hydrocarbons
(NMHCs)
in the
boundary layer and free troposphere over the forest and transitional woodlands. Isoprene was the most abundant NMHC, despite extensive biomass burning activity several hundreds of kilometers upwind of the study region.
measured during the campaign. While the median mixing ratios of nonbiogenic VOCs were lower over the forest than the woodlands, the absolute differences between average values for individual flights over woodland or forest were small. Mixing ratios in the boundary layer and the free troposphere were very similar, indicating also that there was considerable exchange
between the boundary layer and the lower free troposphere. Finally, the trends in mixing ratios of nonbiogenic VOCs and CO were similar and may indicate the same distant source (most likely biomass burning).
CO and NMHC measurements were compared (Table 3) with those made during Transport and Atmospheric Chemistry near
Table 3. Comparison of Southern African (TRACE-A) and Central African (EXPRESSO) CO and Volatile Organic Compound Concentrations
Boundary Layer a
Landcover CO, ppb C3H8, ppt C3H6 C6H6. ppt Isoprene, ppt
TRACE-A savanna 280 200 70 220 50-150 EXPRESSO woodland 300 168 90 307 100-400 EXPRESSO forest 285 126 72 267 710-1200 Free Troposphere b TRACE-A savanna 275 200 70 220 0-50 EXPRESSO woodland 300 160 64 277 10-30 EXPRESSO forest 290 143 41 193 20-300
Data for Transport and Atmospheric Chemistry near the Equator- Atlantic (TRACE-A) are from Blake et al. [1996]. EXPRESSO CO data are from C. Delon et al (unpublished manuscript, 1999).
aSurface up to approximately 1000 m near midday.
bFrom the top of the boundary layer to approximately 4 km in TRACE-A and EXPRESSO.
the Equator-Atlantic (TRACE-A) in southern Africa during its
burning season [Blake et al., 1996]. Similar mixing ratios of NMHCs and CO (and CO/NMHC ratios) were seen over the savanna in both experiments. Lower VOC mixing ratios were measured during the EXPRESSO campaign over the forest, where mixing with cleaner monsoon maritime air, as well as increased aging of the biomass burning emissions, decreased average mixing ratios.
Isoprene and tx-pinene were detected above the boundary layer (Figure 2) over the forest and the savanna (more over the forest). Blake et al. [1996] also reported isoprene concentrations of 50-150 ppt at the top of the boundary layer over the savanna; the concentrations dropped rapidly with higher altitude and were
below the detection limit above 4 km.
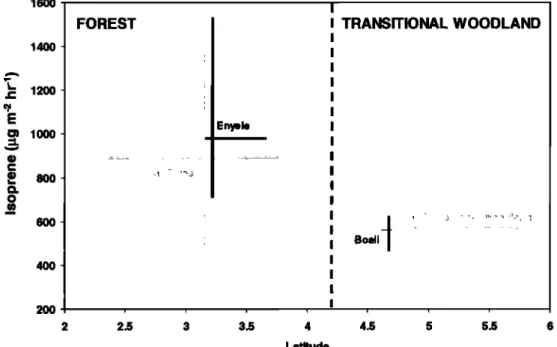
3.2. REA Isoprene Fluxes
The results of REA flux measurements over the woodland and
forest regions are displayed in Figure 3. The interquartile ranges of fluxes for forest and savanna are given, along with the
interquartile range of latitudes over which they were measured.
The median flux and latitude are at the intersection of the ranges. Medians are represented, instead of averages, since the measurements were not made to represent a normal distribution.
The REA fluxes were measured intensively over a primary and semideciduous rain forest near Enyele, Congo, and over
transitional woodland near Boali, CAR (Plate 2). Most REA
measurements were made at a height of approximately 100-200
m. Several forest REA measurements were made at
1600 1400 1200 800 6O0 4OO 200 FOREST ! 2 2.5 I • TRANSITIONAL WOODLAND I I I ; I , I I Enyel© I I I I I
I
Boali
I I I I I i I i I 3 3.5 4 4.5 5 5.5 6 LatitudeFigure 3. REA flux results. The vertical and horizontal bars represent the interquartile ranges of fluxes and
latitudes over which REA flux measurements were made (these lines intersect at the median values). Most measurements were made over the Enyele forest and the Boali savanna sites (solid black lines); additional measurements from similar landscapes were included in the forest and transitional woodland averages (shaded
GREENBERG ET AL.: BIOGENIC VOC EMISSIONS IN CENTRAL AFRICA 30,667
approximately 600 m and may be less accurate, because of greater flux divergence higher in the mixed layer. Median REA isoprene fluxes (and interquartile range) were 980 (710-1530)
and 560 (470-620)
gg m
-2 h -I for the Enyele
rain forest
and the
Boati woodland, respectively, for REA samples collected below 200 m. The Enyele lorest and the Boali woodland areas were
indistinguishable in satellite observations from their respective surrounding landscapes. Consequently, all rain forest and
transitional woodland measurements were combined, and REA
median isoprene fluxes were calculated to be 890 (480-1540) and
570 (420-720)
gg m
'2 h -l, respectively
(Figure
3).
All of the REA measurements were made in the morning,
most between 0930 and 1130. The maximum emissions for these
landscapes likely occur in early afternoon, when temperature and light effects are at maximum levels. The measured emission fluxes are not normalized to any standard conditions (i.e., 30øC
and 1000
gEm -2 s
-l of photosynthetically
active
radiation,
PAR),
since species-specific emission algorithms for the roughly characterized landscapes are not known. However, during the
November-December measurement period, average late morning
temperatures
measured
at the airport
in Bangui
were 27ø-30øC.
Clear or mostly sunny skies prevailed during the morning flight
hours,
and
PAR was
likely
greater
than
1000
gEm -2 s
-• (above
approximately
800 gEm
-2 s
-• additional
radiation
has
little effect
on increasing isoprene emissions in species previously studied
[Guenther et al., 1995]).
The tropical forest and transitional woodland, over which
REA measurements were made, are composed of several
landscapes [Guenther et al., this issue]. The forest area is categorized as semideciduous tropical forest and evergreen tropical rain forest. The transitional woodland contains primarily degraded secondary forest. These landscapes themselves,
however, may contain a number of vegetation communities. The REA flux measurements (Figure 3) are distributed over a range of values, greater over the forest areas. This range may be due, in part, to the species diversity within these landscapes. Other factors may also contribute to the measurement variability. The REA technique samples air only in eddies larger than a threshold determined by statistics of the vertical velocity measurements and by mechanical constraints (C. Delon et at., unpublished manuscript, 1999). Consequently, a portion of the transport is not accumulated into the up and down reservoirs; this amount may be estimated from measurements of sensible heat flux, is typically less than 20% of the mass transport, and is considered in the flux calculation. Flux divergence may contribute some error, but this could not be quantified. All savanna REA samples were collected at altitudes less than 200 m. Uncertainties in the chromatographic analysis of isoprene concentration difference in the two reservoirs may also contribute errors of the order of 15%. The overall uncertainty of the flux
measurements is estimated at 50% for the forest and 35% for the
transitional woodland. Fluxes of terpenes were not computed for the REA method, since their concentrations were small (Figure 2) and the precision of the measurements was not sufficient. Fluxes of ot-pinene in the morning hours were estimated from the model
simulation
(below)
at 110 and 90 gg m
-2 h -• from forest
and
woodland landscapes, respectively.
3.3. Comparison With Other Tropical VOC Flux Measurements and Estimates
Isoprene flux was measured by REA at the EXPRESSO tower in the N'doke Forest Reserve of the northern Congo (D. Serca et
al., unpublished manuscript, 1999). The tower was located within a tropical rain forest landscape. An average isoprene flux of 500
gg isoprene
m
-2 h -• was measured
above
the forest
canopy
in
November
1996.
A higher
flux (-1100 gg isoprene
m
-2 h -t ) was
measured in March 1996. The difference in the November and March fluxes may be associated with seasonal effects during the dry and wet seasons, respectively. The November tower flux is at the lower end of the range of fluxes measured by the aircraft REA. However, the aircraft fluxes were measured over a variety of rain forest landscapes (a mosaic of tropical evergreen, edaphic, and seasonal forest communities). This may also explain the relatively large range of isoprene fluxes measured over the forest landscapes in the Congo, compared to the more narrow range of fluxes measured over the transitional forest/savanna region in the CAR, where the landscapes were more uniform (Plate 2).
Isoprene
fluxes
of approximately
4000 gg isoprene
m
-2 h -I
have been reported for the a tropical evergreen rain forest in the Brazilian Amazon forest [Zimmerman et al., 1988]. The species composition of African and South American rain forests is very different. Since isoprene emissions are species specific [Guenther et al., 1995], differences in area emissions may be expected.
Guenther et al. [this issue] estimated emissions for these
transitional woodlands and forests by integrating landscape biomass density with the emission capacity (the maximum emission rate at standard conditions) and emission activity factors (light, temperature, canopy position, seasonal effects, etc., which modulate emissions) of vegetation species in the landscape. Emissions were estimated for the morning hours, when REA flux measurements were made. For times of day matching the REA
measurements, the rain forest and transitional woodland
landscapes were estimated to have isoprene emission rates of
1231
and
806 •tg m
-2 h -1.
The modeled
results
are higher
than
the
median fluxes measured in situ by REA, but are within the uncertainty or ranges reported.
3.4. PBL Chemistry
The atmospheric chemistry over the EXPRESSO region during the November-December 1996 experimental period was influenced both by biomass burning in savanna areas to the north
(P. A. Brivio et at., unpublished manuscript, 1999) and the more
local biogenic emissions from the savanna and forest areas.
Average
black
carbon
concentrations
of about
10 gg m
-3 were
measured from filter samples [Ruellan et al., this issue], which along with high average CO and condensation nuclei (250-400
ppb
and
2000-4500
particles
cm
-3, respectively,
(C. Deton
et at,
unpublished manuscript, 1999)), 03 (30-60 ppb, (B. Cros et at., unpublished manuscript, 1999) and NOx (250-400 ppb (T. Marion and P. Perros, unpublished manuscript, 1999 )) strongly suggested the influence of biomass burning and the presence of absorbing aerosols. Concentrations of NMHCs associated with biomass burning, especially the more reactive VOCs, were relatively low compared to those in young plumes, presumably because of atmospheric reactions and dilution. Biogenic isoprene was the most abundant NMHC and also the most important reactive NMHC in the EXPRESSO savanna and forest regions (Figure 2). Since biomass burning and biogenic NMHC emissions are often associated with net 03 production, the 0-D chemistry model was used to simulate the chemistry of the EXPRESSO boundary layer, focusing on photochemical oxidant chemistry in the savanna and forest environments.
Although the 0-D model has many limitations as further discussed below, the simulations demonstrate several aspects of
the photochemistry of the PBL. Perhaps the most important is the role' of absorbing aerosols in controlling, through modification of photolysis rates, the overall reactivity of the PBL. Measurements of JNo2 from aircraft (T. Marion and P. Perros, unpublished manuscript, 1999) show a marked decrease, by about a factor of 2, at the lower altitudes of the PBL, compared to free
tropospheric altitudes. This JNO2 gradient is observed even in the
absence of clouds and can most plausibly be attributed to the presence of absorbing aerosols from biomass burning. In an aerosol-free troposphere (Rayleigh scattering only) and high Sun, the vertical gradient of JNO2 would be much weaker than that observed, and scattering aerosols could even increase JNo2 at lower altitudes [Dickerson et al., 1997; Madronich and Flocke,
19981.
Figure 4 compares our calculations of JNo2 and Jo3 with and without aerosols. At high Sun, a reduction of a factor of 2 in JNo2 is attained by assuming an aerosol optical depth of about 1 at 550 nm (scaled spectrally by the inverse of wavelength), distributed vertically with the typical continental profile given by Elterman [1968], a wavelength-independent single-scattering albedo of 0.75, and an asymmetry factor of 0.61. Other choices of aerosol optical properties (not measured during the experiment) are
possible,
but insofar
as our model
ini•uts
reproduce
the observed
factor of 2 reduction in Jt,•o2, these would probably not alter our qualitative conclusions. The stronger reduction of Jo3 results from a combination of (1) the inverse wavelength scaling assumed for the aerosol optical depth and (2) the fact that photon path lengths in the UV-B region (of greater importance to Jo3) are longer, at high Sun, than in the UV-A region (of importance to JNo2) due to greater Rayleigh scattering. Our assumption of higher aerosol optical depths at shorter wavelengths is also supported by recent measurements in polluted air masses [Wenny
et al., 1998].
The impact of photolysis rate reductions on isoprene, 03, and
oH is illustrated
in Table
4. The
first
row
gives
our
more
realistic
reference case, which includes the reduction of J values by aerosols. The second row illustrates the effect of using aerosol-
free J values. In this case, noontime OH concentrations are
higher by more than a factor of 2, and isoprene concentrations fall well below the observed values. The impact of reduced
photolysis rates on ozone is more difficult to assess from Table 4, because the peak 03 concentrations in the PBL are strongly
influenced by entrainment of ozone-rich air (see below) during
the growth of the PBL. We have estimated the net photochemical production of O3 by subtracting the contributions of entrainment
and surface deposition from the simulated total rate of ozone change d[O3]/dt. For the reference case this analysis shows that
net photochemical 03 production occurs only during the central
sunlit 5-6 hours of the day, peaking at about 6 ppb/h over the
forest and 2 ppb/h over the savanna. When averaged over the
entire day and integrated over the time-dependent height of the PBL, the local net photochemical O3 production and deposition are roughly equal over the forest, while over the savanna
deposition slightly exceeds local net photochemical production.
The fact that the savanna PBL is a net ozone sink is a direct result
of the suppressed photolysis rates, in combination with the high NOx/hydrocarbon ratio observed for that environment (see
further discussion below).
A second interesting aspect of the 0-D model simulation arises from the different NO•/hydrocarbon ratios encountered in the savanna and forest boundary layers. The higher isoprene concentrations in the forest PBL lead to substantially lower OH values (see Table 4, reference case) compared to the savanna. However, the two regions have opposing sensitivities to changes in NO• concentrations. It has long been recognized [e.g., Hameed et al., 1979; Logan et al., 1981] that at low NO•hydrocarbon ratios, the further addition of NO,• leads to increases in O3 and OH, while at higher ratios both OH and O3
are suppressed. This latter situation occurs because the reaction
OH + NO2 '-) HNO3 competes against reactions of the type OH +
hydrocarbons + 02 -> RO2, where the peroxy radicals (RO2)
would ultimately contribute to 03 production. Increases in NO.• (see Table 4, third row) cause an increase in OH in the forest PBL, but decrease OH in the savanna PBL. Increases in isoprene
lead to lower OH over the savanna and much lower OH over the
forest (Table 4, fourth row). Changes in O3 concentrations are rather small because, as already discussed above, the PBL O3
levels are mostly determined by entrainment of free tropospheric
air. It is also worth noting that the threshold NOdhydrocarbon ratio (for the reversal of OH and 03 production) is lower when
4. E-05 1. E-02 3.E-05 g 2. E-05 1 .E-05 8. E-03 8 12 16 20 6 E-03 4. E-03 2.E-03 O.E+00 O.E+00
Local time, hr&
Figure
4. Photolysis
rate
coefficients
(J values)
for the reactions
03 + hv -> 02 + O(•D) (heavy
curves,
left scale)
and
NO2 + h¾ '-) NO + O(3p)
(light
curves,
right scale),
calculated
with a delta-Eddington
scheme
for November
25, 1996 (latitude 4øN, 260 Dobson units, cloud-free, 0.5 km above a surface of 5% Lambertian reflectivity). Solid curves give values for aerosol-free conditions, dashed curves for aerosol visible range of 4 km (at 550 nm) with single-scattering albedo of 0.75.
GREENBERG ET AL.: BIOGENIC VOC EMISSIONS IN CENTRAL AFRICA 30,669 Table 4. Sensitivity of Boundary Layer Photochemistry to Parameters in Zero-Dimensional Model
Savanna Forest
Case Isoprene a, ppbv O3 t' ppbv OH, • Isoprene, ppbv
10ømolecules cm -3 03, ppbv OH, 106molecules cm '3 Reference 0.2-0.8 a 53 b 4.8 • 0.9-2.0 48 Increased J• 0.1-0.2 60 12 0.3-0.5 53 Double NOx 0.3-1.0 53 4.1 0.8-2.0 51 Double isoprene 0.6-1.7 55 3.8 2.7-4.3 49 Increased J
and doubled NOa- 0.1-0.3 64 16 0.2-0.5 64 Increased J, 0.2-0.5 62 10 1.5-1.8 54 doubled Isoprene Decreased isoprene 0.2-0.9 54 4.8 0.9-2,.2 48 deposition velocity from 0.1 to 0 cm/s Increased 03 0.2-0.9 49 4.3 0.8-2.0 41 deposition velocity from 0.5 to 2 cm/s 5.5 7.5 4.2 1.6 14 3.3 3.0 3.3
aIsoprene evaluated between about 0930 am (higher value) and noon (lower value).
t'O3 maximum, occurring in early afternoon.
COH maximum, occurring near noon.
aPhotolysis increased to represent aerosol-free conditions.
photolysis rate coefficients are lower, as is the case here due to
the effects of absorbing aerosols. If J values are hypothetically increased to aerosol-free values, doubling of NO• results in strong OH increases (compare second and fifth rows of Table 4), while doubling of isoprene decreases OH (compare second and
sixth rows), in both forest and savanna PBLs. Some additional
PBL 0 3 production would also occur. Thus the reduction in J values by aerosols does not simply scale the magnitude of photochemical processing, but also changes the qualitative NOx/hydrocarbon regime of both PBLs.
A third result highlights the limitations of the 0-D model in simulating the vertical structure of PBL mixing. Diurnal variations of isoprene concentration in the PBL result from the assumed time dependence of isoprene emissions, from reactions with OH, 03, and NO3, and also from the assumed vertical variations of the PBL height. A sharp decrease of isoprene concentrations computed in the late morning is due mainly to the rapid growth of the PBL, while the sharp isoprene rise in the late afternoon is associated with emissions into a shrinking PBL volume. Since aircraft isoprene measurements (seven integrated 10-15 min samples) were made during, at most, a 75-min period during each flight, this pattern was not observed in individual flights and could not be validated from combining the data of several flights. However, the daytime pattern has been described for isoprene from tethered balloon measurements in the boundary layer [Greenberg et al., 1999]; those data indicate relatively constant isoprene concentrations in the mixed layer around midday.
The calculated PBL 03 concentrations (see Table 4, reference case) are substantially higher than those measured (see Table 2). The reason for this overestimate is related less to photochemical 03 production in the PBL than to the assumed rapid entrainment of O3-rich background air as the PBL top height rises. Any 0-D model assumes inherently that all chemical concentrations are instantly and completely mixed through the PBL. This overestimate of actual vertical mixing may be particularly serious in the presence (as already noted) of strongly absorbing aerosols which may cause complex vertical heating profiles and therefore further barriers to mixing [Raga et al., 1998]. The latter problem
may prove challenging even for multidimensional models, if detailed aerosol processes are not modeled on appropriately fine spatial scales.
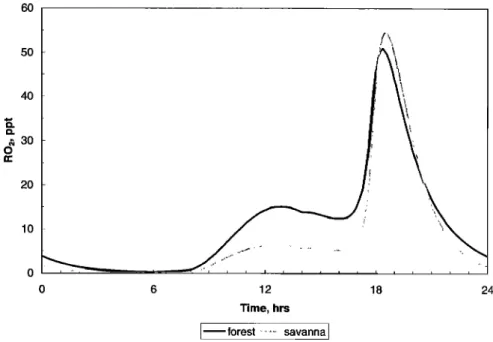
Finally, organic peroxy radicals (RO2, see Figure 5) computed by the model are highly illustrative of the overall photochemical activity in the PBL. The midday peak is associated mainly with
isoprene oxidation by the OH radicals produced under high solar
irradiation, with some contribution from the reaction of 03 with isoprene, and OH with methane and other nonmethane hydrocarbons. The large peak at dusk, which was observed in all simulations, is due to the reaction of NO3 radicals with isoprene and is enhanced by slower nighttime losses of the resulting
organic peroxy radicals (because of lower NO). The timing of this peak is highly predictable, as substantial NO3 concentrations
cannot be sustained during sunlit hours, while the available reagents (isoprene and NOx) decrease rapidly at night due to their destructive interaction, as well as reduced emissions. In separate simulations, setting the rate constant for the NO 3 + isoprene reaction to zero eliminated the dusk RO2 peak and resulted in considerably slower evening decay of isoprene concentrations. On the other hand, setting either isoprene or 03 deposition velocities to zero had only a minor effect on concentrations (see
Table 4).
In our simulations the reaction NO3 + isoprene was the main reason for the decrease in isoprene concentrations seen in the early evening hours. These losses have been previously explained
by isoprene deposition [Jacob and Wofsy, 1988; Cleveland and
Yavitt, 1997]. More recently, the nighttime isoprene loss has also been attributed to its reaction with NO3 radicals in high-NOx and high-O3 environments [Starn et al., 1998].
4. Summary and Conclusions
The EXPRESSO experiment focused on the atmospheric chemistry over the woodlands and forests of the Central African Republic and the Republic of the Congo during the biomass burning season. Burning activity was intense in areas influencing the region, as seen from satellite fire observations. The most intense burning activity, however, was several hundred
60 50 40 • :30 0 20 10 0 6 12 Time, hrs
forest
...
savanna
]
18 24Figure 5. Concentrations of organic peroxy radicals (RO2) computed with the zero-dimensional model (reference
case of Table 4).
kilometers from the area of the aircraft measurements. NOx, NO,., and CO, and as well as aerosols, were observed at high levels
characteristic of burning. Nonmethane hydrocarbons, except for isoprene, however, were at low concentrations (measured from
100 to 4000 m above the surface), which suggested that the air studied in the EXPRESSO region was a well-aged biomass
burning plume. The concentrations of many of these gases and aerosols were expected to increase in the EXPRESSO region as the burning activity moved further south with the dry season.
Local biogenic emissions of isoprene provided the dominant reactive hydrocarbon in the atmospheric boundary layer in both
the forest and woodland (savanna) regions studied (700-1000 and
100-400 ppt, respectively). The PBL concentration of ct-pinene,
another emission from vegetation, was in the range of 30-100 and
20-30 ppt over the same landscapes. Isoprene fluxes from the forest and woodland landscapes were measured directly aboard
the aircraft by a relaxed eddy accumulation technique. Isoprene
emissions
were
890 and
570 pg m
-2 h -• from
forest
and
woodland
landscapes, respectively, in the morning hours; these emissions
correspond
to daily
emissions
of 10.6
and
6.5 mg isoprene
m
-2
d -l, for forest
and woodland
landscapes,
respectively.
The daily
isoprene flux from the forest was more than a factor of 2 lower than reported for the Amazon tropical forest, also at the beginning of the burning season [Zimmerman et al., 1988]. These
emissions, as well as ambient isoprene concentrations, may
change seasonally, depending on the phenology of individual emitting species. The flux of isoprene measured during the wet
season at the EXPRESSO tower in the northern Congo was
approximately 2 times that measured in November at the
beginning of the dry (burning) season.
The aircraft measurements were used in a 0-D simulation of
the chemistry. The simulation used measured isoprene emission
fluxes to reproduce measured ambient isoprene concentrations. The photolysis rates measured during the campaign were consistent with significant aerosol UV radiation absorption, so that JNO2 and Jo3 were reduced to approximately one half of clear sky values. Lower photolysis rates influenced the resulting
photochemistry. Both 03 production and OH concentrations were
reduced in the PBL compared to clear sky conditions. The forest and savanna regions had different sensitivities to changes in NOs, so that the NOdhydrocarbon ratios from increased emissions of NO• or isoprene had different effects on 03 production and OH concentrations. While net 03 production in the boundary layer (the domain of the simulation) was small, extensive mixing between the monsoon (boundary) and Harmattan (free troposphere) layers could enhance large-scale 03 production, because of the export of precursors including unreacted hydrocarbons and partly oxygenated and nitrogenated intermediates. This net 03 production has not been reported from satellite observations, possibly because of the rapid dilution effects in the Hadley and Walker circulation near the ITCZ (the region studied). This contrasts with the results from the Southern African Fire-Atmosphere Research Initiative (SAFARI)-TRACE- A experiment, where meteorological conditions recirculate air over southern Africa during the dry season, allowing for the observed high concentrations of 03 to be produced over southern Africa.
The model simulation also indicated the importance of NO3 chemistry in the rapid destruction of isoprene in the hours immediately surrounding sunset. This phenomenon has been observed in high-NO• and high-O3 environments, where isoprene concentrations decline rapidly after sunset to a few percent of daytime concentrations. The disappearance of isoprene at sunset is also accompanied in the simulation by a large production of organic peroxy radicals (RO2) derived from isoprene oxidation. The predictable timing and high peak RO2 concentration make it a good candidate for detection, which, however, to our knowledge has not been reported.
Acknowledgments. We thank P.R. Zimmerman for his contributions to the development of the EXPRESSO program. We also wish to thank the Institut Gfiographique National and the Institut National des Sciences de 1' Univers, who organized and executed the operation of ARAT during the EXPRESSO campaign. The National Center for Atmospheric Research is sponsored by the National Science Foundation.
GREENBERG ET AL.: BIOGENIC VOC EMISSIONS IN CENTRAL AFRICA 30,671
References
Andreae, M.O., A. Chapuis, B. Cros, J. Fontan, G. Helas, C. Justice, Y.J. Kaufman, A. Minga, and D. Nganga, Ozone and Aitken nuclei over equatorial Africa: Airborne observations during DECAFE 88, J. Geophys. Res., 97, 6137-6148, 1992.
Aumont, B., S. Madronich, M. Ammann, E. Baltensperger, D. Hauglustaine, and F. Brocheton, On the NO2 + soot reaction in the atmosphere, J. Geophys. Res., 104, 1729-1736, 1999.
Blake, N.J., D.R. Blake, B.C. Sive, T.-Y. Chen, and F.S. Rowland,
Biomass burning emissions and vertical distribution of atmospheric methyl halides and other educed carbon gases in the South Atlantic region, J. Geophys. Res., 101, 24,151-24,164, 1996.
Brasseur, G., E. Atlas, D. Erickson, A. Fried, J. Greenberg, A. Guenther, P. Harley, E. Holland, L. Klinger, B. Ridley, and G. Tyndall, Trace gas exchanges and biogeochemical cycles, in Atmospheric Chemistry and Global Change, edited by G. Brasseur, J. Orlando, and G. Tyndall, pp. 189-242, Oxford Univ. Press, New York, 1999.
Cachier, H., and J. Drucet, Influence of biomass burning on equatorial
African rain, Nature, 352, 228-230, 1991.
Cleveland, C.C., and J.B. Yavitt, Consumption of atmospheric isoprene in soil, Geophys. Res. Len. 24, 2379-2382, 1997.
Crutzen, P.J., and M.O. Andeae, Biomass burning in the tropics: Impact on atmospheric chemistry and biogeochemical cycles, Science, 250,
1669-1678, 1990.
Delmas, et al., R.A, Experiment for Regional Sources and Sinks of Oxidants (EXPRESSO): An overview, J. Geophys. Res., this issue. Dickerson, R. R., S. Kondragunta, G. Stencikov, K. L. Civerolo, B. G.
Doddridge, and B. N. Holben, The impact of aerosols on solar ultraviolet radiation and photochemical smog, Science, 278, 827-830,
1997.
Dwyer, E., J.-M. Gregoire, and J.-P. Malingreau, A global analysis of vegetation fires using satellite images: Spatial and temporal dynamics,
Ambio, 27(3), 175-181, 1998.
Elterman, L., UV, visible, and IR attenuation for altitudes to 50 km, Rep. 68-0153, Air Force Cambridge Res. Lab., Cambridge, Mass., 1968. Greenberg, J.P., B. Lee, D. Helmig, and P.R. Zimmerman, Fully
automated gas chromatograph-flame ionization detector system for the in situ determination of atmospheric non-methane hydrocarbons at low parts per trillion concentration, J. Chromatogr. A., 676, 389-398,
1994.
Greenberg, J.P., D. Helmig, and P.R. Zimmerman, Seasonal measurements of non-methane hydrocarbons and carbon monoxide at the Mauna Loa Observatory during the Mauna Loa Photochemistry Experiment 2, J. Geophys. Res., 101,14,581-14,598, 1996.
Greenberg, J.P., A. Guenther, P. Zimmerman, W. Baugh, C. Geron, K. Davis, D. Helmig, and L.F. Klinger, Tethered balloon measurements of biogenic VOCs in the atmospheric boundary layer, Atmos.
Environ., 33, 855-867, 1999.
Guenther, A. et al., A global model of natural volatile organic compound emissions, J. Geophys. Res., 100, 8873-8889, 1995.
Guenther, A., L. Otter, P. Zimmerman, J. Greenberg, R. Scholes, and M. Scholes, Biogenic hydrocarbon emissions from southern African savanna, J. Geophys. Res., 101, 25,859-25,865, 1996.
Guenther, A., B. Bauth, G. Brasseur, J. Greenberg, P. Harley, L. Klinger, D. Serca, and L. Vierling, Isoprene emission estimates and uncertainties for the central African EXPRESSO study domain, J. Geophys. Res., this issue
Hameed, S., J. P. Pinto, and R. W. Stewart, Sensitivity of the predicted CO-OH-CH4 perturbation to tropospheric NOx concentrations, J. Geophys. Res., 84, 763-768, 1979.
Hao, W.M., and M.H. Liu, Spatial and temporal distribution of tropical bimass burning, Global Biogeochem. Cycles, 8, 495-503, 1994.
Jacob, D.J., and S. Wofsy, Photochemistry of biogenic emissions over the Amazon forest, J. Geophys. Res., 93, 1477-1486, 1988.
Klinger, L.F., J. Greenberg, A. Guenther, G. Tyndall, P. Zimmerman, M. M'Bangui, J.-M. Moutsambote, and D. Kenfack, Patterns in volatile organic compound emissions along a savanna-rain forest gradient in central Africa, J. Geophys. Res., 103, 1443-1454, 1998.
Lenschow, D.H., The use of aircraft for probing the atmospheric boundary layer, in Atmospheric Technology, pp. 44-49, Natl. Cent. for
Atmos. Res., Boulder, Colo., 1975.
Logan, J. A., M. J. Prather, S. C. Wofsy, and M. B. McElroy, Tropospheric chemistry: A global perspective, J. Geophys. Res., 86,
7210-7254, 1981.
Lopez, A., M.L. Huertas, and J.M. Lacome, Numerical simulation of the ozone chemistry observed over forested tropical areas during DECAFE experiments, J. Geophys. Res., 97, 6149-6158, 1992. Madronich, S., and J. G. Calvert, Permutation reactions of organic
peroxy radicals in the troposphere, J. Geophys. Res., 95, 5697-5715,
1990.
Madronich, S., and S. Flocke, The role of solar radiation in atmospheric chemistry, in Handbook of Environmental Chemistry, edited by P. Boule, pp. 1-26, Springer-Verlag, New York, 1998.
Raga, G., D. Baumgardner, and J. Ogren, The direct radiative forcing by Mexico City aerosols on downwind climate, paper presented at 9th Symposium of the IAMAS Commission on Atmospheric Chemistry
and 5th Scientific Conference of the International. Global
Atmospheric Chemistry Project, Seattle, Wash., Aug. 19-25, 1998. Rodin, L.E., N.I. Bazilevich, and N.N. Rozov, Productivity of the world's
main ecosystems, in Productivity of the World Ecosystem: Proceedings Seattle Symposium 1974, edited by D.E. Reichle, pp. 13- 26, Nat.. Acad. of Sci., Washington, D.C., 1975.
Ruellan, S., H. Cachier, A. Gaudichlet, P. Masclet, and J.P. Lacaux,
Airborne aerosols over central Africa during the EXPRESSO experiment, J. Geophys. Res., this issue.
Stare, T.K., P.B. Shepson, S.B. Bertman, D.D. Riemer, R.G. Zika, and K. Olszyna. Nighttime isoprene chemistry at an urban-impacted forest site, J. Geophys. Res., 103, 22,437-22,447, 1998.
Wenny, B.N., J. S. Schafer, J. J. DeLuisi, V. K. Saxena, W. F. Barnard, I. V. Petropavlovskikh, and A. J. Vergamini, A study of regional aerosol radiative properties and effects on ultraviolet-B radiation, J. Geophys.
Res., ! 03, 17,083-17,097, 1998.
Wesely, M.L., Parameterization of surface resistance to gaseous dry deposition in regional-scale numerical models, Atmos. Environ., 23,
1293-1304, 1989.
Zimmerman, P.R., J.P. Greenberg, and C. Westberg, Measurements of atmospheric hydrocarbons and biogenic emission fluxes in the Amazon boundary layer, J. Geophys. Res., 93, 1407-1416, 1988.
W. Baugh, J. P. Greenberg, A. B. Guenther, and S. Madronich, National Center for Atmospheric Research, Atmospheric Chemistry
Division, 1850 Table Mesa Drive, Boulder, CO 80307. ( e-mail :greenher @ u car.edu)
R. Delmas, C. Delon, and A. Druilhet, Laboratoire d' Aerologie, OMP, 14 Avenue Edouard Belin, 31 400 Toulouse, France.
P. Ginoux, NASA Goddard Space Flight Center, Code 916 Greenbelt, MD 20771.
(Received May 5, 1999; revised June 21, 1999; accepted June 30, 1999.)