HAL Id: hal-01946456
https://hal-imt-atlantique.archives-ouvertes.fr/hal-01946456
Submitted on 6 Dec 2018
HAL is a multi-disciplinary open access
archive for the deposit and dissemination of
sci-entific research documents, whether they are
pub-lished or not. The documents may come from
teaching and research institutions in France or
abroad, or from public or private research centers.
L’archive ouverte pluridisciplinaire HAL, est
destinée au dépôt et à la diffusion de documents
scientifiques de niveau recherche, publiés ou non,
émanant des établissements d’enseignement et de
recherche français ou étrangers, des laboratoires
publics ou privés.
Node-based optimization of LoRa transmissions with
Multi-Armed Bandit algorithms
Raouf Kerkouche, Réda Alami, Raphaël Féraud, Nadège Varsier, Patrick
Maillé
To cite this version:
Raouf Kerkouche, Réda Alami, Raphaël Féraud, Nadège Varsier, Patrick Maillé. Node-based
optimiza-tion of LoRa transmissions with Multi-Armed Bandit algorithms. ICT 2018 : 25th Internaoptimiza-tional
Con-ference on Telecommunications, Jun 2018, Saint Malo, France. pp.1-6, �10.1109/ICT.2018.8464949�.
�hal-01946456�
Node-based optimization of LoRa transmissions with Multi-Armed
Bandit algorithms
Raouf Kerkouche
‹, Reda Alami
˛, Raphaël Féraud
˛, Nadège Varsier
˛, Patrick Maillé
‚Abstract— The use of Low Power Wide Area Networks (LPWANs) is growing due to their advantages in terms of low cost, energy efficiency and range. Although LPWANs attract the interest of industry and network operators, it faces certain constraints related to energy consumption, network coverage and quality of service. In this paper we demonstrate the possibility to optimize the performance of the LoRaWAN (Long Range Wide Area Network) technology, one of the most widely used LPWAN technology. We suggest that nodes use light-weight learning methods, namely, multi-armed bandit algorithms, to select the communication parameters (spreading factor and emission power). Extensive simulations show that such learning methods allow to manage the trade-off between energy consumption and packet loss much better than an Adap-tive Data Rate (ADR) algorithm adapting spreading factors and transmission powers on the basis of Signal to Interference and Noise Ratio (SINR) values.
I. INTRODUCTION
The interest of the industry towards the Low Power Wide Area Networks (LPWANs) is gradually increasing [1]. Several technologies operating on license-free industrial, scientific and medical radio bands (868 MHz for Europe, 915 MHz for North America and 433 MHz band for Asia) are used by industrials; among those, the LoRaWAN technology is one of the most widely used.
The LoRaWAN network architecture is based on a star-of-stars topology with gateways forming a transparent bridge. These gateways relay messages between end-devices and a central network server in the backend. Nodes use a single-hop wireless connection to one or more gateways whereas gateways are connected to the network server using standard IP connections. Communications with end-point nodes are generally bi-directional, but it is also possible to support multicast operations [2]. Communications between end-devices and gateways are spread out over different frequency channels, using so-called spreading factors (SF) defined as the logarithmic ratio between the symbol rate (Rs) and the
chip rate (Rc): SF “ log2`Rc{Rs
˘
. Accordingly, selecting the data rate (or equivalently, the SF) can be seen as a trade-off between communication range and message duration [3]. This possibility to manage data rates and power outputs for each end-device allows to maximize network capacity [2].
The LoRa spread spectrum modulation scheme defines six different spreading factors, SF7 (data rate of 50 kbps) to SF12
‹Raouf Kerkouche, Pierre and Marie Curie University, Paris, FRANCE
˛Reda Alami, Raphaël Féraud, Nadège Varsier, Orange Labs, FRANCE
‚Patrick Maillé, IMT Atlantique / IRISA, Cesson-Sévigné, FRANCE
(data rate of 0.3 kbps). SF7 allows to send messages with a higher data rate and a reduced time on air but at a shorter distance than the others SFs and vice versa. Before sending a packet, each node also selects a transmission power between 2 dBm and 14 dBm in addition to selecting a spreading factor. As any IoT technology, LoRa faces several constraints. One strict constraint is the optimization of energy consump-tion as the end-devices have generally limited energy re-sources. Another constraint is a limited duty cycle, preventing nodes from sending data too often in order to leave space for the other nodes.
LoRa can operate successfully at ranges exceeding 15 km in suburban settings, and more than 2 km in dense urban environments [4]. However, it is necessary to choose an appropriate spreading factor, to have a compromise between data rate and network coverage in order to avoid high battery consumption or frequent packet loss. That is the possibility offered by the so-called Adaptive Data Rate (ADR) scheme [2], which is currently implemented in LoRa nodes.
Research to optimize time-on-air, receiver sensitivity, packet loss and energy has been conducted by combining game theory and auction-based algorithms [5]. The goal there is to choose the best transmission power without changing the allocated spreading factor; the global results are satisfactory, but in case of a change in transmission power requirements all estimations need to be performed again, implying a huge overhead. In [5], the authors design a multi-radio testing instrument, called LoRabox, for sending and receiving data packets via LoRaWAN, Bluetooth Low Energy (BLE) and Wi-Fi, but this instrument does not have any mechanism to evaluate the cost associated with this overhead. Recently, an approach based on multi-armed bandits has been proposed to optimize the channel choice of end-devices in IoT networks [6]. The authors consider an hypothetical pro-tocol where in each time slot the devices try to send packets to a unique Base Station. In the considered environment, half of the devices are static and the other half learns. Due to the learning of an half of devices, the environment is non-stationary. The reported performance of the stochastic multi-armed bandit algorithms are close to the ones of the optimal policy, which suggests that the environment evolves slowly and sparsely and that learning methods are good candidates to improve performance in those settings.
In this article, we aim to minimize the energy consumption and the packet losses of end-devices in a LoRa network. These objectives are conflicting, hence a trade-off between them has to be found by selecting the transmission power and the spreading factor. We propose to use multi-armed
bandit algorithms, instead of the standard ADR algorithm, to handle that trade-off. In contrast to the ADR algorithm– managed by the gateway–, the SF and power choices are left to each node, that learns and adapts to its environment with limited memory and computational costs. Our work departs from the recent study of [6], since instead of considering an hypothetical protocol, we test multi-armed bandit approaches on the actual LoRa protocols. The tested algorithms compete with the standard ADR algorithm: in our simulation setting, we consider that all devices select their transmission parame-ters using the ADR algorithm, except one that learns using a multi-armed bandit algorithm. This implies an a priori non-stationary environment (due to ADR having nodes change their parameters), which is likely to favor the non-stationary bandit algorithms over stationary ones.
The remainder of this paper is organized as follows. Sec-tion II analyzes the standard ADR algorithm and describes its functioning, while Section III provides an overview on multi-armed bandit problem and algorithms. In Section IV, we demonstrate how decision-making on LoRa parameters can be done by using multi-armed bandit algorithms. Section V describes our Lora network simulator; the experimental setup and simulation results are presented and discussed in Sec-tion VI. And finally, SecSec-tion VII concludes by suggesting directions for future research.
II. THEADR (ADAPTIVEDATARATE)ALGORITHM
In order to limit the energy consumption while ensuring successful transmissions, the ADR algorithm, currently rec-ommended by the LoRa Alliance, and implemented by the network, assigns the transmission power and the spreading factor to the nodes based on the packets received from them. Note that only the network may increase the data rate (i.e., decrease the SF) through ADR, while only nodes may decrease their data rate (i.e., increase their SF) during transmissions.
The algorithm is based on the Signal to Interference and Noise Ratio (SINR) of the last 20 transmissions. For each node, the last 20 Signal to Interference and Noise Ratio (SINR) values at the gateway are taken into account to calculate a so-called margin SINR, denoted by SINRmargin.
Formally, we have
SINRmargin:“ SINRmax´ SINRRequired´ Margin,
where:
‚ SINRmax is the maximum SINR of the last 20
(suc-cessfully) received packets from the node,
‚ Margin is a constant set to 10 dB,
‚ and SINRRequired depends on the spreading factor, as
reported in Table I.
At each iteration of the ADR algorithm, the transmis-sion power and the spreading factor are modified accord-ing to a value denoted by Nstep, which is defined as: Nstep :“ roundpSINRmargin{3q. Nstep corresponds to the
number of steps to perform. If Nstep is negative (i.e., measured SINRs are low) then the transmission power is
TABLE I
SPREADINGFACTORS,AND CORRESPONDINGRXWINDOWS[7],
ANTENNA SENSITIVITIES[8],ANDSINRRequired[9]
SF RX windows (ms) Antenna Required SINR sensitivity (in dBm) for ADR (in dB) SF7 5.1 -124 -7.5 SF8 10.2 -127 -10 SF9 20.5 -130 -12.5 SF10 41.0 -133 -15 SF11 81.9 -135 -17.5 SF12 163.8 -137 -20
incremented by 3 dB until it reaches the maximum trans-mission power (14 dB), otherwise the spreading factor (SF) is decreased at each step. If the limit (SF7) is reached and there are still steps remaining, then the transmission power is decreased by 3 dB until the minimum transmission power (2 dB) is reached.
Note that while the ADR algorithm rules seem intuitive (increase power or decrease data rate in case of low SINRs, and the opposite in case of large SINRs), they are heuristics, and not based on any explicit objective optimization. By con-trast, this paper, we intend to optimize specific performance metrics by playing on the SF and power choice. We analyze the performance of ADR, but also of methods specifically designed to optimize metrics in an unknown environment, namely, the multi-armed bandit algorithms described in the next section.
III. MULTI-ARMEDBANDITS:AN OVERVIEW
A. The Multi-Armed Bandit problem
The Multi-Armed Bandit problem handles the fundamental exploration-exploitation dilemma that appears in decision making problems facing partial information, where decisions have to be taken over time (discrete turns) and impact both the rewards and the information withdrawn. Specifically, a set of K arms is available to the decision maker (player). At each turn, he has to choose one arm and receives a reward corresponding to the played arm, ignoring what the received reward would have been, if he had played another arm. The player faces the dilemma of exploring, that is playing an arm whose mean reward is loosely estimated in order to build a better estimate, or exploiting, that is playing a seemingly best arm based on current estimates in order to maximize its cumulative reward. The accuracy of the player policy at a given time horizon is typically measured in terms of regret, that is the difference between the cumulative rewards of the player and the one that could have been acquired by a policy assumed to be optimal. The notion of optimality and hence the algorithms depend on the environment.
B. Stationary stochastic environment
The stationary multi-armed bandit problem assumes the rewards to be generated independently from constant and unknown distributions associated with each arm. For those contexts, the most commonly used algorithms are called
UCB and Thompson Sampling (TS).UCB [10] builds an Up-per Confidence Bound for each arm, and chooses at each turn the one which achieves the highest current bound, thereby refining the bound for that arm. Thompson Sampling (TS) [11] uses Bayesian tools, assuming a prior distribution of each arm. The posterior distribution is updated using at each time step the observed reward of the sampled arm. Under the assumption of stationarity (of the reward distributions), UCB and TS achieve respectively rate optimal and asymptotically optimal upper-bounds on the cumulative regret [10], [12].
C. Switching stochastic environment
The switching bandit problem introduces non-stationarity within the stochastic bandit problem by allowing reward distributions to change at some turns. As expected rewards stay stationary between those changes, this setting is also qualified as piecewise-stationary. Discounted UCB [13] and sliding-window UCB [14] are adaptations of UCB to the switching bandit problem and achieve a near optimal regret bound. Recently, the Thompson Sampling algorithm has been combined with a Bayesian online change point detector for handling switching environments [15]. The Switching Thompson Sampling (STS) is based on the notion of expert. An expert is a Thompson Sampling procedure starting at time t. At each time t, a new expert is introduced. To make a decision, the most likely expert is sampled according to the weight attributed to each expert. Then, the Thompson Sampling related to the chosen expert is launched to choose an arm. Finally, based on the reward observed, the weight of each expert is updated. One should notice that the update procedure takes as input a switching rate γ. In this paper, we also use a new algorithm called Switching Thompson Sampling with Bayesian Aggregation (STSBA) [16], which is an updated version of STS where Bayesian aggregation of experts is used in place of sampling the best expert in order to avoid the sampling noise.
D. Adversarial environment
In the adversarial multi-armed bandit problem, rewards are chosen by an adversary. This formulation can model any form of non-stationarity. The EXP3 algorithm [17] uses a follow-the-perturbed-leader approach [18] for computing the probability of each action. It achieves an optimal regret against an oblivious opponent that chooses rewards before the beginning of the game, with respect to the best policy that pulls the same arm over the totality of the game. This weakness is overcome by EXP3.S [17], that forgets the past adding at each turn a proportion of the mean gain and achieves controlled regret with respect to policies that allow arm switches during the run. To compete against an optimal policy that changes over time, EXP3.R [19] uses a statistical test to reset the EXP3 algorithm. REXP3 [20] simply resets the EXP3 algorithm after a time period. A similar approach is used in [21] to reset a randomized version of the SUCCESSIVEELIMINATIONalgorithm [22].
IV. DECISIONMAKINGUSINGMULTI-ARMEDBANDIT
ALGORITHMS
The LoRa network currently uses ADR, a partially decen-tralized heuristic to tune the SF and transmission power of nodes. The values of these two parameters induce a trade-off between energy consumption and packet losses. In this section we propose a cost function, which handles the trade-off between energy consumption and packet losses. The objective of the multi-armed bandit algorithms is then to maximize the cumulated reward or equivalently to minimize the cumulated cost over time. This explicit minimization of the cost function is the main motivation for the use of multi-armed bandits, while ADR does not clearly state any objec-tive function. Moreover, multi-armed bandit algorithms come with theoretical guarantees, which apply to the proposed cost function, and can be used for instance to provide guarantees on the lifetime of devices.
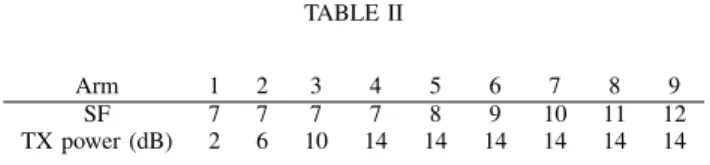
The arms correspond to a discretization of the param-eter space, namely of the pair (transmission power,SF). We consider a limited number of possible pairs, each one corresponding to an arm (See Table II). This means that each time an arm is selected, the transmission power and the spreading factor are also selected. We are aware the choice of a limited number of arms can bias the results. Our selection is consistent with the spirit of ADR, that goes in the favor of transmission reliability: all SFs are associated to the maximum transmission power (arms 4 to 9), and when the highest data rate (SF7) can be applied, we reduce the energy consumption by reducing the power. Note however that we could select a larger set of arms, which could only improve performance in the long run (increasing the set of usable pairs) but would increase the learning time. Hence the choice of 9 arms, which offers a good trade-off between the variety of (transmission power,SF) options and the time needed to find the best one(s).
TABLE II
Arm 1 2 3 4 5 6 7 8 9 SF 7 7 7 7 8 9 10 11 12 TX power (dB) 2 6 10 14 14 14 14 14 14
The trade-off between energy consumption and packet losses is expressed through a cost metric, that is a weighted sum of the energy cost and a loss cost. Mathematically we define the cost perceived at each turn (i.e., each time the node wants to send a new packet) as:
Cost :“ Energy ¨ Nb_transmission ` penalty ¨1pfailureq (1) where:
‚ Energy is the energy cost for one packet emission,
and equals the product of the emission duration (which depends on the SF) and the transmission power;
‚ Nb_transmission represents the number of
(the first emission is a success) and 8 (since there are a maximum of 7 retransmissions);
‚ 1pfailureq equals 1 if the 8 transmissions of the same
packet fail, i.e., the packet is lost. It equals 0 otherwise.
‚ penalty corresponds to the conversion of a packet loss
into the same cost unit as the energy cost. Its choice is specific to the application and to user preferences: a large penalty value means that a high quality of service is needed–for instance for healthcare applications–even if the energy cost is significant; by contrast a small value for the penalty corresponds to applications where the lifetime of the connected device is favored over having highly reliable transmissions.
Since bandit algorithms function with rewards instead of costs, we first normalize cost values with respect to the largest possible cost (highest power and lowest data rate, and transmission failure after 8 emissions), to obtain normalized values CostN in the interval p0, 1s, then we
define the reward of each decision step as:
reward :“ 1 ´ CostN. (2)
V. LORA TRANSMISSION MODEL AND SIMULATOR
We describe here the MATLAB realistic LoRa network simulator we use to perform capacity studies of the Lo-RaWAN technology [8].
A. Collision rules
In telecommunications, the Received Signal Strength In-dicator (RSSI) is a measurement of the power level of a received radio signal [23]. The Signal-to-Interference-plus-Noise Ratio (SINR) is also an important metric of the wireless link quality [24], since it directly affects the bit error rate in the transmissions.
A collision occurs when two LoRa frames are received simultaneously. There are two types of collisions: Inter-SF collisions and Intra-Inter-SF collisions, which are modeled according to the two following rules [8]:
‚ Intra-SF collisions: if a collision occurs between two
LoRa frames with the same SF on the same frequency, then only the LoRa frame with the highest power can be decoded, and provided that the power difference exceeds 6 dB (otherwise it is lost).
‚ Inter-SF collisions: if a collision occurs on the same
frequency between two LoRa frames "a" and "b" with different SFs, then packet "a" is demodulated only if: RSSIa´ RSSIb ą SINRa.
B. Propagation Model
We use the Okumura-Hata model [25], [26] because it is one of the most popular and accurate models, especially used for urban and suburban areas. It is generally applied for frequencies in the range of 150 MHz-1920 MHz, for a distance separation ranging from 1 km to 100 km, and for antenna heights from 30 m to 1000 m [27]. We consider typical indoor penetration losses, with an additional 6 dB loss for deep indoor environments [8], [28], [29].
C. Shadowing and Fast Fading modeling
Fading is the term used to describe the fluctuations in a received signal as a result of multipath components. We model it using a Rayleigh distribution for the amplitude, hence an exponential distribution on power.
Shadowing represents the fact that the received signal power fluctuates due to objects obstructing the propagation path between transmitter and receiver when fast fading is characterized by rapid fluctuations over very short distances. In our LoRa network simulator the shadowing effect is modeled through a log-normal distribution with a 12 dB standard deviation outdoor and 6 dB standard deviation for indoor applications [8], [30].
D. Data ratevs spreading factor
The data rate DR equals [31]: DR “ SF ¨BW2SF ¨ CR, with: ‚ SF the spreading factor (an integer between 7 and 12), ‚ BW the bandwidth,
‚ and CR the coding rate.
E. Transmission and Retransmission
Following each uplink transmission the end-device opens two short receive windows in order to receive a downlink message from the server as acknowledgment of its uplink message. The receive window start times are defined using the end of the transmission as a reference [7]. A node can receive a message only when one of these two windows is open. If no acknowledgment is received after closing the second window, then the message is retransmitted under certain conditions. Indeed, the number of retransmissions is limited, generally to a maximum of 7 retransmissions (what we consider in our simulator), but this number may differ depending on the end-devices. The duration of the reception window depends on the spreading factor (see Table I).
During retransmissions 3, 5, 7 (if any) the node increases its spreading factor (decreases the data rate) before sending the packet again. The rule used to increase the spreading factor is defined as: min`SFnode` 1, SF12
˘ .
Both transmission and retransmission must respect the duty cycle, defined as the maximum percentage of time during which an end-device can occupy a channel and is a key constraint for networks operating in unlicensed bands. For instance, the duty-cycle is 1% in EU 868 for end-devices [3].
In addition to the cases of collisions seen above, a retrans-mission can occur if the gateway receives the frame with an RSSI strictly below the antenna sensitivity.
In all other cases, the transmission is assumed to succeed. Mathematically, the RSSI is computed as:
RSSI “ txpower¨ Rayleighpower{PL (3)
with Rayleighpower a random variable following an
expo-nential law (with mean 1). PL represents the path loss predicted by the Okumura-Hata model and txpower is the
transmission power. The sensitivity of the antenna depends on the spreading factor (see Table I).
VI. EXPERIMENTS
A. Simulation setup
For our MATLAB simulations, we consider that the net-work net-works in the LoRa European band 863-870 MHz, and we use the 868 MHz frequency channel. The frame size is 11 bytes (4 bytes of payload for the consumption index + 7 bytes Zigbee Cluster Library application protocol overhead [8], [32]), corresponding to a smart metering application. Times on air for each SF are calculated using Semtech LoRaWAN specifications [7] and are summarized below:
SF 7 8 9 10 11 12 Time on air (s) 0.04 0.07 0.14 0.25 0.49 0.99
Our simulations are for a network consisting of one gateway and 100 end-devices. In order to consider the worst case, devices are supposed to be located deep indoor.
The experiment runs over 1000 time slots of 30 minutes each. Each node sends one packet per time slot to the gateway. While respecting the duty cycle constraint, it can send it up to 8 times (i.e., 7 retransmissions) until receiving an acknowledgment from the gateway. We select a penalty of 1 for handling the trade-off between energy consumption and packet losses, and 9 arms corresponding to the 9 couples [spreading factor, transmission power] given in Table II.
We consider devices with a -5 dBi antenna gain, which corresponds to the reality of LoRa devices on the market [8]. The first experiment considers a static setting, with a single node to be optimized at different distances from the gateway: 592 m, 1000 m and 1975 m, the 99 remaining nodes following the ADR algorithm. As the transmission between a node and the gateway may interfere with the transmissions of other nodes, the nodes are not independent. The changes of transmission parameters (due to ADR) of the other nodes can affect the distribution of rewards for the node of interest, hence an a priori non-stationary environment. In the second experiment, at time step 500 the node moves from 592 meters to 1975 meters from the gateway (immediate position switch, all other nodes remaining static). This moving node introduces a switch of the best arm (see Figure 1).
2 4 6 8 0 200 400 600 800 Arm index T otal cost (ener gy unit) 592 m 1000 m 1975 m
Fig. 1. Average costs for the 9 arms, for three different distances from the gateway: depending on the distance of the node to the gateway, the best arm to play is not always the same.
We compare the simulated standard ADR algorithm with
7 different multi-armed bandit algorithms: UCB [10] and Thompson Sampling (TS) [11] designed for stationary envi-ronments, Sliding Window UCB (SWUCB) [14], Switching Thompson Sampling (STS) [15], and Switching Thomp-son Sampling with Bayesian Aggregation (STSBA) [16] designed for switching environments, and EXP3 [17], REXP3 [20] for adversarial environments.
B. Simulation Results
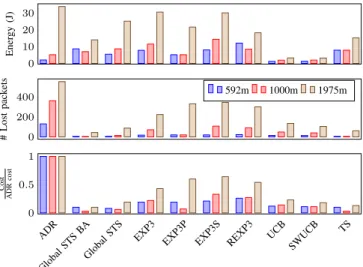
Figure 2 shows the energy consumption, the number of lost packets, and the cumulative cost (averaged over 20 sim-ulations) for a node at distance of 592 m, 1000 m, and 1975 m from the gateway, respectively, for different SF, txpower
selection algorithms (ADR and various bandit algorithms). The total cost value is defined as:řt
i“1CostNpiq ,where t
represents the current time slot, and CostNpiq the normalized
cost at time slot i (See Section IV).
First, note that for all distances, the MAB algorithms have a total cost below that of the ADR algorithm (see Figure 2). Second, the ADR algorithm is dominated, both in terms of energy consumption and packet loss, by the multi-armed bandit algorithms whatever the distance of the node: hence for any penalty value (i.e., any application an user preferences) applying a MAB algorithm instead of ADR guarantees a cost reduction.
0 10 20 30 Ener gy (J) 0 200 400 # Lost pack ets 592m 1000m 1975m ADR Global STS BA Global STS EXP3
EXP3P EXP3S REXP3 UCB SWUCB TS 0 0.5 1 Cost ADR cost
Fig. 2. Simulation results: performance for the node of interest, at three distances from the gateway
Figure 2 shows that multi-armed bandits based on a switching environment clearly outperform adversarial ban-dits, and slightly outperform stationary banban-dits, which is an indication of the slow evolution of the environment.
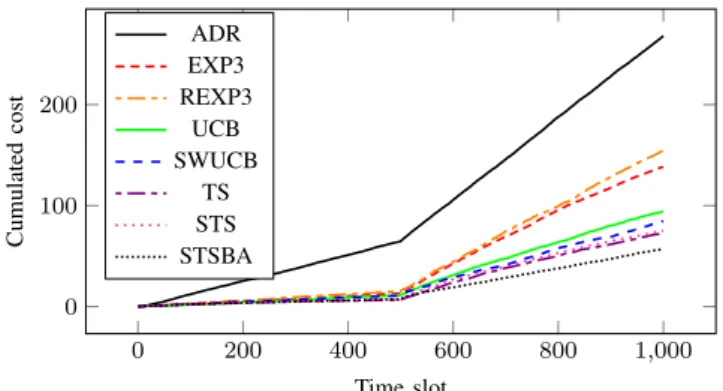
When the node moves at step 500, a clear switch is introduced (see Figure 3). ADR, which does not handle mo-bile nodes is clearly dominated by multi-armed bandit algo-rithms. The best-performing multi-armed bandit algorithm is Switching Thompson Sampling with Bayesian Aggregation. Surprisingly, the Thompson Sampling algorithm performs as well as Sliding Window UCB and Switching Thompson Sampling, which are specifically designed for switching environments while TS is not. Adversarial algorithms explore
0 200 400 600 800 1,000 0 100 200 Time slot Cumulated cost ADR EXP3 REXP3 UCB SWUCB TS STS STSBA
Fig. 3. Total cost versus time averaged over 20 trials, when at time step 500 the node moves from 592 m to 1975 m from the gateway.
too much to be competitive in this stochastic environment, and the UCB algorithm is the worst bandit algorithm in this non-stationary environment.
VII. CONCLUSIONS ANDPERSPECTIVES
In this paper, we suggest to optimize the performance of uplink LoRaWAN communications by replacing the standard ADR algorithm with multi-armed bandit algorithms to select both the spreading factor and the transmission power. The experiments are carried out with a simulator that meets the standards of the LoRaWAN technology and are performed on nodes located at different distances from the gateway and located in a deep indoor environment.
Simulation results show that the ADR algorithm has a ten-dency to perform quite well in terms of energy consumption, but incurs large packet losses. All our experiments suggest that the multi-armed bandit algorithms outperform the ADR algorithm, and can be tuned to reach a compromise between energy consumption and packet loss.
As directions for future research, we plan to investigate the case of several gateways, that correlate their received signals to improve reception, as well as the interactions among multiple node selfishly optimizing their communications.
REFERENCES
[1] J. Petajajarvi, K. Mikhaylov, A. Roivainen, T. Hanninen, and M. Pet-tissalo, “On the coverage of LPWANs: range evaluation and channel attenuation model for LoRa technology,” in Proc. of ITST, Copen-hagen, Denmark, Dec 2015.
[2] LoRa Alliance, “What is LoRaWAN?” https://www.lora-alliance.org/ what-is-lora, last accessed August, 13th 2017.
[3] F. Adelantado, X. Vilajosana, P. Tuset-Peiro, B. Martinez, and J. Melia, “Understanding the limits of LoRaWAN,” arXiv preprint arXiv:1607.08011, 2016.
[4] D.-K. Electronics, “Lorawan part 1: How to get 15 km wireless and 10-year battery life for IoT,” https://www.digikey.com/en/articles/techzone/2016/nov/
lorawan-part-1-15-km-wireless-10-year-battery-life-iot, last accessed August, 13th 2017.
[5] M. Haghighi, Z. Qin, D. Carboni, U. Adeel, F. Shi, and J. A. McCann, “Game theoretic and auction-based algorithms towards opportunistic communications in LPWA LoRa networks,” in Proc. of IEEE WF-IoT, Reston, VA, USA, Dec 2016, pp. 735–740.
[6] R. Bonnefoi, L. Besson, C. Moy, E. Kaufmann, and J. Palicot, “Multi-armed bandit learning in iot networks: Learning helps even in non-stationary settings,” in Proc. of EAI CROWNCOM, Lisbon, Portugal, Dec 2017.
[7] LoRaWAN Specification, https://www.lora-alliance.org/ lorawan-for-developers, LoRa Alliance, July 2016, version= V1.0.2.
[8] N. Varsier and J. Schwoerer, “Capacity limits of LoRaWAN technol-ogy for smart metering applications,” in Proc. of IEEE ICC, Paris, France, May 2017.
[9] S. Ghoslya, “How does LoRaWAN Adaptive Data Rate work?” http: //www.sghoslya.com/p/how-does-lorawan-nodes-changes-their.html, last accessed August, 13th 2017.
[10] P. Auer, N. Cesa-Bianchi, and P. Fischer, “Finite-time analysis of the multiarmed bandit problem,” Machine Learning, vol. 47, no. 2-3, pp. 235–256, May 2002.
[11] W. Thompson, “On the likelihood that one unknown probability exceeds another in view of the evidence of two samples.” Biometrika, vol. 25, pp. 285–294, 1933.
[12] E. Kaufmann, N. Korda, and R. Munos, “Thompson sampling: An asymptotically optimal finite-time analysis,” in Proc. of ALT, Lyon, France, Oct 2012.
[13] L. Kocsis and C. Szepesvári, “Discounted UCB,” in Proc. of 2nd PASCAL Challenges Workshop, Venice, Italy, 2006.
[14] A. Garivier and E. Moulines, “On upper-confidence bound policies for non-stationary bandit problems,” in Proc. of ALT, Espoo, Finland, Oct 2011.
[15] J. C. Mellor and J. Shapiro, “Thompson sampling in switching environments with bayesian online change point detection,” in Proc. of AISTATS, Scottsdale, AZ, USA, Apr-May 2013.
[16] R. Alami, O. Maillard, and R. Féraud, “Switching Thompson sampling with Bayesian aggregation,” https://www.researchgate. net/publication/320280956_Switching_Thompson_Sampling_with_ bayesian_Aggregation, Orange Labs, Tech. Rep., 2017.
[17] P. Auer, N. Cesa-Bianchi, Y. Freund, and R. E. Schapire, “The non-stochastic multiarmed bandit problem,” SIAM Journal on Computing, vol. 32, no. 1, pp. 48–77, 2002.
[18] N. Cesa-Bianchi and G. Lugosi, Prediction, Learning, and Games. New York, NY, USA: Cambridge University Press, 2006.
[19] R. Allesiardo and R. Féraud, “EXP3 with drift detection for the switching bandit problem,” in Proc. of DSAA, Paris, France, Oct 2015. [20] O. Besbes, Y. Gur, and A. Zeevi, “Stochastic multi-armed-bandit problem with non-stationary rewards,” in Proc. of NIPS, Montréal, Canada, Dec 2014.
[21] R. Allesiardo, R. Féraud, and O. Maillard, “The non-stationary stochastic multi-armed bandit problem,” IJDSA, vol. 3, no. 4, pp. 267– 283, 2017.
[22] E. Even-Dar, S. Mannor, and Y. Mansour, “Action elimination and stopping conditions for the multi-armed bandit and reinforcement learning problems,” JMLR, vol. 7, pp. 1079–1105, Dec 2006. [23] M. Sauter, From GSM to LTE: An Introduction to Mobile Networks
and Mobile Broadband. John Wiley & Sons, 2010, ch. Mobility Management in the Cell-DCH State, p. 160.
[24] D. R. Jeske and A. Sampath, “Signal-to-interference-plus-noise ratio estimation for wireless communication systems: Methods and analy-sis,” Naval Research Logistics, vol. 51, no. 5, pp. 720–740, Aug 2004. [25] C. A. 231, “Digital mobile radio towards future generation systems,”
European Commission, EUR 18957, Tech. Rep., Apr 1999. [26] M. Hata, “Empirical formula for propagation loss in land mobile radio
services,” IEEE Transactions on Vehicular Technology, vol. 29, no. 3, pp. 317–325, Aug 1980.
[27] T. Alumona and N. N. Kelvin, “Path Loss Prediction of Wireless Mobile Communication for Urban Areas of Imo State, South-East Region of Nigeria at 910 MHz,” Intl Journal of Sensor Networks and Data Communications, vol. 4, no. 1, 2015.
[28] L. Ferreira, M. Kuipers, C. Rodrigues, and L. M. Correia, “Charac-terisation of signal penetration into buildings for GSM and UMTS,” in Proc. of IEEE ISWCS, Valencia, Spain, Sept 2006.
[29] I. Rodriguez, H. C. Nguyen, N. T. Jorgensen, T. B. Sorensen, J. Elling, M. B. Gentsch, and P. Mogensen, “Path loss validation for urban micro cell scenarios at 3.5 GHz compared to 1.9 GHz,” in Proc. of IEEE GLOBECOM, Atlanta, GA, USA, Dec 2013.
[30] M. Ganga Prasad, P. Siddaiah, L. Reddy, and K. Lekha, “Analysis of fast fading in wireless communication channels,” Intl Journal of Systems and Technologies, vol. 3, no. 1, pp. 139–145, 2010. [31] “Guide d’utilisation v 1.2 transceiver 868mhz : 14/20dbm,” https:
//yadom.fr/downloadable/download/sample/sample\_id/125/, last ac-cessed August, 26th 2017.
[32] “Zigbee cluster library specification,” https://people.ece.cornell. edu/land/courses/ece4760/FinalProjects/s2011/kjb79_ajm232/pmeter/ ZigBee%20Cluster%20Library.pdf, last accessed August, 13th 2017.