HAL Id: hal-00669799
https://hal.archives-ouvertes.fr/hal-00669799
Submitted on 31 Jul 2017
HAL is a multi-disciplinary open access archive for the deposit and dissemination of sci-entific research documents, whether they are pub-lished or not. The documents may come from teaching and research institutions in France or abroad, or from public or private research centers.
L’archive ouverte pluridisciplinaire HAL, est destinée au dépôt et à la diffusion de documents scientifiques de niveau recherche, publiés ou non, émanant des établissements d’enseignement et de recherche français ou étrangers, des laboratoires publics ou privés.
Distributed under a Creative Commons Attribution| 4.0 International License
Towards a more effective interoperable solution through
an a priori performance measurement system
Matthieu Lauras, François Galasso, Carine Rongier, Didier Gourc, Yves Ducq
To cite this version:
Matthieu Lauras, François Galasso, Carine Rongier, Didier Gourc, Yves Ducq. Towards a more effective interoperable solution through an a priori performance measurement system. 12th Working Conference on Virtual Enterprises (PROVE), Oct 2011, São Paulo, Brazil. pp.125-132, �10.1007/978-3-642-23330-2_14�. �hal-00669799�
Through an A-Priori Performance Measurement System
Matthieu Lauras1, François Galasso1
, Carine Rongier1, Didier Gourc1, and Yves Ducq2,
1 University of Toulouse, Mines Albi, Campus Jarlard, Route de Teillet, 81013 Albi, France
{matthieu.lauras, francois.galasso, carine.rongier, didier.gourc}@mines-albi.com 2 University of Bordeaux 1 – IMS – UMR 5218 CNRS – 351 cours de la Libération – 33405
Talence cedex, France – [email protected]
Abstract. Enterprises today face many challenges related to lack of
interoperability. But several business and technical solutions are available to bridge this gap. This paper presents a structured and tooled methodology to help decision-makers to quantitatively assess interoperability solutions for their networked enterprise. Practically, this research work proposes an a priori performance measurement system that is able to model and simulate different interoperability solutions. Through a bi-dimensional analysis (stakes and accessibility), the system allows comparing all the potential solutions in order to choose the best one for the network. This scientific proposition is finally implemented on a real application case extracted from the French ISTA3 research project.
Keywords: Collaborative Network, Interoperability, Performance Measurement System, Decision Support System, Modelling and Simulation.
1 Introduction
There is a growing interest in solutions enabling companies to work together more effectively. A wide variety of collaborative systems exists and addresses different aspects of this complex problem while providing different benefits to networked enterprises. Thus, enterprise interoperability is crucial for companies and especially in decentralized, flexible and networked manufacturing system environment [1].
Enterprise applications and software systems need to be interoperable in order to achieve seamless business across organizational boundaries and thus realize virtual networked organizations. But interoperability should not only be considered a property of informatics systems. The diversity, heterogeneity, and autonomy of software components, application solutions, business processes, and the business context of an enterprise must also be considered [2].
But in practice, networked business encounters recurrent difficulties and only very limited success has been made due to the ongoing evolution of systems, the speed of market changes and growing complexity [1], [3]. Facing this huge complexity, decision-makers are confronted to the difficulty of choosing an accurate and relevant interoperability solution for their networked enterprises.
126 M. Lauras et al.
As for any decision-making, such a choice depends on the capacity of the decision maker to assess: (i) the current situation – What happened until today? What is the current progression (in a broader sense)? – and (ii) the possible evolution of the interoperability solution (information systems, business processes, organizational…) – What will happen and what are the consequences for the network?
Performance evaluation appears as a natural tool to design/modify/improve the interoperable solution of a networked enterprise. But judging an interoperability solution's performance in practice is very situation-specific and so complicated.
In accordance with the above, a complete and systemic methodology is proposed in this research work in order to help decision-makers for the selection of the best interoperability solution for their businesses at the scale of the network. Concretely, the purpose of this paper consists in designing a novel Performance Measurement System (PMS) able to evaluate and compare the performance of different interoperability solutions in a networked enterprise. This research work is a part of the French ISTA3 project (3rd generation Interoperability for Aeronautics Sub-contracTors). This is a research-oriented project, meaning it produces and uses research results, which target is to produce prototypes; industrially tested, for which one or several companies showed some interests to obtain a competitive advantage. It tries to integer the best of current research in Enterprise Interoperability: EM/ BPM (Enterprise Modeling / Business Process Modeling), Performance Evaluation, MDI (Model-Driven Interoperability), SOA (Service-Oriented Architecture) and Ontology.
The paper is divided into three main parts. First, literatures related to performance measurement systems in general and to performance for interoperability are discussed. From this background, our research statement is explained. Then we develop our scientific contributions in order to evaluate and compare interoperability solutions in a networked enterprise by exposing a performance-analyzing framework in one hand, and a modeling and simulation approach on the other hand. Next, a real case application relating to an aerospace network is presented.
2. Literature Selection
Interoperability is a keyword in many of the last decade’s articles. It is defined by European projects INTEROP and ATHENA as “property referring to the ability of diverse systems and organizations to work together (inter-operate)” (www.interop-vlab.eu). This property should be obtained following four complementary dimensions: Business, Knowledge, Applications and Communications. In this paper we focus on the Business dimension.
Panetto and Molina [1] have identified five research challenges for enterprise integration and interoperability: (i) Collaborative Networked Organizations; (ii) Enterprise Modelling and Reference Models; (iii) Enterprise and Processes Models Interoperability; (iv) Validation, Verification, Qualification and Accreditation of Enterprise Models; (v) Model Reuse and Repositories.
About the second challenge, the authors pointed out the need for the community and practitioners to develop accurate and relevant performance measurement approaches able to support decision-making in interoperable environment. However, for many years, specialists [4], [5], [6] have highlighted the limitations at the
networked scale of solutions based on the PMS in use today. Very important enterprise network features, like collaborative business processes, information partner heterogeneities, limited accessibility to information, and interoperability solutions for example, have been underestimated or, in some cases, not considered at all. These authors point out that there is little knowledge available on PMS and the use of Key Performance Indicators (KPI) in the open literature on network environments [4]. More recently, other authors [5], [6], [7], have confirmed that academics and practitioners are still in need of a new PMS which can handle the requirements of the new enterprise networks.
Progress on performance measurement requires an outlook encompassing the extended enterprise, a state of mind that emphasizes a collaborative win-win policy between respective partners. [7], [8], stress that the first step in developing an efficient collaboration is to improve the performance of disparate internal systems and processes responsible for managing and coordinating the interactions in the value chain. They show that interfacing activities locally, without a systematic overview, may result in failure, as it will be dependent on an exclusive use of internal measurements. [9] note effectively that the development of disparate measurement systems may result in superfluous and incompatible performance evaluation.
Consequently, a PMS dedicated to interoperability should measure locally and globally the performance of the network.
PMS are used either (i) to design a new system (or to modify an existing system), or (ii) to control an existing system referred hereinafter to (i) a priori or (ii) a posteriori. The objective of this work is to compare the performance of several interoperability solutions. Thus, the a priori performance evaluation is retained.
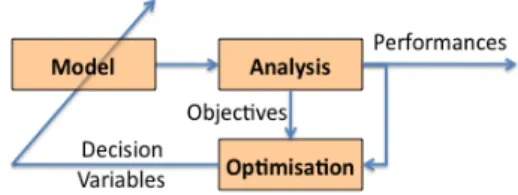
A priori performance evaluation consists in anticipating the future performance of the system (in our case, of the networked enterprise). This includes three main steps: (1) Innovation: explanation and objectives; (2) Implementation: variables and indicators choosing; (3) Observation: simulation through a model.
These steps are represented on Figure 1. This kind of performance evaluation is based on an enterprise model and on a simulation approach to evaluate the probable future results of each KPI (local and global in our case). One main difficulty relates to the design of the model and the link to the simulation approach.
Consequently, a PMS dedicated to interoperability should be based on accurate and relevant enterprise models (that is to say, a business process model able to focus on interoperability components of the network) on one hand, and based on a associated simulation tool (that is to say, a tool able to simulate the previous enterprise modelling and to measure the different KPI) on the other hand.
128 M. Lauras et al.
Finally, this literature selection on interoperability highlights that several levels of interoperability exist [2], [10], and should be considered:
- Independent: these are organizations that would normally work without any interaction other than that provided by personal contact; - Collaborative: these are organizations where recognized frameworks
are in place to support interoperability and shared goals are recognized and roles and responsibilities are allocated as part of on-going responsibilities however the organizations are still distinct; - Combined or Integrated: these are organizations where there are
shared value systems and shared goals, a common understanding and a preparedness to interoperate;
- Unified: these are organizations in which the organizational goals, value systems, command structure/style, and knowledge bases are shared across the system.
Of course, each level requires different technologies, different skills and different level of maturity in terms of collaboration. But all the networks do not need the same level of interoperability to be competitive.
Consequently, a PMS dedicated to interoperability should be able to evaluate the ratio between the investments (costs, skills, technical…) needed to reach one level of interoperability and the expected potential performance results.
3. Scientific Proposition
Our proposition is based on two main assumptions. First, all partners of the network are considered to have already get their own dashboards or at least, they have KPI able to measure their local performance. Otherwise, they can use specific methods to define and to implement PMS such as ECOGRAI [12] or Balanced Score Card [13]. Second, decision-makers are able to define and model several options to support their interoperability needs. For instance, they could envisage and describe a collaborative solution, a combined solution and a unified solution (see. section 2). In order to compare the different solutions and to support decision-making, we propose a three steps methodology based on the results of the literature review:
1. Modelling the collaborative processes and the different interoperability options (this is the Innovation part);
2. Evaluating the accessibility of each option (this is the Implementation part); 3. Simulating each option in order to measure the associated performance (this is
the Observation part).
Concerning the first step, a business process modelling language enabling to describe the different interoperability solutions is selected. Based on surveys done by [11], the Business Process Modelling Notation (BPMN) standard (www.bpmi.org) has been chosen. This standard presents two major interests for our research work:
- This modelling language allows describing clearly all the interfaces between partners of the network.
- BPMN is a language that is relatively easy to simulate by classical tools of Discrete Event Simulation (native in the majority of simulation software) (see. Figure 3).
Concerning the second step, the accessibility dimension aims to assess efforts that each interoperability solution (modelled in step 1) requires to be implemented in order to represent the different solutions on a common axis (from the least accessible solution to the most accessible one). This aggregated effort is evaluated through a multi-criteria analysis (not developed in this paper) that includes variables such as: project costs and/or duration, technical and business skills, investments, etc. Consequently, for one interoperability model, there is one accessibility level.
The third step consists in simulating the BPMN diagrams by using Discrete Event Simulation software such as Witness® or Arena®. The simulation models must include KPI defined by decision-makers as representative of the interoperability impact. Then, for each KPI, it is possible to measure the performance of each interoperability solution. Consequently, for a given model, there is a set of measures called “scenarii”. It is important to underline that the KPI’s must be common to all solutions for comparison purpose. These KPIs are representative of the main interoperability stakes [1], [2], such as adaptability, integrity, security, time saving, or flexibility.
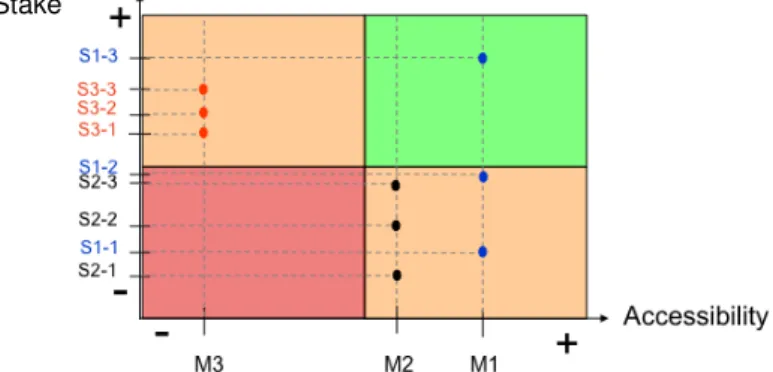
Finally, the different evaluations following the two dimensions discussed before - stake (for each KPI and for each potential solution) and accessibility (for each potential solution) - are represented on a same graph as described in Figure 2.
Fig. 2. Comparison graph for stake and accessibility of scenarii.
4. Application Case
The problem statement discussed in this paper is particularly sensitive for the product development cycle. Taking time and money out of the product development cycle can pay big dividends for companies. Distributed teams of engineers are creating products and nowadays OEMs often delegate significant design responsibilities to their key suppliers.
In Aerospace industry, the strategy of the main aircraft manufacturers is to outsource more and more sub-assemblies. Thus, level 2 Subcontractors (STR2) develop more complex relationships and high value-added with level 1 sub-contractors (STR1) and their own subsub-contractors (STR3 and following ranks STRn). These relationships, as part of the design and manufacture of composite parts, use different methods of work and are handled through various tools for Design, Product Lifecycle Management (PLM), Technical Data Management, Production
130 M. Lauras et al.
Management... These tools must be interoperable in a flexible (fast adaptation to new cooperation) and economical way. In this application we focus on informational system interoperability.
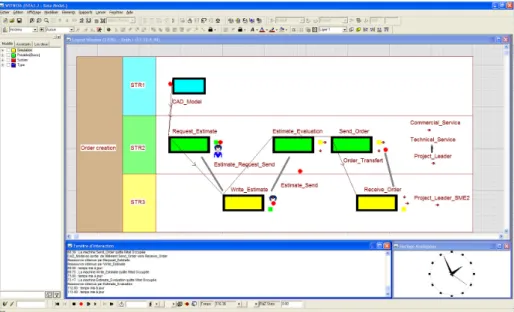
In this application, extracted and voluntarily simplified from the ISTA3 French project, relationships between level 2 and 3 subcontractors are studied. In the purpose of this article, the illustration is done on a process dedicated to the validation of an estimate given by STR3 in an order at STR2 level and shown in Figure 3. It can be viewed from Figure 3 that the simulation model is based on BPMN concepts (pools, activities, message flows…). Indeed, this model is the only presented here.
Fig. 3. Caption of Witness® model for process simulation.
In this process, a STR1 subcontractor sends a CAD model of a part to be manufactured by STR2. STR2 needs STR3 in order to create the necessary tools and thus, requests an estimate from STR3. Then STR3 writes (i.e. elaborates) the estimate that is sent back to STR2. The following steps are internal to STR2 and consist of an evaluation of the estimate and, if the estimate is correct, it is converted into an order sent to STR3 that finally receive the order. The elaboration of the tool concerns another process that is not described in this paper. The resources needed at STR2 are finally the Commercial Service, The Technical Service and the Project Leader. At STR3, the needed resource is the Project Leader.
Both internal and external performance linked to interoperable activities for each company needs to be assessed. Both internal activities (i.e. request estimate, write estimate, estimate evaluation…) and external activities (i.e. estimate request send, estimate send, …) are modelled through lead times. The STR2 and STR3 experts of the concerned process have validated all these dimensions as representative of the interoperability performance. But, in this study, we focus only on a KPI that is
representative of the global impact of each interoperability solutions. Experts and authors have chosen the “average lead-time”.
Three scenarii (interoperability solutions) are evaluated: 1. As-is simulation;
2. Improvement of STR2 internal activities through the use of an estimate management system;
3. Improvement of information transfer through the use of a collaborative platform such as Mediation Information System: this stimulates an improvement of interactions.
The stake of each scenario is given according relatively to the scenario 1 results, (i.e. the existing performances) and the results of the considered scenario, (i.e. future performances). Accessibility is given for each scenario according to the difficulty to set up such a scenario over a scale from 0 (very low accessibility) to 5 (very high accessibility). Obviously, an accessibility of 5 is given to the first scenario as it is the current situation. The results of the simulation are given in Table 1.
Table 1. Performance assessment for each scenario.
Scenario Average lead time Stake Accessibility 1 27,28 0 5
2 22,34 4,94 (18%) 3
3 15 12,28 (45%) 0
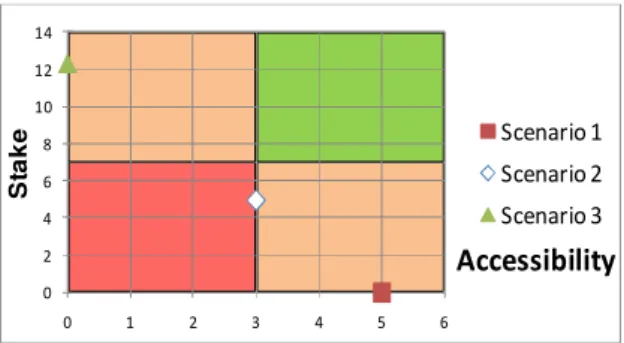
Obviously, these results are only available considering data given in the simulation. An extraction of real temporal values for each activity will be assessed in the frame of the ISTA3 project. Nevertheless this example shows clearly how our proposition can help decision-makers to compare objectively different interoperability levels for their network. In this example, the recommendation could consist in privileging the second scenario if the objective is to obtain a good compromise between accessibility (not too many efforts to produce) and stake (almost 20 % of lead-time reduction). But if the objective is to divide the lead-time by two then the decision-makers have to assume an important effort to upgrade their interoperability solution (IT, skills, project costs, collaborative protocols…) and could select the third scenario. The figure 4 shows the scenarios positions according to the matrix presented in previous part.
Fig. 4. Position of each scenario.
0 2 4 6 8 10 12 14 0 1 2 3 4 5 6 S ta k e Accessibility Scenario 1 Scenario 2 Scenario 3
132 M. Lauras et al.
5. Conclusion and Future Works
This research work aims at designing a Performance Measurement System (PMS) able to evaluate and compare the performance of different interoperability solutions in a networked enterprise using a three steps approach: (i) Modelling the collaborative processes and the different interoperability options; (ii) evaluating the accessibility of each option; (iii) simulating each option in order to measure the associated performance. This proposition is implemented on a real case study (aerospace industry) extracted from the French ISTA3 research project.
Though our proposition constitutes a significant step towards more effective interoperable solutions, several perspectives arise. Particularly, some complementary works are in progress to aggregate properly on a unique dimension on one hand the performance of all interoperability stakes (adaptability, integrity, security, time saving and flexibility) and, on the other hand, of all interoperability accessibility dimensions. Other studies should also be developed in order to define concretely the accessibility dimensions for an interoperability solution. Finally, further research should also include more practical insights on how managers can adjust and adapt the model to their own strategies.
6. References
1. Panetto, H., Molina, A.: Enterprise integration and interoperability in manufacturing systems: Trends and issues. Computers in Industry. 59(7), 641--646 (2008)
2. Chen, C., Dassisti, M., Elvesaeter, B.: Interoperability Knowledge Corpus, Deliverable DI.1b,
Workpackage DI, INTEROP NoE, available at
http://interop-vlab.eu/backoffice/ei_public_deliverables/, (2006)
3. Jochem, R.: Enterprise Interoperability Assessment, in 8th International Conference of Modeling and Simulation MOSIM'10. Conference, Hammamet (2010)
4. Beamon, B.M.: Measuring Supply Chain Performance. International Journal of Operations and Production Management, 19(3), 275--292 (1999)
5. Gunasekaran, A., Kobu, B.: Performance measures and metrics in logistics and supply chain management: a review of recent literature (1995 – 2004) for research and applications. International Journal of Production Research, 45(12), 2819--2840 (2007)
6. Akyuz, G.A., Erkan, T.E.: Supply chain performance measurement: a literature review. International Journal of Production Research, 48(17), 5137--5155 (2010)
7. Alfaro J.J., Rodriguez-Rodriguez, R., Verdecho, M.J., Ortiz, A., Business process interoperability and collaborative performance measurement. International Journal of Computer Integrated Manufacturing. 22(9), 877-889 (2009)
8. Al-Mudimigh, A.S., Zairi, M., Ahmed, A.M.M.: Extending the concept of supply chain: the effective management of value chains. International Journal of Production Economics, 87(3), 309--320 (2004)
9. Folan, P., Browne, J.: A review of performance measurement: towards performance management, Computers in Industry. 56(7), 663--680 (2005)
10. Clark, T., Jones, R.: Organisational Interoperability Maturity Model for C2, In Proceedings of the Command And Control Research And Technology Symposium, USA, (1999).
11.Touzi, J., Aide à la conception de Système d'Information Collaboratif support de l'interopérabilité des entreprises, PhD Thesis, INP Toulouse (2007)
12. Ducq Y., Vallespir B.:Definition and aggregation of a Performance Measurement System in three Aeronautical workshops using the ECOGRAI Method - International Journal of Production Planning and Control, 16(2), 163--177 (2005)
13. R. S. Kaplan and Norton, D.P.: The balanced scorecard: Translating strategy into action, Harvard Business School Press, (1996).