Cahier 2000-16
ATALLAH, Gamal
Vertical R&D Spillovers, Cooperation, Market
Structure, and Innovation
Département de sciences économiques Université de Montréal
Faculté des arts et des sciences C.P. 6128, succursale Centre-Ville Montréal (Québec) H3C 3J7 Canada http://www.sceco.umontreal.ca [email protected] Téléphone : (514) 343-6539 Télécopieur : (514) 343-7221
Ce cahier a également été publié par le Centre interuniversitaire de recherche en économie quantitative (CIREQ) sous le numéro 19-2000.
This working paper was also published by the Center for Interuniversity Research in Quantitative Economics (CIREQ), under number 19-2000.
CAHIER 2000-16
VERTICAL R&D SPILLOVERS, COOPERATION, MARKET STRUCTURE, AND INNOVATION*
Gamal ATALLAH1
1
Centre de recherche et développement en économique (C.R.D.E.) and Département de sciences économiques, Université de Montréal, and CIRANO
November 2000
__________________
* This paper is based on the second chapter of the author’s doctoral dissertation. The author would like to thank Marcel Boyer, his thesis advisor, for insightful comments and suggestions. He would also like to thank Caroline Boivin, Leonard Dudley, Georg Erber, Ngo Van Long, Keith Newton, Michel Patry, Michel Poitevin, Jacques Robert, and Patrick Waelbroeck, as well as seminar participants at Industry Canada, Statistics Canada, the C.R.D.E., the École des Hautes Études Commerciales, the 46th International Atlantic Economic Conference, the 33rd Annual Meeting of the Canadian Economics Association, the 40ème Congrès de la Société canadienne de science économique, and the 17ès Journées de microéconomie appliquée for useful comments.
RÉSUMÉ
Cet article étudie les externalités de recherche verticales entre des firmes en amont et des firmes en aval. Il y a deux industries verticalement reliées, avec des externalités horizontales au sein de chaque industrie et des externalités verticales entre les deux industries. Quatre structures de coopération en R&D sont considérées : pas de coopération, coopération horizontale, coopération verticale, et coopération horizontale et verticale simultanément. Les externalités verticales augmentent la R&D et le bien-être, alors que les externalités horizontales peuvent les augmenter ou les diminuer. La comparaison des structures de coopération en terme de R&D révèle qu’aucune structure ne domine uniformément les autres. Le classement des structures de coopération dépend des externalités horizontales et verticales, et de la concurrence. Le classement dépend des signes et magnitudes de trois externalités concurrentielles (verticale, horizontale et diagonale) qui captent l’effet de la R&D d’une firme sur les profits des autres firmes. Un des résultats de base de la littérature sur l’investissement stratégique est que la coopération entre concurrents augmente (diminue) la R&D lorsque les externalités horizontales sont élevées (faibles) ; le modèle montre que ce résultat n’est pas toujours vérifié en présence des externalités verticales et/ou de la coopération verticale. Le papier propose une théorie reliant le degré d’innovation à la structure du marché : la relation entre la concurrence et l’innovation dépend des externalités horizontales, des externalités verticales et de la structure de coopération. Les incitations privées à la coopération en R&D sont examinées; on montre que les vendeurs et les acheteurs ont des préférences différentes quant au choix de structure de coopération et que les externalités augmentent la vraisemblance de l’émergence décentralisée de la coopération.
Mots clés : externalités de recherche verticales, structure de marché, innovation, coopération verticale en R&D, politique de R&D
ABSTRACT
This paper studies vertical R&D spillovers between upstream and downstream firms. The model incorporates two vertically related industries, with horizontal spillovers within each industry and vertical spillovers between the two industries. Four types of R&D cooperation are studied : no cooperation, horizontal cooperation, vertical cooperation, and simultaneous horizontal and vertical cooperation. Vertical spillovers always increase R&D and welfare, while horizontal spillovers may increase or decrease them. The comparison of cooperative settings in terms of R&D shows that no setting uniformly dominates the others. Which type of cooperation yields more R&D depends on horizontal and vertical spillovers, and market structure. The ranking of cooperative structures hinges on the signs and magnitudes of three competitive externalities (vertical, horizontal, and diagonal) which capture the effect of the R&D of a firm on the profits of other firms. One of the basic results of the strategic investment literature is that cooperation between competitors increases (decreases) R&D when horizontal spillovers are high (low); the model shows that this result does not necessarily hold when vertical spillovers and vertical cooperation are taken into account. The paper proposes a theory of innovation and market structure, showing that the relation between innovation and competition depends on horizontal spillovers, vertical spillovers, and cooperative settings. The private incentives for R&D cooperation are addressed. It is found that buyers and sellers have divergent interests regarding the choice of cooperative settings and that spillovers increase the likelihood of the emergence of cooperation in a decentralized equilibrium.
Some of the issues examined are absorptive capacities (Cohen and Levinthal, 1990), price vs. quantity competition 2
(Delbono and Denicolo, 1990), Stackelberg leadership (Goel, 1990), process vs. product innovation (Levin and Reiss, 1988), partial cartelization (Kamien and Zang, 1993; Theotoky, 1995; De Bondt and Wu, 1997), asymmetric firms (Rosen, 1991; Poyago-Theotoky, 1996), asymmetric spillovers (Jarmin, 1993), and spillovers between demand unrelated industries (Steurs, 1994; 1995). Kamien et al. (1992) generalize this framework and study different combinations of cooperation and information sharing.
1. Introduction
Lately there has been an intensification of Research Joint Ventures and technological alliances between firms. For instance, Hagedoorn et al. (2000) note that the number of new technology partnerships set up annually went from 30-40 in the early 1970s to around 600 during the 1980s and 1990s. Appropriability is an important dimension of R&D which has been the subject of a large theoretical and empirical literature. Although spillover analysis can be traced back to Ruff (1969), the modern theoretical treatment of the subject builds on the seminal papers by Spence (1984) and d’Aspremont and Jacquemin (1988).
Many variants of this basic model have been studied. Almost all of the studies in the strategic2
investment literature deal with horizontal spillovers between competing firms. Spillovers between buyers and sellers, which I call vertical spillovers, are one instance of interindustry spillovers. The main difference between horizontal and vertical spillovers is that the former are involuntary and (generally) undesirable from the point of view of the innovating firm, whereas the latter are desirable (and are more often voluntary). Another difference is that while horizontal R&D cooperation may mitigate competition between firms, and is often closely monitored by competition authorities, vertical cooperation is less likely to hinder competition. Intraindustry cooperation is generally sufficient for firms to internalize horizontal spillovers. However, the internalization of vertical spillovers requires interindustry coordination. When vertical and horizontal spillovers are linked, a strong patent protection policy aiming at prohibiting competitors from acquiring the innovation may also harm vertically related firms (as well as firms in demand unrelated industries).
Whereas the empirical literature shows that vertical technological flows are significant, little theoretical treatment has focussed on this dimension of appropriability. Two exceptions are Peters (1995) and Harhoff (1991). Peters (1995) studies a model of vertical spillovers. He finds that more concentrated industries tend to spend more on R&D (however, this result may be reversed for high values of interindustry spillovers and some specific values of horizontal spillovers), horizontal spillovers may increase or decrease R&D, and vertical spillovers increase R&D investments, profits, and welfare. The model suffers from some restrictive assumptions: spillovers are in one direction only, from suppliers to customers; upstream firms do not benefit from their own R&D investments: all benefits accrue to downstream firms; upstream firms cannot adjust their output to their R&D investments; finally, cooperation is not addressed. In a related paper Becker and Peters (1995) study R&D competition between two vertical corporate networks in a patent race framework.
Harhoff (1991) studies a model of product R&D spillovers between vertically related industries. He finds that upstream and downstream R&D are generally substitutes: with an exogenous market structure and perfect vertical spillovers (in one direction only), only one of the two industries spends on
This is contrary to the results of Steurs (1994,1995), Peters (1995), and -as will be seen- our model, where it is found 3
that there is a strong complementarity between interindustry research efforts.
Vertical R&D cooperation has been briefly addressed in the agricultural economics literature. See Freebairn et al. (1982) 4
and Alston and Scobie (1983).
imperfectly appropriable R&D. However, his model suffers from some restrictive assumptions. The3
presence of a Stackelberg upstream monopolist makes the results applicable only to very asymmetric markets. Moreover, this market structure makes it impossible to study upstream horizontal spillovers along with downstream horizontal spillovers. Another restrictive assumption is that when (downstream) horizontal spillovers are allowed for, upstream prices are fixed exogenously. Moreover, vertical spillovers are perfect, and they accrue only from the seller to the buyers. Finally, cooperation is not addressed.4
This paper studies vertical spillovers, allowing for different market structures, appropriability conditions, and types of cooperation. The model incorporates two vertically related industries, with horizontal spillovers within each industry and vertical spillovers between the two industries, in a three-stage game theoretic framework. The contribution of the paper is threefold. First, this is the first paper to formalize vertical spillovers in a relatively general framework. Second, the study of cooperation goes further than existing studies by considering four different cooperative structures: no cooperation, interindustry and intraindustry cooperation, interindustry cooperation only, and intraindustry cooperation only. Finally, the paper addresses market structure explicitly, and provides a theory of innovation and market structure. The paper incorporates a large number of issues: horizontal spillovers, vertical spillovers, R&D cooperation, market structure, endogenous cooperation. While this complicates the analysis and presentation of the results, I believe that omitting any of these variables would obscure some of the most important parts of the problem, such as the interplay between R&D cooperation, spillovers, and market structure.
Here is a summary of the main findings of the paper. Vertical spillovers affect R&D investments directly and indirectly, through their influence on the impact of horizontal spillovers and of R&D cooperation. Whereas horizontal spillovers may increase or decrease innovation and welfare depending on prevailing cooperation types, vertical spillovers always increase them. Cooperative settings are compared in terms of R&D. It is shown that no type of cooperation uniformly dominates the others. The type of cooperation yielding more R&D depends on horizontal spillovers, vertical spillovers, and market structure. The ranking of cooperative structures hinges on the signs and magnitudes of three competitive externalities (vertical, horizontal, and diagonal) which capture the effect of the R&D of a firm on the profits of other firms. The type of cooperation inducing firms to internalize a larger positive sum of competitive externalities yields more R&D. In particular, one of the basic results of the strategic investment literature is that cooperation between competitors increases (decreases) R&D when horizontal spillovers are high (low); the model shows that this result does not necessarily hold when vertical spillovers and vertical cooperation are taken into account. A theory of innovation and market structure is proposed: the effect of competition in one industry on total innovation depends on horizontal spillovers, vertical spillovers, cooperative settings, and competition in the other industry. The relation between competition and innovation can be understood in terms of the horizontal, vertical, and diagonal competitive externalities. Finally, the analysis of the private incentives for cooperation shows that buyers and sellers have different preferences over cooperative settings: sellers prefer vertical cooperation, whereas buyers (generally) prefer horizontal cooperation. Higher spillovers increase the likelihood of
The ongoing trend toward more outsourcing increases the importance of the study of vertical spillovers. When firms had 5
higher levels of vertical integration, a good part of vertical spillovers were internalized. However, with outsourcing, spillovers which were intra-firm become inter-firm/interindustry spillovers.
Suzuki finds that spillovers from the core firm to its subcontractors are significant: a percentage increase in technology 6
transfer reduces the unit variable cost of the subcontractor by 0.09%. In the study of a sample of 208 Japanese manufacturing firms, Branstetter (199?) finds that production keiretsu promote innovative activity, as measured by firm-level spending on research and development. Moreover, he finds evidence that affiliation with production keiretsu groups promotes the exchange of technological knowledge across firms within groups.
cooperation, but the multiplicity of equilibria makes the decentralized choice of socially optimal cooperative settings uncertain.
The paper is organized as follows. Section 2 provides some background on vertical spillovers and vertical cooperation. The model is presented and solved in section 3. Comparative statics are studied in section 4. Section 5 compares R&D expenditures between types of cooperation. In section 6 the relation between market structure and innovation is addressed. The private incentives for cooperation are studied in section 7. Section 8 concludes.
2. Background
There is ample evidence that interindustry spillovers -of which vertical spillovers are one instance-are significant. Bernstein (1988) and Jaffe (1986) find that interindustry spillovers have more effects on cost reduction than intraindustry spillovers. Bernstein finds that unit costs decrease more in response to an increase in intraindustry (interindustry) spillovers in industries with large (small) R&D cost shares. Pavitt (1984) finds that out of 2,000 innovations in the UK, only 40% emanated from the sector using the innovation.
Some evidence points more explicitly to vertical spillovers. Goto and Suzuki (1989) find that5
in the electronics industry, technological diffusion through spillovers is more important than technological diffusion through inputs. Ward and Dranove (1995) find important vertical spillovers within the American pharmaceutical industry. Suzuki (1993) and Branstetter (199?) find significant vertical spillovers in Japanese keiretsu. As Mohnen notes: “Interindustry knowledge spillovers are more6 likely to occur ... when one innovation naturally calls for the development of complementary products or innovations in an upstream input supply sector in order to reach its full potential.” (Mohnen, 1989:5) The role of vertically related firms in the development of new technologies is well documented. In the auto industry, much of the innovation comes from suppliers (Jorde and Teece, 1990). Clark et al. (1987) show the importance of the role played by die suppliers for new product development by Japanese automobile firms. Vanderwerf (1992) shows that upstream firms often create downstream innovations, even when the direct profit from the innovation accrues to downstream firms. This can be explained by the increase in final demand due to the innovation. Von Hippel (1988) finds that more than two thirds of first-to-market innovations concerning scientific instruments and process machinery in semiconductor and electronic subassembly manufacturing are dominated by end-users.
In some cases the complementarity between upstream and downstream innovation is sufficiently strong to require explicit vertical cooperation. “Vertical research joint ventures ..(RJVs), which
p ' a&w'mi'1ybi
The vertical chain contains only two industries for the sake of simplicity, but this assumption can also be justified by 7
the empirical result that even though interindustry spillovers are important, each industry receives spillovers from a limited range of industries (Bernstein and Nadiri, 1988).
constitute a substantial fraction of RJVs, are designed to bring together complementary assets, usually research capacity and manufacturing or marketing” (Aghion and Tirole, 1993:7). Vertical technological cooperation is widely observed. It is sometimes argued that the high levels of vertical cooperation in the Japanese economy are responsible for much of Japan’s competitive edge (Dyer and Ouchi, 1993). Sako (1995) argues that inter-supplier coordination (through kyoryokukai) in the Japanese automotive industry is also important. Moreover, suppliers with above (below) average technological capabilities prefer vertical (horizontal) technological cooperation. This is to be expected, since mutual learning between suppliers is more valuable when there is no fear of information leakage to competitors. Cassiman and Veugelers (1998), from the study of a sample of firms from the Belgian manufacturing industry, find that most cooperative agreements are vertical or with research institutes, rather than horizontal; they find that vertical cooperation is driven by the search for external knowledge and complementarities, rather than by sharing high costs or high risks of research. Veugelers (1993) finds that vertical relations account for 38% of Joint Ventures and for 25% of cooperative agreements. Since its foundation, SEMATECH (the Semiconductor Manufacturing Technology Consortium) has shifted from horizontal to vertical cooperation (Grindley et al., 1994).
Vertical cooperation has an important legal dimension. American antitrust laws are more restrictive regarding inter-firm technological cooperation than their European and Japanese counterparts (Jorde and Teece, 1990, 1992). For instance, European antitrust authorities grant cooperative R&D agreements exemption from Article 85 of the Treaty of Rome governing broad aspects of competition among firms. The exemption applies for five years, regardless of market share, if the participants are vertically related and do not compete directly in the relevant market.
3. The model
The standard duopoly framework used in much of the strategic investment literature is quite restrictive. Here we use a more general market structure, for both upstream and downstream industries. This allows us to see how changes in market structure affect the relative desirability of different types of R&D cooperation. Indeed, it will be shown that this comparison depends critically on market structure. Also, this allows us to analyze the effects of spillovers and cooperation on the relation between market structure and innovation. This yields results that are related to the literature studying the effect of the technological environment on the Schumpeterian hypothesis.
There are m identical buyers of a standardized input, and n identical suppliers providing this input. This market structure is given, so entry issues are put aside. If no R&D is undertaken, suppliers incur a constant unit production cost of s and sell the input at a unit price of t to buyers. Buyers pay the suppliers t for each unit bought, and incur an additional internal production cost of r. Finally, buyers sell the product to consumers at price p. Buyers face the linear inverse demand7
cbi ' t%r&xbi&h'mj…i xbj&v'ni'1xsi.
csi ' s&xsi&h'nj…i xsj&v'mi'1xbi.
r > xbi%h'mj…i xbj%v'ni'1xsi, i'1,...,m s > xsi%h'nj…i xsj%v'mi'1xbi, i'1,...,n.
See, for instance, Kamien and Schwartz, 1982. However, this issue remains controversial; see Nadiri, 1993. 8
An important difference with Peters (1995) is that Peters assumes that vertical spillovers accrue only from suppliers to 9
customers. However, there is no a priori reason why vertical spillovers should not be bi-directional. For instance, Suzuki (1993) finds vertical spillovers in both directions between core firms and their subcontractors in keiretsu.
Spillovers from a firm need not be limited to its own buyers/suppliers. Suzuki (1993) identifies spillovers between the 10
core firm in a keiretsu and the subcontractors belonging to other keiretsus. A percentage increase in technology transfer reduces the unit variable cost of the subcontractors by 0.11%, an even larger spillover than between the firm and its own subcontractors. Those vertical spillovers (although in the second case one should speak of cross or diagonal spillovers) are found to be even more important than technological transfers between core firms from different keiretsus (horizontal spillovers), which are of the order of 0.08%. Keiretsu provide an example where vertical spillovers are just as important empirically as, perhaps even more important than, horizontal spillovers.
Imperfect spillovers can represent imperfect information leakage, the productivity of transferred knowledge (Peters, 11
1995), novelty requirements (Henriques, 1991), perfect information leakage with an absorption cost (for instance Levin et al. (1987) find that patents raise imitation costs and time), or perfect information leakage with differences in technology which cause only some of the information to be useful.
Firms can engage in cost-reducing R&D activities. The dollar cost of x units of R&D for firm i is ux , where x represents the R&D output of firm i, and u>0 represents a cost parameter. It is assumedi2 i that u is sufficiently high for the profit function to be concave, and sufficiently low for firms to choose strictly positive amounts of R&D. Convex R&D costs can be justified by the observation of decreasing returns to scale in R&D. With quadratic costs, many small research labs will be more cost effective than8
one big research unit. However, each firm is assumed to operate exactly one research lab, for the sake of simplicity. Total R&D output will be denoted X.
Each unit of R&D by a firm reduces its own cost by one dollar, reduces the cost of each of its competitors by h dollars (horizontal spillovers), and reduces the cost of each firm in the other industry by v dollars (vertical spillovers),9 10with h,v0[0,1]. The spillovers h and v can differ for many factors:11
different absorptive capacities between suppliers/distributors and competitors, different levels of technological complementarities, differences in the efficiency of communication channels, and linkages between the degree of information leakage and the type of inter-firm interaction. The unit cost of production of a downstream firm is
The unit cost of production of an upstream firm is
Consequently, the final unit cost of a firm depends on its R&D choice as well as on that of all other firms. Buyers benefit from sellers’ R&D through a reduction in the cost of their input, and through vertical spillovers. Sellers benefit from buyers’ R&D through the reduction in buyers’ cost, and through vertical spillovers. Note that whereas R&D expenses are independent of output, its benefits are linked to output, since the higher output is, the higher the number of units that benefit from cost reduction.
Parameters are assumed to be such that the following nonnegativity constraints are satisfied:
Maxy bi Bbi ' (p(Y)&cbi)ybi&ux 2 bi ybi ' a&t&r%(m&(m&1)h )xbi&(1&2h)' m j…ixbj%v' n i'1xsi w(m%1) p ' a%m(t%r)&(1%(m&1)h)' m i'1xbi&mv' n i'1xsi m%1 t ' m(a&r)%(1%(m&1)h)' m i'1xbi%mv' n i'1xsi&w(m%1)' n i'1ysi m Maxy si Bsi ' (t(Y)&csi)ysi&ux 2 si.
The use of a sequential model is one of the restrictive assumptions of the model. A simultaneous game for vertically 12
related firms would avoid "the potentially restrictive assignment of leader-follower roles required by the Stackelberg solution." (Young, 1991:717). However, in a vertical market with prices as strategic variables, no equilibrium can be obtained in a simultaneous game; a simultaneous game would require the use of markups, not prices, as strategic variables (Young, 1991; Irmen, 1997). Other negotiation mechanisms could be used to obtain simultaneous output decisions between buyers and sellers. However, for the purpose of obtaining results which are comparable with other studies in this literature, and to maintain tractability, it is assumed that firms compete in output, implying sellers’ leadership.
(1)
(2)
(3)
has three stages: one R&D stage and two output stages. In the first stage all firms decide on their R&D simultaneously. In the second stage upstream firms compete in Cournot, taking into account the derived demand curve of the downstream industry. In the third stage there is a Cournot game among all downstream firms, taking the price of the intermediate good as given. The output stages follow the successive oligopoly structure suggested by Greenhut and Ohta (1979). The price of the intermediate good is determined by Cournot competition in the upstream industry, based on the derived demand curve of buyers. In horizontal models of R&D investments, the output game is generally assumed to be simultaneous. Here, however, the vertical structure of the market implies that sellers are Stackelberg leaders.12
3.1 Output stages
We begin with the third stage where buyers decide non-cooperatively on their output, guaranteeing the perfectness of the equilibrium. Buyers’s i problem is
where Y/y +...+y . Given that buyers are identical ex ante, they take the same decisions ex post.b1 bm Simultaneous maximization of (1) for i=1,...,m and solving of the m f.o.c. yields
From (2) we derive the inverse demand curve suppliers face
We now turn to the second stage of the game, where suppliers decide non-cooperatively on their output, based on the derived inverse demand of downstream firms (3). Supplier i solves the following problem:
ysi ' m(a&r&s)%(1%(m&1)h%mv)' m i'1xbi%m(n&(n&1)h%v)xsi%m(&1%2h%v)' n j…ixsj w(mn%m%n%1) Y ' mn(a&r&s)%n(1%(m&1)h%mv)' m i'1xbi%m(1%(n&1)h%nv)' n i'1xsi w(mn%m%n%1) p ' (m%n%1)a%mn(r%s)&n(1%(m&1)h%mv)' m i'1xbi&m(1%(n&1)h%nv)' n i'1xsi mn%m%n%1 . t ' m(a&r%ns)%(1%(m&1)h&mnv)' m i'1xbi&m(1%(n&1)h&v)' n i'1xsi m(n%1) .
Bbi ' (p($)&cbi($))ybi($)&uxbi2. Bsi ' (t($)&csi($))ysi($)&uxsi2.
Note that t depends on the number of downstream firms; this is due to the presence of R&D. In the absence of R&D, 13
with a linear demand (and also with a log-linear demand), t is independent of m (Choe, 1998).
simultaneous solving of the n f.o.c. yields
Given that each unit bought from suppliers is transformed into one unit sold by buyers to consumers, total output is the same for upstream and downstream industries. Total output is
and the final price is
The price charged by suppliers is13
3.2 R&D stage
In the first stage of the game all firms decide simultaneously on R&D levels. Whereas output is always chosen non-cooperatively, four types of cooperation (TOC) will be considered for R&D decisions: a non-cooperative equilibrium (NCE), a generalized cooperative equilibrium (GCE), a horizontal cooperative equilibrium (HCE), and a vertical cooperative equilibrium (VCE). Figure 1 illustrates the different TOC. Note that in all four environments the source and destination (and also the level) of spillovers is independent of the TOC. That is, even when there are cooperating groups of firms, spillovers originate and end at individual firms. This is in contrast to empirical modelisation, where spillovers originate from industries.
[Figure 1 here]
Horizontal cooperation (HC) represents cooperation with competitors, while vertical cooperation (VC) represents cooperation with suppliers/distributors. Generalized cooperation (GC) reflects the complexity of some research joint ventures: with the multiplication of research projects, firms may be adopting more than one structure simultaneously. Firms may engage in HC on one project, and in VC on another project. Many cooperative agreements involve both horizontal and vertical linkages. For instance, cooperation with a competitor may involve working with its suppliers.
Let$/{x ,...,x ,x ,...,x }. Using the results of the second and third stages, we can write profitb1 bm s1 sn functions as functions of $. The profit of buyer i is
Maxx bi Bbi Maxx si Bsi xsiNC ' m 2(1%m)(h%v%n&hn)(a&r&s) (NC xbiNC ' n(1&h&m 2%hm2&hmn&vmn&m2n%hm2n)(&a%r%s) (NC
(NC ' &hm2%h2m2&vm2%hvm2&hm3%h2m3&vm3%hvm3%n&2hn%h2n%hmn
&h2mn%vmn&hvmn&2m2n%4hm2n&3h2m2n&2hvm2n&v2m2n&m3n%hm3n
&h2m3n&vm3n&hvm3n&v2m3n&hmn2%h2mn2&vmn2%hvmn2&m2n2
%hm2n2&h2m2n2&vm2n2&hvm2n2&v2m2n2&2hm3n2%2h2m3n2&2vm3n2
%2hvm3n2%uw(m%2m2%m3%2mn%4m2n%2m3n%mn2%2m2n2%m3n2) Max$ 'mi'1Bbi % 'ni'1Bsi xbiGC ' &(1&h%hm%vm)n(1%m%n)(a&r&s) (GC xsiGC ' m(1%m%n)(1&h%hn%vn)(&a%r%s) (GC
The Salant and Shaffer (1998) critique of the use of symmetric R&D strategies does not apply here, because there are 14
no side payments and there is only one output market. Moreover, the very idea of side payments goes counter to the pre-competitive nature of R&D collaboration.
Under all TOC, R&D expenditures depend on the sum r+s, not on the distribution of these two activities between 15
upstream and downstream firms. Therefore, changes in the frontiers of firms have no effect on R&D or welfare, subject to the fact that the constraint of nonnegativity of costs is nonbinding.
(4)
(5)
(6)
In the first TOC, the NCE, each firm chooses its R&D so as to maximize its own profits, given that other firms do the same. The problem of buyer i is
and the problem of seller i is
Maximization and simultaneous solving of the m+n f.o.c. of (4) and (5) yield research efforts in the NCE by each buyer and each seller:14 15
where
In the GCE each firm chooses its R&D to maximize the total profits of all firms:
Maximization of (6) with respect to x , i=1,...,m and x , i=1,...,n yields research efforts in the GCE:bi si
(GC ' m&2hm%h2m%m2&2hm2%h2m2%n&2hn%h2n%2mn&2h2mn
%4vmn&4hvmn%4hm2n&3h2m2n%4vm2n&2hvm2n%v2m2n%h2m3n%2hvm3n
%v2m3n%n2&2hn2%h2n2%4hmn2&3h2mn2%4vmn2&2hvmn2%v2mn2
%2h2m2n2%4hvm2n2%2v2m2n2%h2mn3%2hvmn3%v2mn3 &uw(1%2m%m2%2n%4mn%2m2n%n2%2mn2%m2n2) Maxx b1,...,xbm ' m i'1 Bbi Maxx s1,...,xsn ' n i'1 Bsi xbiHC ' (1&h%hm%vm)n 2(&a%r%s) (HC xsiHC ' m(1%m)(1&h%hn%vn)(&a%r%s) (HC
(HC ' m&2hm%h2m%m2&2hm2%h2m2%2hmn&2h2mn%2vmn&2hvmn%2hm2n
&2h2m2n%2vm2n&2hvm2n%n2&2hn2%h2n2%2hmn2&h2mn2%2vmn2%v2mn2
%2h2m2n2%4hvm2n2%2v2m2n2&uw(1%2m%m2%2n%4mn%2m2n%n2%2mn2%m2n2)
Maxx
bi,xsi Bbi%Bsi
xbiVC ' (n
2%vn2%n3%hn3%2vn3%n4&hn4)(a&r&s)
(VC xsiVC ' n(n%vn%n
2%hn2%2vn2%n3&hn3)(a&r&s)
(VC
(7)
(8)
(9)
In the HCE there is intraindustry cooperation but no interindustry cooperation. Buyers solve
and sellers solve
Simultaneous solving of the m+n f.o.c. of (7) and (8) yields research efforts in the HCE:
where
In the VCE there is interindustry cooperation, but no intraindustry cooperation. Each buyer cooperates with one seller, but buyers do not cooperate among themselves, nor do sellers. Given that buyers are identical, as well as sellers, it is irrelevant which buyer cooperates with each seller. The VCE requires m=n to exclude asymmetric strategies. Without loss of generality, let bi cooperate with si, i=1,...,m (m=n). Firms bi and si maximize
Following the maximization of (9) we find research efforts in the VCE to be
(VC ' &2n2%2hn2&2vn2%2hvn2&2n3&2hn3%2h2n3&6vn3%2hvn3&2v2n3&2n4
%2hn4&4h2n4&2vn4&6hvn4&4v2n4&2hn5%2h2n5&2vn5%2hvn5
%uw(n%4n2%6n3%4n4%n5)
Note that we focus on R&D output, not effective (produced+received) R&D. While the latter is more meaningful from 16
a social point of view, R&D output is more amenable to empirical testing. Moreover, in this type of model there is generally a monotonic relationship between effective spillovers and welfare, therefore the welfare analysis implicitly addresses effective spillovers.
This figure, and all other numerical simulations in the paper, are based on the following numerical parameterization 17
of the model: a=1000, w=1, r=s=50, u=600.
The following sections analyse the results derived above. 4. Comparative statics
The question addressed in this section is: what is the effect of changes in vertical and horizontal spillovers on R&D and welfare, under different TOC? This analysis is performed in a bilateral duopoly16
framework. Proposition 1 summarises the effects of spillovers on R&D and welfare. Proposition 1. Let m=n=2. Then
i) Vertical spillovers always increase R&D by all firms, as well as welfare.
ii) Horizontal spillovers increase R&D by all firms in the GCE and the HCE, and reduce R&D by all firms in the NCE and the VCE.
iii) Horizontal spillovers increase welfare in all three cooperative equilibria (even when they reduce R&D), and have an ambiguous effect on welfare in the NCE.
iv) A simultaneous and equal increase in horizontal and vertical spillovers (starting from the same level) reduces x and increases x in the NCE (with an ambiguous effect on total R&D), and increasesbi si R&D by all firms in all other TOC.
v) In the NCE and the VCE, v reinforces the negative effect of h, and h mitigates the positive effect of v. In the GCE and the HCE, h and v reinforce the positive effects of each other.
Table 1 summarizes the comparative statics of the model. Comparative statics are obtained by substituting m=n=2 into the solutions for R&D and performing the relevant differentiations. Figure 2 illustrates the effect of h and v on total R&D.17
Vertical spillovers can have a (negligible) negative effect on a firm. When v increases, the flow of spillovers to the firm 18
from its suppliers/distributors increases, but the same also applies to competitors. When firms are identical, the positive effect of the reduction in own cost dominates the marginal negative effect of the reduction in competitors’ (and the competitors’ suppliers) costs. In a situation with strong asymmetries between firms, it could be the case that small firms lose from v, because most of the benefits go to their competitors, deteriorating further their initial cost disadvantage. Moreover, when a large firm has many suppliers, suppliers may worry about information leakage to the buyer, since this information may go to the supplier’s competitors. Such a concern has arisen within SEMATECH (the Semiconductor Manufacturing Technology Consortium), where Semiconductor materials and equipment suppliers sharing information with SEMATECH members feared of information leakage to their competitors (Grindley et al., 1994).
In the case of the derivatives Mx /Mh and Mx /Mh, it could not be formally proved that they are always negative, however
19 VC VC
bi s i
numerical simulations show that whenever any of them is positive at least one of the nonnegativity constraints on costs is violated.
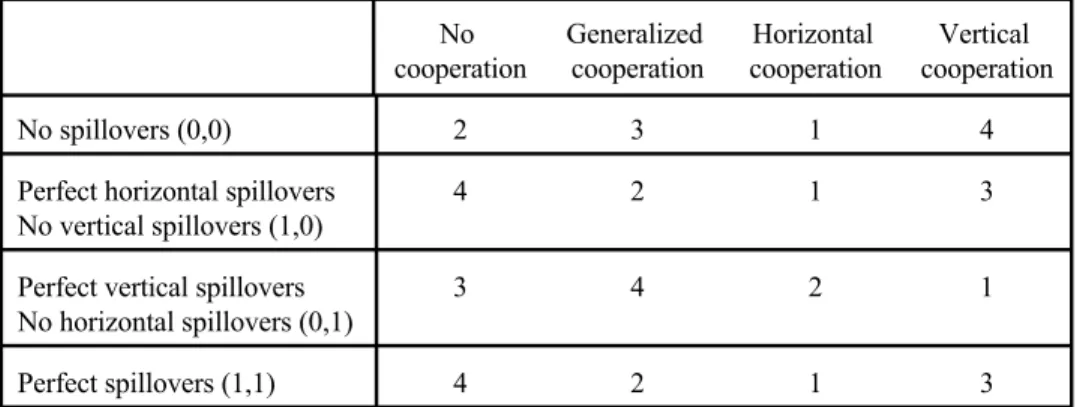
Table 1- Summary of comparative statics (m=n=2)
No Generalized Horizontal Vertical
cooperation cooperation cooperation cooperation
Mx /Mvbi + + + + Mx /Mvsi + + + + MW/Mv + + + + Mx /Mhbi - + + -Mx /Mhsi - + + -MW/Mh ± + + + Mx (h=g)/Mhbi - + + + Mx (h=g)/Mhsi + + + + MX(h=g)/Mh ± + + + M X/MhMv2 - + +
-An increase in v increases R&D by all firms, in all equilibria. As v increases, the flow of spillovers between the two industries increases, reducing the costs of all firms; this reduction in costs translates into an increase in output. This increase in output increases the value of cost reduction, inducing a further increase in R&D. In contrast to h, vertical spillovers benefit all firms, and induce no disincentives for cost reduction.18
In the NCE and the VCE, an increase in h reduces the private benefit from R&D, thereby reducing R&D by all firms. However, vertical cooperation reduces the negative effects of horizontal19
spillovers. Formally, in general we have that *MX /Mh*<*MX /Mh*: horizontal spillovers reduce R&DVC NC spending less under vertical cooperation than under no cooperation. With vertical cooperation, cost reduction is more highly valued, therefore leakages to competitors reduce R&D to a lesser degree than in the absence of cooperation. In the GCE and the HCE, there is intraindustry cooperation, and, consequently, the positive externality is internalized: an increase in h increases R&D by all firms.
Note the asymmetric effects of spillovers on R&D: MX/Mh<0 when there is no intraindustry cooperation (NC or VC), whereas MX/Mv>0 even without interindustry cooperation (NC or HC).
Steurs (1994,1995) finds that the total effect of an increase in intra and interindustry spillovers is ambiguous, and is 20
more likely to be positive for lower levels of spillovers.
Steurs (1994,1995) also finds that spillovers between demand independent industry, although they affect R&D 21
positively, reinforce the negative effect of intraindustry spillovers.
Consider next the effect of a simultaneous and equal increase in vertical and horizontal spillovers (dh=dv). Here h and v increase equally and simultaneously, assuming they are initially at the same level. This result is useful in a context where (desirable) leakage of information to suppliers implies the (undesirable) leakage of the same information to competitors. That effect is obtained by setting h=v and differentiating with respect to the spillover level. As table 1 shows, in the three cooperative equilibria all firms increase their R&D. In the NCE, buyers decrease, and sellers increase, their R&D. Remember that, in the NCE, an increase in (only) v increased R&D by all firms whereas an increase in (only) h decreased R&D by all firms. This means that, when both types of spillovers increase simultaneously, the positive effect of v dominates for sellers, while the negative effect of h dominates for buyers. The effect on total R&D is ambiguous, depending on which dominates between the increase in R&D by sellers and the decrease in R&D by buyers.20
However, further analysis shows that the effect of a simultaneous increase in h and v in the NCE and the VCE tends to become negative as competition intensifies, due to the negative effect of non internalized h on R&D. Therefore, when the diffusion of technological information to vertically related firms makes this information available to competitors, and this (horizontal) externality is not internalized, it is preferable to limit the diffusion of information.
There is an -asymmetric- interaction between the effects of h and v. In the NCE and the VCE, M X/MhMv<0, meaning that v reinforces the negative effect of h, and that h mitigates the positive effect2 of v. In this case not only does h reduce R&D, but it also mitigates the positive effect of v. In the GCE21
and the HCE,M X/MhMv>0: h and v reinforce the positive effects of each other.2
The effects of appropriability on profits and welfare depends on who benefits from information leakages (competitors or vertically related firms) and the prevailing TOC. In all three cooperative equilibria, an increase in h always increases profits, consumer surplus and welfare. This is true even thoughMX /Mh<0. In the NCE, MW /Mh 0 even though MX /Mh<0. At low levels of h, increases in hVC NC >< NC benefit firms and consumers. This suggests that appropriability problems that induce firms to refrain from innovating are not necessarily undesirable, given that this loss in innovation is more than compensated for by the increase in knowledge received by other firms. For very high levels of h, however, the reduction in R&D is so drastic that welfare suffers. In some cases, firms may be benefiting from the increase in h at the expense of consumers. Thus, the effect of changes in h on welfare depends on its initial level. This analytical ambiguity of the effect of h on prices and costs is in contrast to the empirical finding that spillovers generally induce output expansions and price reductions.
On the other hand, in all TOC, an increase in v always increases profits, consumer surplus, and welfare. These findings are consistent with those of Peters (1995) and Steurs (1994,1995).
5. Comparison of cooperative structures
H / MBb2 Mxb1 % MBb1 Mxb2 % MBs2 Mxs1 % MBs1 Mxs2 V / MBs1 Mxb1 % MBs2 Mxb2 % MBb1 Mxs1 % MBb2 Mxs2 > 0 D / MBs2 Mxb1 % MBs1 Mxb2 % MBb2 Mxs1 % MBb1 Mxs2 > 0
is important given that in the literature, most studies have focussed on comparing cooperation vs. no cooperation. However, the choices firms face with respect to R&D cooperation are much more complex than this binary decision. Firms must decide not only whether to cooperate or not, but also with whom to cooperate. Two important potential partners for cooperation are competitors and suppliers/customers. The four types of R&D cooperation studied in this paper are: no cooperation, horizontal cooperation, vertical cooperation, and generalized (simultaneous horizontal and vertical) cooperation. They have been explained in detail in section 3.
R&D cooperation induces firms to internalize the effect of their R&D expenditures on the profits of their partners. Let a “competitive externality” represent the marginal effect of the R&D of a firm on the profits of other firms (this effect is generally non-nil, even when there are no spillovers). In this model there are three types of competitive externalities: the horizontal competitive externality (H), the vertical competitive externality (V), and the diagonal competitive externality (D). H represents the sum of the marginal effects of a firm’s R&D on the profits of its competitors; this externality is internalized in the HCE and the GCE. H can be positive or negative, depending on whether an increase in R&D by a firm increases or decreases the profits of its competitors. H increases with horizontal spillovers, and generally also with vertical spillovers. V represents the sum of the marginal effects of a firm’s R&D on the profits of its customers/suppliers; this externality is internalized in the VCE and the GCE. It is positive, given that an increase in R&D by a firm always increases the profits of its customers/suppliers. D represents the sum of the marginal effects of a firm’s R&D on the profits of firms in the other industry, which are neither competitors nor customers/suppliers; this externality is always positive, and is internalized in the GCE only. V and D are always positive, but are larger when horizontal and vertical spillovers are higher. No competitive externalities are internalized in the NCE. The following lemma characterizes the relation between competitive externalities and the ranking of TOC.
Lemma 1. Let m=n=2. Let the horizontal competitive externality H be given by
Let the vertical competitive externality V be given by
Let the diagonal competitive externality D be given by
Then, between any two TOC, the one internalizing a larger (more positive) sum of competitive externalities will yield more R&D.
Proof. The inclusion of positive (negative) externalities in the first order condition of a firm increases (decreases) its R&D, given that the profit of a firm is concave in its own R&D.
Boivin and Vencatachellum (1998) develop a related concept of a competitive externality given by My /Mx . They show 22
j i
that this externality is of the same sign as MB /Mx when demand is linear.j i I am indebted to Caroline Boivin for suggesting this line of analysis. 23
yielding more R&D will be the one which internalizes a larger sum of competitive externalities. This22
is because internalizing a positive competitive externality increases R&D, while internalizing a negative competitive externality reduces R&D. This result is quite general, and can be particularly useful in23
comparing different cooperative structures even when no closed form solutions exists or that the levels of R&D investments are not known. In what follows we use those three competitive externalities to analyse the classification of TOC.
Before proceeding with the analysis it will be useful to restate the basic result of the strategic investment literature, that with low horizontal spillovers R&D competition yields more innovation than (horizontal) R&D cooperation. When h is high, information leakage is important, and firms underinvest. Consequently cooperation induces them to internalize this positive externality, and R&D is increased. On the other hand, when h is low, information leakage is negligible, and the private gains from R&D outweigh the spillover. Accordingly firms give less weight to the spillover, and overinvest in R&D. In this context intraindustry cooperation reduces R&D, since firms internalize this negative externality. As the analysis to follow will show, accounting for vertical spillovers and vertical cooperation can seriously alter this result.
The analysis starts in a bilateral duopoly framework, and the effect of market structure is introduced later. The following proposition summarizes the ranking of TOC when m=n=2.
Proposition 2. Let m=n=2. Then
a) X >X .VC NC b) X >X .GC HC c) sign(X -X )=sign(1-h).VC HC d) sign(X -X )=sign(1-11h-10v).NC GC e) sign(X -X )=sign(13-23h-10v).NC HC f) sign(X -X )=sign(7h+5v-2).GC VC
Proof. These results follow from lemma 1. They can also be obtained by analysing the differences between total R&D expenditures under pairs of TOC.
Part a of proposition 2 states that X >X . In the NCE no competitive externality is internalized.VC NC In the VCE firms internalize the vertical competitive externality, which is always positive, pushing R&D up. When v>0, firms internalize the effect of their R&D on the production cost and the profits of their customer/supplier. Even when v=0, firms internalize the effect of their own cost reduction on the increase in the size of the market and profits of their customer/supplier, thus increasing their R&D compared with the NCE.
Part b of proposition 2 compares the GCE with the HCE. In all cases X >X . GeneralizedGC HC cooperation internalizes V, H, and D, while horizontal cooperation internalizes H. Taking the difference between the two, (V+H+D)-H=V+D>0: generalized cooperation dominates horizontal cooperation because it internalizes the same horizontal externality (which may be positive or negative, but this is
irrelevant here) and, in addition, internalizes the positive V and D.
Part c of proposition 2 compares HC with VC. VC dominates, except when h=1, where X =X .VC HC
VC internalizes V, while HC internalizes H. When horizontal spillovers are low, H is negative (because an increase in R&D by a firm reduces the profits of its competitor), therefore V>H. But even when horizontal spillovers are high, so that H>0, V is larger than H: the vertical competitive externality internalized through vertical cooperation is larger than the horizontal competitive externality internalized through horizontal cooperation. It is only when h=1 that the two TOC yield equal levels of R&D.
The relation between the NCE and the GCE (part d of proposition 2) depends on the levels of h and v. When h and v are very low, NC dominates, because in that case cooperation between competitors reduces R&D. The negative horizontal effect dominates the positive vertical and diagonal effects: *H*>V+D. When h and v are high, the horizontal competitive externality (H) becomes less negative, and eventually positive, therefore V+D+H>0. In that case XGCE>XNCE. However, contrary to the established result in the literature, that increase comes for levels of horizontal spillovers much smaller than h=1/2. In fact, as proposition 2 establishes, even when h=0, GC can increase R&D. This is due to the presence of the vertical and diagonal competitive externalities, which may dominate the negative H when horizontal spillovers are low.
Part e of proposition 2 states that X >X when h and v are low, while the inequality is reversedNC HC for high spillovers. HC increases R&D compared to NC when H>0, that is, when the horizontal competitive externality internalized through horizontal cooperation is positive. As explained above, a low h induces overinvestment in the NCE, therefore HC reduces R&D; conversely, a high h induces underinvestment in the NCE, therefore HC increases R&D.
The effect of v is novel, however, and needs to be explicited. HC is more likely to increase R&D when v is high. This result can be understood in terms of the strategic interaction of research efforts. In the NCE and the HCE, buyers’ research expenditures are strategic substitutes iff 7>11h+4v, and sellers’ research expenditures are strategic substitutes iff 1>2h+v. R&D cooperation between firms whose research efforts are strategic substitutes (complements) decreases (increases) R&D. v contributes to strategic complementarity between competitors: a higher v increases the benefit a firm extracts from its competitor’s R&D, trough the effect of that R&D on the cost of the customer/supplier of the firm. For instance, an increase in x benefits b1 directly through h, but also indirectly through the reduction in cb2 s1 (the cost of the supplier of b1) induced by v. As vertical spillovers contribute to horizontal strategic complementarity, they reduce the level of horizontal spillovers required for HC to increase R&D. In other words, with high vertical spillovers, horizontal cooperation can increase R&D even with low horizontal spillovers. This result is contrary to what is established in the literature, and shows the importance of accounting for vertical spillovers in the analysis of R&D cooperation.
Part f of proposition 2 states that when spillovers are very low, VC dominates GC, while this relation is reversed for moderate and high spillovers. VC internalizes V, while GC internalizes, H, V and D. Therefore, X >X iff H+V+D>V, i.e. iff H+D>0. When spillovers are low, H is negative, andGC VC dominates the positive D: the negative effect of internalizing the horizontal competitive externality dominates the positive effect of internalizing the diagonal competitive externality. As horizontal and vertical spillovers increase, H becomes less negative, and eventually positive, therefore for high spillovers X >X .GC VC
Note that at v=0 and h=1/2, X >X , while the literature would predict equality between the two TOC in that case.
24 NC HC
The reason is that in this model buyers and sellers have different conditions of strategic interaction (as specified above). The line determining strategic interaction for buyers (7-11h-4v) in the NCE and the HCE lies slightly to the right of the line separating regions 3 and 4 (13-23h-10v), while the line determining strategic interaction for sellers (1-2h-v) lies slightly to the left of that line. In fact, the line separating regions 3 and 4 can be expressed as a linear combination of the lines determining strategic interaction for buyers and sellers, since (7-11h-4v)+6(1-2h-v)=13-23h-10v. Therefore, at v=0 and h=1/2, the passage from NC to HC does not change sellers’ R&D, but decreases buyers’ R&D, therefore total R&D decreases. On the line separating regions 3 and 4, the passage from NC to HC increases sellers’ R&D and decreases buyers’ R&D by offsetting amounts.
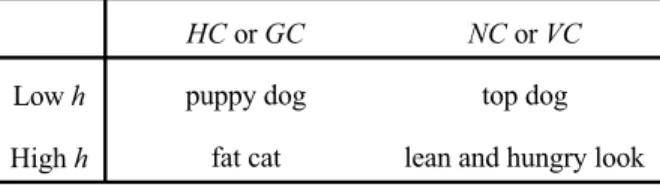
The comparisons in proposition 2 have been performed pairwise. It is useful to be able to rank all TOC for given levels of spillovers. Figure 3 illustrates the ranking of TOC in the hxv space, based on the conditions stated in proposition 2. This figure is divided into 5 regions, each region being characterized by a ranking of the TOC. The following table summarizes the relation between the competitive externalities and the magnitude and sign of H in each region.
[Figure 3 here]
Table 2 - Ranking of types of cooperation
Region Spillovers’ values Competitive externalities Magnitude
(fig. 3)
Ranking of TOC Sign of H
of H Region 1 v<(1-11h)/10 VC>NC>GC>HC V>0>V+H+D>H *H*>V+D H<0 Region 2 (1-11h)/10<v<(2-7h)/5 VC>GC>NC>HC V>V+H+D>0>H *H*>D H<0 Region 3 (2-7h)/5<v<(13-23h)/10 GC>VC>NC>HC V+H+D>V>0>H *H*<D H<0 Region 4 v>(13-23h)/10, h…1 GC>VC>HC>NC V+H+D>V>H>0 H<V H>0 Region 5 h=1 GC>VC=HC>NC V+H+D>V=H>0 H=V H>0
Region 1 is characterized by low spillovers. In this region VC>NC>GC>HC. H is negative and sufficiently large to cause the GCE to reduce R&D compared to the NCE. As spillovers increase, we move into region 2, where the ranking of GC and NC is reversed: VC>GC>NC>HC. H is still negative enough to outweigh D (therefore X <X ), but not negative enough to outweigh V+D (thereforeGC VC
X >X ). As spillovers increase further, we move into region 3, where GC comes to dominate all otherGC NC
TOC. H is still negative, but is smaller than D, therefore X >X . When spillovers increase further, weGC VC move into region 4: the horizontal competitive externality becomes positive, therefore X >X .HC NC 24 Finally, when h=1 (region 5), and independently of v, the horizontal competitive externality increases further: H=V, therefore X =X .HC VC
As we move north-east (i.e. as spillovers increase), the ranking of VC and NC deteriorates, while the ranking of GC and HC improves. It is surprising that as vertical spillovers increase, the ranking of VC deteriorates, as it becomes dominated by GC, which has the advantage of allowing competitors to cooperate, and of inducing a firm to internalize the effect of its R&D on all the firms in the other industry, and not only on its own supplier/customer (as would be the case with VC). Note that for the largest part of the spillovers space, GC dominates all other TOC, followed by VC. This shows the importance of interindustry cooperation, whether there is intraindustry cooperation or not. VC is a
This is in accord with the following quote by Jorde and Teece: “Successful new product and process development 25
innovation often requires horizontal and lateral as well as vertical cooperation.” (Jorde and Teece, 1990:81). Jorde and Teece (1992) note that horizontal and hybrid (horizontal + vertical) cooperative arrangements face a larger degree of uncertainty from US antitrust laws.
Numerical simulations are based on the numerical parameterization specified in note 17. 26
On figure 4 curves may overlap for some values of m and n. The labelling of curves corresponds to their ranking at 27
m=n=20, but not necessarily to their ranking at other values of m and n.
complement, not a substitute, to HC.25
Many important results emerge from the preceding analysis. First, one of the basic results of the strategic investment literature is that cooperation between competitors increases (decreases) R&D when horizontal spillovers are high (low). The model shows that this result does not necessarily hold when vertical spillovers and vertical cooperation are taken into account. It is necessary to account for the horizontal, vertical, and diagonal internalization effects in comparing different types of R&D cooperation. Second, even if all forms of cooperation do not always increase R&D compared with the NCE, in all cases, at least one form of cooperation does. The only form of cooperation always (strictly) dominating the NCE is VC. The question of whether cooperation is desirable or not has to be addressed with reference to specific cooperative schemes. Third, no TOC constantly dominates the others. The relative efficiency of different TOC cannot be studied without explicit reference to appropriability. This suggests that optimal structures may vary i) across industries, ii) within the same industry, for different technologies having different appropriability characteristics, and iii) over time for a given industry, as technology changes. Finally, comparing parts a and e of proposition 2 shows that there is an important asymmetry between HC and VC. VC is beneficial irrespective of the level of spillovers, whereas whether HC is beneficial depends on both horizontal and vertical spillovers. This is because the vertical internalization effect is always positive, while the horizontal internalization effect may be positive or negative.
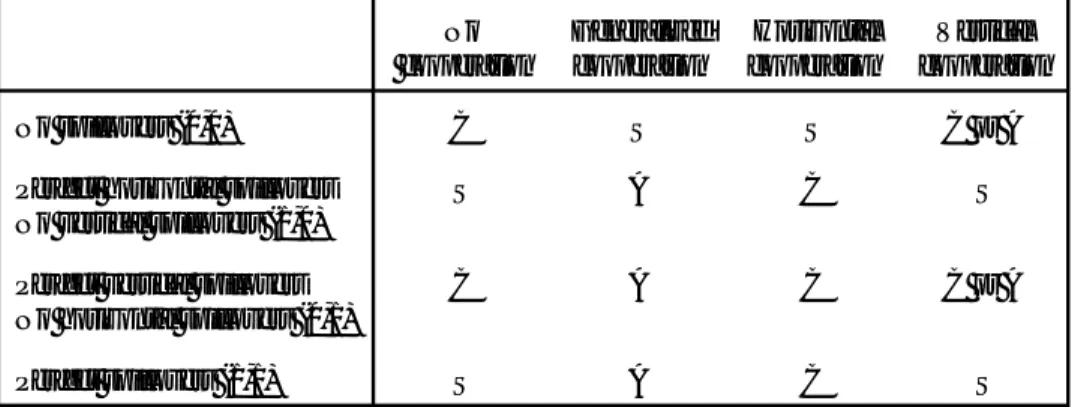
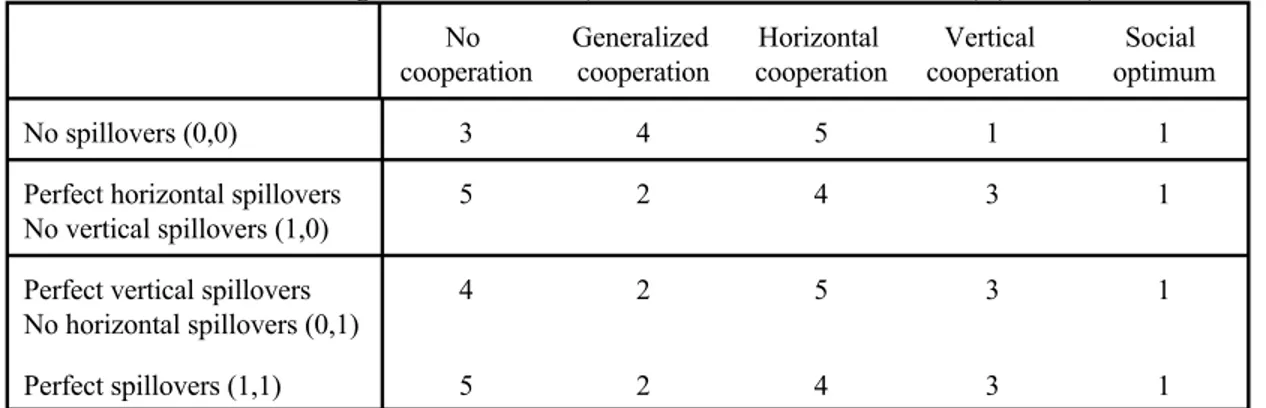
The comparison between TOC has been performed in a bilateral duopoly case. A legitimate question is how sensitive are the results to this specific market structure. As the analysis to follow shows, market structure affects the size of the gap between R&D expenditures, and affects the tradeoff between horizontal and vertical cooperation. To answer that question, we perform the comparison between TOC for a more general market structure: m=n0[1,20]. While it is possible to study this question for all levels of m and n within the space defined above, the VCE requires m=n. For the purpose of comparability between TOC, the analysis is restricted in this section to the case m=n. Moreover, in order to reduce the dimensionality of the problem, the analysis is restricted to polar appropriability environments: no spillovers (h=v=0), perfect spillovers (h=v=1), perfect horizontal spillovers only (h=1,v=0), and perfect vertical spillovers only (h=0,v=1). For brevity’s sake let (h,v) represent appropriability conditions. For each polar case of spillovers, R&D is ranked across TOC, allowing for a variable market structure. Numerical simulations are used to compare (not to generate, therefore there is no loss of generality) elaborate analytical expressions. While it is possible to compare directly the analytical expressions,26
numerical simulations make the presentation of results, and the comparison between different TOC much smoother. Figure 4 compares TOC for a given appropriability environment.27
The same can be said about GC. Moreover, the dominance of the diagonal effect -which may induce cooperation 28
between competitors to increase innovation even with a low h- on direct vertical effects can be seen from the large difference between XGCand X , compared with the small difference between XNC VCand X , on figure 4c.NC
The social optimum could be defined with respect to the levels of output and R&D maximizing the sum of producer 29
and consumer surplus. However, Suzumura (1990) questions the relevance of this “first best” outcome, since governments may have more latitude in affecting firms’ R&D decisions than in affecting their output decisions. Suzumura adopts a “second best” concept of the social optimum, where welfare is maximized with respect to R&D, but not with respect to output. This second best social optimum concept is used here.
The ranking of TOC at m=n=2 on figure 4 is consistent with proposition 2, and will not be discussed again. However, two important insights come from the analysis of a more general market structure. First, figure 4 illustrates an important distinction between horizontal and vertical cooperation in terms of the magnitudes of the increases and reductions in R&D investments (compared to the NCE) they cause. VC always increases R&D, while HC may increase or decrease R&D. However, when HC is beneficial, its benefits compared with the NCE are much larger than the benefits of VC, which are marginal. Formally, in general *X -X *>*X -X *. This is because the internalization of horizontalHC NC VC NC spillovers changes the sign of the externality, whereas the internalization of v merely reinforces its (always positive) effect, without changing its sign. Therefore, even though VC is always beneficial, it is generally only marginally so. In contrast, when HC is beneficial, its benefits are substantial.28
Second, as figures 4b and 4d show, when h=1, X =X for m=n=2, but X <X for all m=n>2.VC HC VC HC Therefore the result obtained above that in the bilateral duopoly case XVC$X is heavily dependent uponHC market structure. With m=n=2, horizontal effects are negligible because of the small number of firms, and the two TOC yield equal amounts of R&D. However, as competition intensifies the importance of the horizontal externality increases, and HC, which internalizes this externality, gains in importance. To see that, note that in a market with m=n firms in each industry, the number of terms constituting H is 2m(m-1), while the number of terms constituting V is 2m. As m increases, the number of terms constituting H grows much more rapidly (of course the magnitudes of the terms matter, but their number is indicative of the relative importance of the two effects). Thus, the model provides a preliminary answer to the question of which is more socially beneficial between horizontal and vertical cooperation. When horizontal spillovers are low, VC yields more R&D than HC. When horizontal spillovers are high, the result depends on market structure: VC tends to dominate when m=n=2, but HC yields more R&D for m=n>2 (moreover, with high concentration HC is more likely to lead to collusion, but this is outside the scope of the model).
This result shows the importance of analysing the effect of market structure on the relative desirability of different TOC. For instance, Steurs (1995), who studies spillovers and cooperation between demand unrelated industries, finds that whether interindustry cooperation is more or less beneficial depends on spillovers: interindustry cooperation is likely to be more beneficial than intraindustry cooperation when interindustry spillovers are high and intraindustry spillovers are low. Here, it is also true that interindustry cooperation is more beneficial when intraindustry spillovers are low. However, when intraindustry spillovers are high, the result depends on market structure.
A related question is how cooperation affects welfare. Overall there is a monotonic relation between R&D spending and welfare. A notable exception is when there are no spillovers, where firms tend to overspend on R&D compared with the social optimum in the NCE and the VCE. Namely, firms29