HAL Id: sic_00001405
https://archivesic.ccsd.cnrs.fr/sic_00001405
Submitted on 10 Apr 2005HAL is a multi-disciplinary open access archive for the deposit and dissemination of sci-entific research documents, whether they are pub-lished or not. The documents may come from teaching and research institutions in France or abroad, or from public or private research centers.
L’archive ouverte pluridisciplinaire HAL, est destinée au dépôt et à la diffusion de documents scientifiques de niveau recherche, publiés ou non, émanant des établissements d’enseignement et de recherche français ou étrangers, des laboratoires publics ou privés.
Mining Textual Data through Term Variant Clustering :
the TermWatch system
Fidelia Ibekwe-Sanjuan, Eric Sanjuan
To cite this version:
Fidelia Ibekwe-Sanjuan, Eric Sanjuan. Mining Textual Data through Term Variant Clustering : the TermWatch system. Recherche d’Information Assistée par Ordinateur (RIAO 2004)., 2004. �sic_00001405�
Mining Textual Data through Term Variant Clustering : the TermWatch system
IBEKWE-SANJUAN Fidelia
1& SANJUAN Eric
21 ERSICOM, University of Lyon 3 2 LITA, University of Metz
4, cours Albert Thomas, 69008 Lyon Ile de Saulcy, 57047 Metz
[email protected] [email protected]
Abstract.
We present a system for mapping the structure of research topics in a corpus. TermWatch portrays the "aboutness" of a corpus of scientific and technical publications by bridging the gap between pure statistical approaches and symbolic techniques. In the present paper, an experiment on unsupervised textmining is performed on a corpus of scientific titles and abstracts from 16 prominent IR journals. The preliminary results showed that TermWatch was able to capture low occurring phenomena which the usual clustering methods based on co-occurrence may not highlight. The results also reflect the expressive power of terminological variations as a means to capture the structure of research topics contained in a corpus.
1. Introduction
In the context of specialized information retrieval (SIR), expert users need to understand the layout of important topics in their domain in order to carry out an efficient science and technology watch (STW), textmining (TM) or acquire some competitive intelligence (CI). This is a case of specialized information retrieval where the type of information returned is not just a list of documents but a map of domain topics and their links with one another. Methods used for processing relevant corpora are mostly based on data analysis techniques relying solely on statistical methods (co-word analysis, Callon et al., 1991, or co-citation analysis, Small 1973). They do not take into consideration other dimensions of relations between important concepts in the texts, relations which are embodied in linguistic phenomena such as morphological, syntactic or semantic variations. For instance, between the terms "communication technology", "communication technology in nigerian print medium", "communication technology in sub-saharan Africa", "communication technology infrastructure", there are other meaningful relations than just co-occurrence. Moreover, it is not certain that the four terms would always co-occur in the same documents. However, all four terms tell us something about "communication technology". The former being the base term from which the other three syntactic variants are derived through expansion operations. We are exploring the usefulness of such linguistic operations as the basis of a clustering system for STW. For the fact that our clustering approach is not based on co-occurrence criterion, this guarantees that rare occurring units well as highly occurring ones are equally considered. Statistical data analysis methods currently applied in the IR field, like factor analysis, Latent semantic analysis (LSA), complete link clustering and k-means start from an occurrence matrix of the index terms in the documents, from which they generate similar clusters. Since these matrix only have few non null values, usually an occurrence threshold is set which inevitable eliminates most of the units from further analysis.
Some attempts have been made to incorporate linguistic processing in text data analysis for science and technology watch purposes. Polanco et al., (1995) incorporated prior linguistic processing in a co-word analysis scheme. However, the objective was to extract from the abstracts, variants of keyco-words issuing from a controlled vocabulary and thus increase the number of occurrences of a particular keyword. Indeed, terms extracted from the texts often portray some variations compared to the reference keywords from a controlled vocabulary. For this purpose, these authors used FASTR, a term variation extractor developed by Jacquemin (2001). We converge with these authors on the necessity to tackle the terminological variation in order to extract meaningful domain concepts from texts for
various applications : automatic indexing, information extraction, question-answering, textmining and topic mapping, the list not being closed.
The TermWatch system takes advantages of research in two separate scientific fields : comptutational terminology, more particularly the works done on terminology variations (see for instance Jacquemin, 2001; Daille, 2003) on the one hand, and data analysis methods through the design of a specific clustering algorithm, on the other. This clustering algorithm, called Classification by Preferentiel
Clustered Link (CPCL) which relies on a graph representation of terms and their syntactic relations,
was first presented in Ibekwe-SanJuan (1998).
Quite a considerable amount of effort has been devoted to research on the use of clustering results for query expansion in the IR field (see Baeza-Yates & Ribeiro-Neto, 1999 for a comprehensive review). One such IR task to which clustering has been applied is query expansion. Similar to our method, some research reported in the IR field perform global clustering1 but their goal is quite different from
trends mapping or texmining. More fundamentally, these methods are based on the 'term document' matrix, thus on co-occurrence.
Our work also differs from text categorization or summarization where the thrust is on automatically detecting the topics of individual texts (Salton et al., 1996). TermWatch works on whole corpora of several thousands words in order to map out the important topics contained therein and show their links with one another. It is also possible to carry out a time series analysis by time-stamping the date of publication of each term.
We have tested the system on three separate corpora to date. The first two were built to satisfy STW needs and come from two different domains : plant biotechnology (Ibekwe-SanJuan, 1998) and breadmaking process (Ibekwe-SanJuan & Dubois, 2002). Both were subjected to expert validation and held promising results. The current corpus is an IR corpus of scientific titles and abstracts published between 1997- 2003 in 16 prominent journals2.
Our aim in building this corpus was to work in a field in which we were quite knowledgeable in order to analyse the results without being dependent on outside expert validation. Indeed, this is quite difficult to obtain outside specific project funding framework. Also, we wished to subject TermWatch to a huge corpus3 in a textmining context, where there is no a priori question. The idea is to test the
capacity of the system to run in a totally unsupervised manner, without filtering the terms extracted from the corpus and to check if the clusters obtained and the mapping produced are thematically relevant. The corpus was made available by the French Institute for Scientific and Technical Information (INIST) to whom we express our gratitude.
First, we present an overview of the TermWatch system (§2), then describe its different processing stages : term extraction followed by terminological variation identification and finally by clustering. In the section (§3), we will present the visual interfaces which enable the user to explore the results of the clustering and discuss settings for the clustering algorithm. Section §4 will illustrate how
TermWatch can highlight the organization of research topics in a field and thus assist STW or
textmining tasks.
2. System architecture
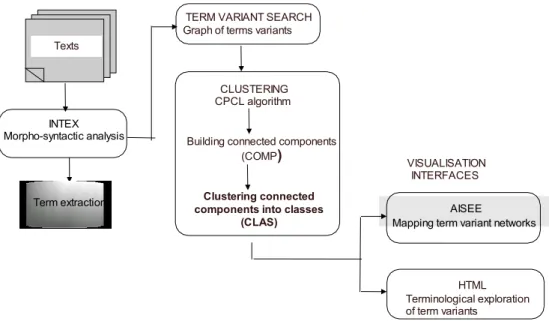
TermWatch comprises two main modules : a term variant identification module and a clustering
module. Two other minor modules ensure the integration of two external tools necessary to perform the whole analysis : a linguistic toolbox for term extraction and a visualization tool. The system architecture is shown in Figure 1.
1 Clustering the whole corpus instead of a subset of relevant documents returned in answer to a user's query. 2 List given in the appendix.
Figure 1. Overall system architecture
2.1 Term extraction
What we seek to extract from texts are terms. Taken in their terminological sense, terms are not just any word, word pairs or phrases. They denote domain concept out of context. In other words, terms are choice linguistic units, rich in information content because they are used by experts in a field to name the objects or concepts of that particular field.
On the linguistic level, terms appear mostly as noun phrases which can occur either in a compound form (wheat flour fractionation) or with a prepositional phrase attachment (fractionation of wheat
flour). There are also terminological verb or prepositional phrases such as "on-line".
Term extraction is performed using the INTEX linguistic toolbox (Silberztein, 1993). The choice of INTEX over existing term extractors was supported by its user-friendly interface which enables us to specify the granularity of the terms we wish to extract. After morphological analysis on the corpus, we defined several morpho-syntactic constraints enabling us to identify sequences that contained potential terms. These constraints are implemented as finite state transducers with decreasing order of complexity, some being embedded in others4. These transducers are applied in an iterative fashion on
the corpus and enable us to extract first complex nominal sequences, which are in turn split into simpler noun phrases (NPs) until we reach the desired result. TermWatch does not need any outside terminological resource for this task. This endogeneous approach is more likely to portray terminological evolution and hence that of domain concepts. Given the following sequence found in the IR corpus :
The model is derived from a constructionist discourse analysis of individuals' account of
everyday life information seeking, (1)
Our extraction rules will yield :
the model (1a)
a constructionist discourse analysis of individuals' account (1b)
individuals' account of everyday life information seeking (1c)
4 A transducer is a graph equivalent to a regular expression. It becomes a "transducer" when, in INTEX, it not only
recognizes forms or patterns but also modifies the text.
AISEE
Mapping term variant networks
TERM VARIANT SEARCH Graph of terms variants
Clustering connected components into classes
(CLAS)
Texts
CLUSTERING CPCL algorithm Building connected components
(COMP) HTML Terminological exploration of term variants VISUALISATION INTERFACES INTEX Morpho-syntactic analysis Term extraction
A complete linguistic analysis seeking to extract all the possible subsequences of noun phrases (NPs) would also extract "a constructionist discourse analysis", "individuals' account" and "everyday life
information seeking". What we are seeking is a medium-grained splitting which allows for the
extraction of complex terms that can reveal the associations between simple domain concepts. From the IR corpus, 47 366 term candidates were extracted.
2.2 Term variant identification
Several studies have established the importance of variations amongst terminological units. Capturing these variations enhances the representation of the actual state of a domain's terminology. This is very useful for building domain lexical resources from corpora (Daille, 2003), automatic indexing (Jacquemin et al., 2002), information retrieval and question-answering (Dowdall et al., 2003).
Variations occur at different linguistic levels making their identification impossible without integrating NLP techniques. There are spelling variants (specialization / specialization), morphological variants (online web access / on line web access / on-line web access ; WWW interface
/ web interface), syntactic variants (information retrieval / retrieval of information / efficient retrieval of information) and finally semantic variants (information retrieval / data access). The subset of
variation phenomena we studied concern syntactic operations which we believe will be useful for our application type (STW task). They involved two types of transformations : syntactic variants involving the addition of nominal words in an existing term called expansions or the substitution of a nominal element in an existing term.
Within these two categories, we distinguished variants along the grammatical axis : variants that affected modifier words in a term and those that affected the head word.
In the term "access structure", the first word is the modifier because it qualifies the last noun "structure ". In other words, modifiers play the role of adjectives in a compound NP while the head word corresponds to the noun focus (the object of discourse). In syntagmatic structures, the head word appears as the last noun before the preposition as in " access structure for similarity based fuzzy
database ", " structure" is the head word, the rest being its modifiers.
Expansions are further subdivided into three types according to the position of the added words :
Left-expansion (L-Exp) is the addition of new modifier words to the left of the term, for instance "equal access to information" is a left expansion of "access to information" while "citation context
ranking result" is an insertion (Ins) variant of "citation result". On the other hand, "knowledge discovery in clinical database" is a right or head expansion (R-Exp) of "clinical database". We also
have cases of left-right expansions (LR-Exp) combining the two elementary types as in "indexing
system" and "faceted indexing system scheme".
Substitutions are divided into two subtypes, modifier substitution (M-Sub) and head substitution
(H-Sub). The former identifies variants of the same length where one and only one modifier word is different : bibliographic hypertext system and bibliographic retrieval system. Likewise, head substitution identifies variants of the same length whose head words are different : information
management in business and business information system.
The rationale in distinguishing modifier variation relations from the head ones is that they do not convey the same information on the linguistic level. Since modifier variations affect the qualifiers of a head word in a term, we can hypothesize that they do not fundamentally change the concept family to which the term belongs. In the relation between "access structure" and its modifier variants "multi
dimensional access structure, access structure for similarity based fuzzy database, suitable access structure", we are still talking basically of the same concept (access structure). Modifier relations
(L-Exp, Ins, M-Sub) enable us to identify the paradigms of the corpus (terms with same head words but with different modifiers). As such they are secondary, though useful to the goal of clustering. They are called COMP because they will be used for building connected components in the clustering procedure. On the other hand, head variation relations involve a shift in the noun focus and thus in the object of discourse. Judge the relation between " classification scheme" and it's head expansions :
application of classification scheme, current use of classification scheme, classification scheme generation. Head variations can contribute more to capture shifts in topics and their associations.
These relations are called CLAS since they are assigned a primary role during clustering, they cluster connected components into clusters of possible domain topics. The variation identification program linked 41 058 terms which were involved in the six variation relations described above, that is 87% of the term candidates. This is consistent with results found on the other two corpora we have worked on where around 83% of the terms were involved in variation relations. The proportion of variants we found are quite high compared to the figures found in other studies (between 15%-35%), reported in Daille (2003). We think that the significant difference is due to our loose definitions of the different syntactic variants. In systems targeting terminology acquisition or update, a more restricted definition of syntactic variants is adopted to ensure that terms and their variants are semantically close. For instance, in Daille (2003) and Jacquemin (2001), head-expansions are not considered as syntactic variants because both terms do not point to the same concept (classification scheme application of
classification scheme), nor are substitutions as we defined them (bibliographic hypertext system
bibliographic retrieval system). We justify our loose definitions by the applications targeted : what
we seek are the linguistic operations that can point to association between domain concepts, not just semantic variants. Although the latter type will necessarily enrich the thematic coherence of our clusters. Moreover, as we will see in a later section (§3.2), it will be necessary in the future to tighten up the definitions of some of our variants like substitutions on binary terms because they generate a lot of noise5.
2.3 Clustering algorithm
This module is based on CPCL (Classification Algorithm by Preferential Clustered Link) already described in Ibekwe-SanJuan (1998). Here, we extend its formal presentation and point out its differences with single link clustering (SLC) technique. CPCL is a hierarchical two-step extractor of clusters from a graph of term variants. One notable attribute of this algorithm is that the clustering begins not at the atomic level (term level), but at the component level. Components are obtained by grouping terms sharing COMP variations. The clustering stage then consists in merging iteratively components that share many variations of the CLAS type. A normalized coefficient is used to indicate the proximity between two components as a function of the number of CLAS relations between them and the proportion of the particular CLAS relation in the graph.
For a better understanding of the algorithm, we will describe it using graph terminology. Let's recall that a graph G is a pair (V,E) where V is a set of vertices and E a set of edges. Clearly, E is a subset of {{u,v} : u,v in V}, the set of couples of elements in V. A connected components of a graph G is a subset C of vertices such that there exists a path between any two elements u, v of this set, (i.e. a sequence of edges (u,v2), (v2,v3) ... (vk, v) such that v2, ...., vk are all in C).
To reduce a huge graph into a readable network, we apply the following procedure : INPUT : a huge graph G = (V, E)
1) select a subset S of edges in E,
2) consider the set VS of connected components of the subgraph (V,S) of G,
3) build a new graph GS = (VS, ES) in which an edge is drawn between two elements I, J in VS
whenever there is an element u in I, and a element v in J such {u,v} is an edge of the initial graph G (i.e. ES = {{I,J}: I, J in VS, there exists e in E such that e intersects I and J}.
4) replace the input G by the reduced graph GS and come back to step one until the reduced graph is
small enough.
Such an approach to graph clustering is very interesting in interactive data analysis and IR tasks since it can be implemented in linear time complexity if there is a clear way to select edges in S. They lead to real time applications.
Here the input of the algorithm is the graph of syntactic variations that we shall denote by L=(T,R). The vertices are the candidate terms extracted from the texts. We draw an edge between two terms if and only if one is a variant of the other. Since this graph is too huge, we need to reduce it in a more readable network. A first idea is to cluster together terms that are linked by relations in COMP, since these variations should relate semantically close terms. From a formal point of view, we consider the graph LCOMP = (TCOMP, RCOMP) whose vertices are the connected components of the subgraph
(T,COMP) of (T,R), and we draw an edge between two of these components each time that there exists a syntactic variation of the type CLASS between them.
The graph LCOMP obtained at this stage is still too huge to be readable. Moreover, the clusters
represented by the connected components of (T,COMP) are not very interesting for a Scientific Watch task since they only show expansions around a unique head.
So we come back to step 1 of the above procedure. We need to define a way to select subset S of edges in ECOMP (thus in CLAS). For that we attach to each edge e={I,J} in ECOMP a similarity index d
(I,J) in the following way:
d(i,j) = { N (I,J) / || : in CLAS}
where is a variation type in CLAS, N (I,J) is the number of variations of type that relate terms in
I to terms in J and || is the total number of variations in . As already mentioned, d is an index that reveals connected components which share a high number of rare variation relations in CLAS.
Once we have defined such a similarity index on a graph, there exists a large variety of data analysis methods to cluster the set of vertices, but only few of them are computationally efficient for large sparse graphs. Sparse graphs have few edges compared to the number of vertices and consequently are difficult to cluster using usual hierarchical and k-means procedures from statistical softwares.6 The
single link clustering (SLC) technique is the most trivial of these computationally efficient methods. Before introducing our solution for clustering this valued graph of connected components, let us recall how SLC works, what its main properties for graph clustering are and why it is not adapted to our case.
The most natural and direct way to select a subset of edges in order to reduce the graph GCOMP is to
choose a threshold s and set S to be the set of edges over s denoted by [d s] (i.e: [d s] ={(I,J) in S:
d(I,J) s}). If this is done iteratively for all the values of d starting from the biggest to the lowest, we obtain the single link clustering (SLC) of the graph based on the similarity d. This process computes as many classifications as the number of values of d. It defines an ultrametric u on GCOMP. Given two
elements I, J of LCOMP, u(I,J) is defined as the inverse of the highest value of d such that I and J are in
the same connected component of L[d s].
We recall from Barthelemy et al., (1984) that an ultrametric is a dissimilarity u on I such that for any
i,j,k in I: u(i,j) max { u(i,k), u(k,j) }. It is well know that every hierarchical clustering process defines an ultrametric and conversely.
SLC has very strong graph and algorithmic properties, among which we mention that it is the best numerical ultrametric upper approximation of d and consequently that the SLC output is unique. Moreover the whole clustering process (i.e. the computing of the SLC ultrametric) can be computed in linear time on the number of edges of the graph. Unfortunately SLC has also major drawbacks in applications related to IR, among which we have the well known chain effect.7 Two vertices will be
clustered if there is a path from one to the other through pairs of adjacent vertices. But this path can be very long and the clustered vertices at the borders can be quite dissimilar from one another. It is partly to overcome these drawbacks that we built another clustering technique which, in addition, had to be computationally efficient on large graphs as well as having a unique output.
6We carried out experiments on the same PC environment using the basic SAS system. It could not handle efficiently the
very large and sparse incident matrix of the graph of terms, nor of the graph of components (which is already a reduced graph), in order to apply non trivial clustering methods.
7 For some datasets in biology classification where the classes are very long, the chain effect of SLC is
Our solution consisted in considering the local top values of d. More precisely, if G'=(V',E') is a graph where the vertices are subsets of LCOMP, and where an index d' has been defined on E', then we
consider as S the subset lme(G')8 of edges {I,J} in E' such that for any {K,L} in E', if {K,L} intersects
{I,J} then d'(K,L) d'(I,J). Clearly, the value of edge {I,J} is higher than or equal to the value of any adjacent edge. Hence vertices I and J are supposed to be closer to one another than to any other connected vertex.
Then we derive from the graph G' the reduced graph G'lme(G') and a new index d'lme(G') is defined by :
d'lme(G')(X,Y) = max { d'(I,J): (I,J) in E', I in X, J in Y}.
This way of reducing the graph LCOMP step by step leads to a hierarchical clustering algorithm of
LCOMP. We start from the graph LCOMP and the index d, and we compute a sequence of reduced graphs :
G0= LCOMP, G1= G0lme(G0), G2= G1lme(G1) ... and the sequence of corresponding indices. Like in SLC, this process converges towards a unique output.
Given a graph Gk in this sequence, the following graph Gk+1 can be computed in linear time. So this process is in theory slower than SLC since in SLC the whole sequence of clustered graphs can be computed in linear time. Meanwhile in our experiments, the algorithm converges very fast (less than 12 iterations) and can be stopped at the second or third iteration. This is because graphs L and LCOMP are sparse, thus each vertex of the graph has a small number of neighbours. It follows that the CPCL algorithm is a fast clustering procedure that partially avoids the chain effect of SLC. This has been corroborated in an experiment carried out on a smaller corpus in (Berry et al., 2004).
2.4 A running example of the clustering algorithm
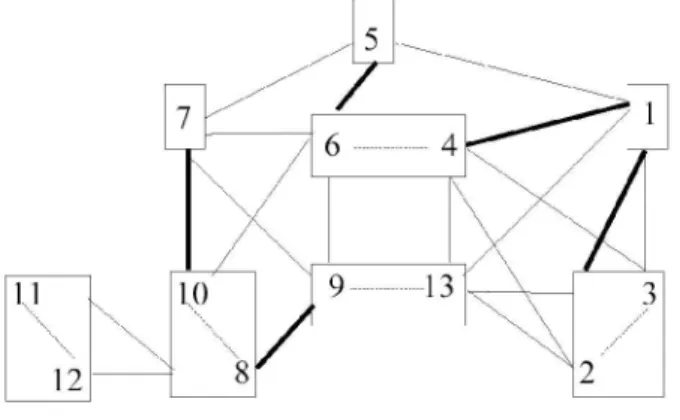
We illustrate how the clustering process runs on a small theoretical example. Let us suppose that we have 13 terms represented by the graph L in figure 2. Terms are numbered vertices, dash lines are COMP relations, straight and thick straight lines are two kinds of CLAS relations.
The first step of the CPCL algorithm is to consider connected components generated by variations in COMP. These connected components have been represented by boxes. For the sake of clarity, the components in this example have few internal edges and their sizes are small. Meanwhile, in real cases, connected components can be very big. Once the connected components based on COMP relations have been computed, these components can share many links in CLAS as shown in figure 2.
Figure 2. A theoretical example of a graph of terms.
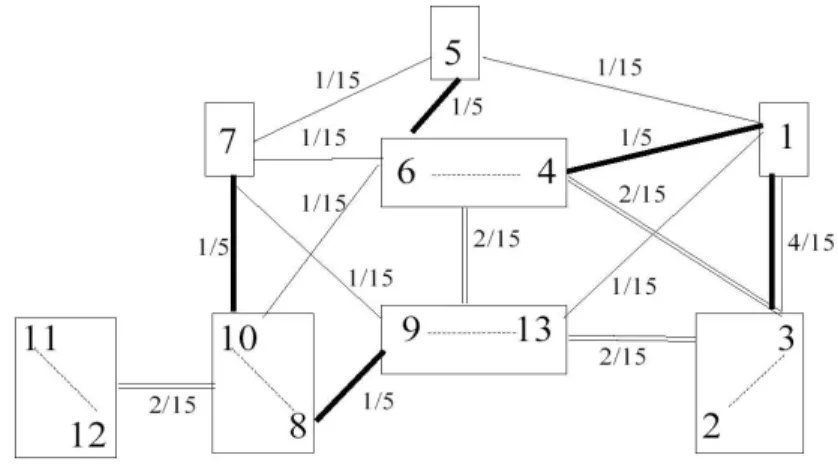
From this graph, we derive the graph of connected components represented in the figure 3 that shows the same connected components in boxes, but at most only one edge between two boxes. A coefficient
d has been associated with each external edge. Following the definition of d, since there are five thick
lines, the coefficient associated with this kind of CLAS variation will be 1/5. In a similar way, 1/15 is the coefficient associated with the other kind of CLAS relations represented by simple straight lines. Then the strength of an edge between two boxes will be the sum of coefficients associated with the edges linking them.
Figure 3. Graph of components with valued edges derived from figure 2.
To cluster graph in figure 3, we consider the edges that have a local maximal value. These edges are represented by thick lines in figure 3. Merging together components related by this kind of edges gives rise to the reduced graph in figure 4 where boxes show clusters obtained at the 1st iteration and
ellipses those obtained at the 2nd iteration.
Figure 4. Reduced graph of figure 3.
It is interesting to note that CPCL algorithm allows us to obtain clusters {4, 5, 6} apart, at the 1st
iteration, even if the strength of the edge between components {5} and {4, 6} is the same as the edge between {6, 4} and {1}. But since {1} has a higher coefficient with component {2, 3}, the CPCL algorithm does not merge them together at the 1st iteration. Using SLC would have produced a
different output : cluster {1, 2, 3} would be formed at the 1st iteration. At the 2nd iteration, it will be
merged with components {5} {6, 4}. Thus SLC will miss {4, 5, 6} as a distinct cluster while CPCL found it at the 1st iteration. In a similar way, the cluster represented by the left ellipse in figure 4
would have been ignored by SLC procedure.
3. Application of TermWatch to the IR corpus
3.1 Aisee visualization tool
Finding the adequate visualization tool to map out results issuing from a clustering algorithm is a challenge in itself. The tool has to reflect loyally the fundamental properties of the clusters while not deforming their physical organization. Equally important is the need to offer easy-to-read images to the end user. Often, the end users are not knowledgeable on data analysis and visualization techniques. Hence, the displays have to be as intuitive as possible. The graphs of clusters generated by TermWatch have certain properties which influenced the choice of a visualization tool. Foremost is the fact that it generates undirected graphs whose layout is determined from the strength of external links between clusters. Since a cluster has no coordinates, the space in which it is mapped is not geometric. Hence a major difficulty for the visualization tool is to determine the position of each cluster such that its relation to other clusters is preserved. Since clustering is done on connected components and not on the atomic units (here terms), it is necessary to enable cluster unfolding function up to the term level. Finally, the tool should highlight groups of clusters forming particular patterns, like 'complete' or 'linear graphs'. The Aisee9 visualization package met all these requirements. It implements the 'Force Directed Layout' scheme (FORCEDIR) which is particularly designed for undirected graphs. Thus it simulates the proximity of clusters as edges with a spring embedder where close particles repel one another and distant particles attract each other. Applied to our graphs, the interpretation is intuitive and straightforward : the shorter the edge, the stronger the link and vice versa.
Lately, a lot of research is being done on visualization tools as a front end to information processing. The fields dealing with clustering and mapping of knowledge structures are acutely concerned by visualization problems. Small H. (1999) presented a visualization tool of the structure of scientific literature based on journal co-citation patterns. Chen et al., (2002) use the Pathfinder network scaling as a visualization tool to enhance the results of citation and co-citation analyses. The landscape-type display offered by Pathfinder with a 3D effect represents a higher cognitive load for the user. Moreover, this interface does not appear to offer the progressive unfolding functions essential for the exploration of our graphs. The user has to be able to unfold a cluster's content into its components and unfold each component into the term variants it contains.
3.2 Clustering settings
We will focus here on the application of TermWatch to the IR corpus elaborated in a textmining context, where there is no specific STW question. We thus ran the system in a totally unsupervised manner, without filtering the terms extracted at the first stage (§2.1).
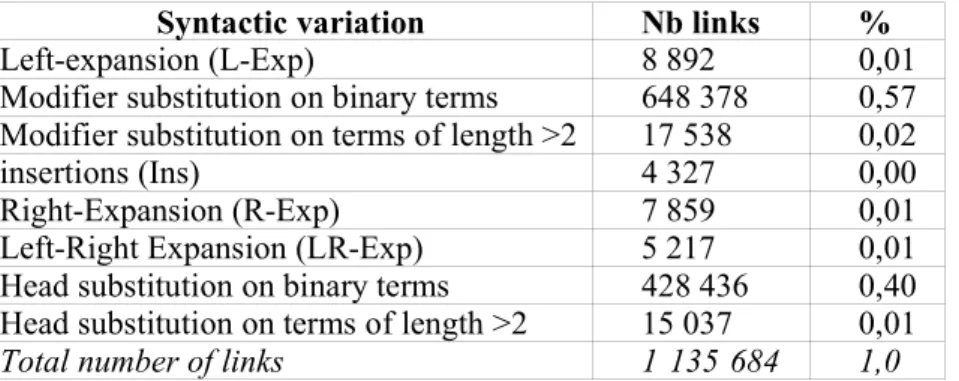
We recall that 41 038 term variants were found by the system, the number of links they generated are distributed as follows :
Syntactic variation Nb links %
Left-expansion (L-Exp) 8 892 0,01
Modifier substitution on binary terms 648 378 0,57 Modifier substitution on terms of length >2 17 538 0,02
insertions (Ins) 4 327 0,00
Right-Expansion (R-Exp) 7 859 0,01
Left-Right Expansion (LR-Exp) 5 217 0,01
Head substitution on binary terms 428 436 0,40 Head substitution on terms of length >2 15 037 0,01
Total number of links 1 135 684 1,0
Table 1. Distribution of variation links in the IR corpus
We observed earlier that binary substitutions (two-word substitution variants), owing to our definition, tend to produce abundant chains of related variants whose conceptual significance is not always clear. This "chain effect" is magnified in the case of a huge corpus. For instance, there were 179 modifier substitution variants around the head word "information" in binary terms. This linked together heterogeneous concepts such as "accurate information, agricultural information, electronic
information, beneficial information, disseminating information". Chains formed by binary
substitution tend to generate fuzzy clusters which do not necessarily portray coherent domain themes. The user can choose the relations that will be used during the clustering phase and equally their role : COMP or CLAS. In this experiment, we decided to exclude binary substitution relations from the clustering. Excluding such relations will not represent a significant loss of information as the terms themselves are not excluded and can be involved in other variation relations : left-expansion, insertion or right expansion. We also chose to ignore the ternary modifier substitution in this particular experiment given their huge number. Thus the relations used to cluster terms were the expansion relations and head substitutions involving more than two words.
We ran the clustering until it converged in 6 iterations. We chose the result of the clustering algorithm at the 2nd iteration. This was the most legible because as from the 3rd iteration, more than half of the
terms are absorbed in the most central cluster, a generic cluster labeled "information retrieval". This cluster is linked to the majority of the terms. At the 2nd iteration, 6 849 terms were grouped into 4 252
connected components and 397 clusters were obtained totaling 1848 terms.
Clusters are labeled automatically as the most active variant with regard to external links between components. Thus given a cluster, the most likely label is the term that shares the most number of variants between components. Currently, a cluster's label tends to describe its external position in the network of research topic rather than its contents10.
4. Global structure of research topics in the IR corpus
The output of the clustering module is automatically formatted in the Graph description language (GDL) used by AiSee for visualization.The user can choose to view only certain clusters connected by links above a certain threshold. In the global view below (figure 2), we show only clusters linked by edge values above the minimal link (0.0000665).Hence, it does not contain the entire 397 clusters because the image was too dense. The user can reintroduce all the links at any moment in the interface. The global layout exhibits a star-like form. Each cluster can be unfolded to show its internal structure : the connected components, the most active variants. The user can thus immediately perceive the most salient features of a cluster.
Expectedly, the cluster labeled "information retrieval" is at the core position in the global graph. It is surrounded by "information retrieval task, information retrieval engine" which reflect a slight shift on focus : engine and task. Other related topics are "electronic publishing, information technology,
public access, decision making, information seeking". Information extraction, a more recent research
theme is not directly linked to the core topic but to "information technology", thus reflecting the computational dependency of this research topic.
It is interesting to note that clusters depicting information services are grouped together : "of
information need" connects the sub network formed by "information service" to the core network. The
latter is in turn linked to clusters labeled "public library, digital library, academic library, digital
library research".
The more historical research on information science is at one extreme of the graph, represented by the cluster labeled "general information theory". This cluster contains four components labeled "general
information theory, information science theory growth, theory growth tool analysis, sense making".
Likewise, the cluster at the extreme point of this axis connected by the preceding one is labeled "information science". It points to a generic research topics on the discipline itself. Its borderline position could indicate the relative isolation of this topic with regard to the mainstream research
concerns in the IR field, that occupy more central position. The components in this cluster are "information science, information science literature, information science research".
The cluster labeled "new improvement algorithm" contains four components labeled "dynamic
programming, image processing, database application and new improvement algorithm" respectively.
The last component contains term variants like "genetic programming algorithm, filtering algorithm,
clustering algorithm, new hybrid algorithm" and visibly depicts research on new computer algorithms
applicable to various IR tasks. This class is logically close to the class of "neural network" which contains terms like "genetic algorithm technique, neural network based clustering technique". To support these findings, a return to the source texts will be necessary.
4.1 Analysing badly-labeled clusters
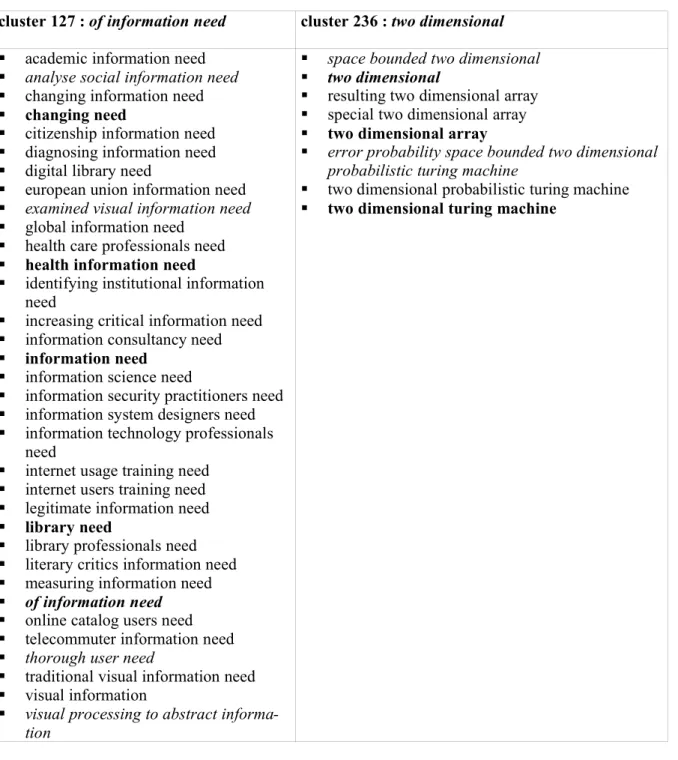
The bad labeling of the clusters "of information need", "two dimensional" and "need to find" is due to a wrong morphological analysis of the words "of", "two" and "need" by the Intex dictionary. As "need" can be either a verb or a noun, in the absence of any disambiguation, the noun reading is systematically favored by our term extraction rules. This bad labeling may result in erroneous syntactic variation links and thus to a certain degree of incoherency in the cluster contents. However, the effect of the bad syntactic analysis seems not to be really damaging when we consider the content of the cluster "of information need". This cluster is made up of two components : of information need and visual information and contains 72 terms. Table 2 shows some of these terms. Connector terms are indicated in bold and ill-formed terms in italics. We observe for instance that the ill-formed term "of information need" enters into a left expansion relation with "information need". This brings together other correct variants around this theme : changing information need, global information
need, health information need, information science need, measuring information need, library need, internet usage training need,…". After perusal, the thematic content of the cluster is not incoherent,
on the contrary. The cluster gathered together term variants around the different information needs of different categories of people. A return to associated texts will help us understand better the research topic suggested by this cluster. The case of the cluster "two dimensional" is slightly different and even more interesting. On the surface, this ill-formed sequence results from bad morphological analysis because none of our term extraction rules was looking for an adjective phrase. We were looking for noun phrases which may contain adjectives (see §2.1). However, in terms of domain terminology, "two dimensional" is not altogether devoid of meaning and is not entirely a bad term candidate. It denotes bi-variate probabilistic methods. This cluster contains three components labeled respectively :
two dimensional, two dimensional array, error probability space bounded two dimensional probabilistic turing machine". The last term results from an erroneous syntactic analysis. We give all
its terms in table 2. Among them the term "signature file" refers to documents that deal with “indexing based on a new partitioned signature file” and dynamic approaches of this partitioning based on probabilistic models.On the graph, this cluster is linked to the cluster “new improvement algorithm” When we sought to understand this link, we found out that "new improvement algorithm" is associated to documents that deal with algorithms complexity and thus, Turing machines, mentioned in the cluster “two dimensional”. “Genetic programming algorithms”, a term in the “new improvement algorithm” cluster, are among these new algorithms that also use probability theory. Thus the link between the two clusters is thematically sound.
cluster 127 : of information need cluster 236 : two dimensional academic information need
analyse social information need
changing information need changing need
citizenship information need diagnosing information need digital library need
european union information need examined visual information need
global information need health care professionals need health information need
identifying institutional information need
increasing critical information need information consultancy need information need
information science need
information security practitioners need information system designers need information technology professionals
need
internet usage training need internet users training need legitimate information need library need
library professionals need literary critics information need measuring information need
of information need
online catalog users need telecommuter information need thorough user need
traditional visual information need visual information
visual processing to abstract informa-tion
space bounded two dimensional
two dimensional
resulting two dimensional array special two dimensional array two dimensional array
error probability space bounded two dimensional probabilistic turing machine
two dimensional probabilistic turing machine two dimensional turing machine
Table 2. Examples of variants in clusters with ill-formed syntactic variants. 4.2 Textmining with TermWatch
Textmining is concerned with the discovery of hitherto unknown or implicit information from huge text corpus. The idea is to present the user with non trivial information. Such information is not readily available to the naked eye, by a sequential reading of the texts which in itself is impossible when considering such data sizes. The main purpose of applying TermWatch in an unsupervised way here is to check how the system copes in an unsupervised textmining framework. We also wished to check its capacity in highlighting topics that clustering methods based on the occurrence (term –
document) matrix will not easily detect since they need a high co-occurrence threshold to cluster these terms. We will explore in more details the topics contained in a sub network of the global graph. We were interested in understanding the link between "information retrieval" and clusters formed at one extremity of the graph labeled "rough set, functional dependency, random variable" which are not traditional IR terms but rather come from the mathematics and computing fields.
Let us suppose that a cluster produced by our system is a framework in which the user can expand its label, i.e. attain all the concepts of the class and thus find the most representative texts associated to it (those that contain most of the terms in the class). Thus a cluster's content is not directly considered here for query expansion. The mapping of topics produced by the system suggests to the user texts or topics that s/he did not previously know of or that s/he did not associate to known topics. In order to locate the texts (or documents) associated to each cluster, we loaded the clustering results in a MySQL database. Currently, a text is associated to a cluster if it contains at least one of the terms in that cluster. Thus a text is not assigned to a unique cluster but to as many clusters as it intersects with the cluster contents. A score is calculated to rank the texts by decreasing order of thematic coverage for each cluster (number of terms in the document that are in the class over the total number of terms in the class).
The Rough Set cluster is ranked 3rd when we consider the number of texts (232) that intersect its
content, behind information retrieval (1196 documents) and research information source (531 documents). Thus it can be considered a prominent topic highlighted by the clustering algorithm. Table 3 below gives for the seven topmost texts associated to this cluster, their titles, publication year, the number of terms shared with the cluster and the coverage score.
It is interesting to note that among these seven texts, five (1, 2, 4, 5 and 6) directly deal with rough set theory whereas there is no direct link between the choice of the cluster label and the number of texts containing this term. The cluster was automatically labeled Rough Set because it has the highest number of syntactic variants in CLAS.
Rank Title year terms score
1 Validation of authentic reasoning expert systems 1999 7 0.04
2 Double-faced rough sets and rough communication 2002 6 0.04
3 Canonical forms of fuzzy truthoodsby meta-theory based upon modal logic
2001 6 0.04
4 On axiomatic characterizations of crisp approximation operators 2000 6 0.04
5 Alpha -RST: a generalization of rough set theory 2000 5 0.03
6 Application of rough sets to information retrieval 1998 5 0.03
7 Parallel fuzzy inference based on level sets and generalized means 1997 5 0.03 Table 3. Seven topmost documents associated with the "Rough set" cluster.
Fundamentally, the existence of the Rough Set cluster is not surprising. The cluster is built around three components labeled Rough Set, Fuzzy Set and Set Theory. Meanwhile, the research topic represented by Rough Set theory is really a novel approach in information retrieval. This theory was initially introduced for other applications areas like improving expert systems and telecommunications as shown by the texts ranked at 1st and 2nd positions in table 3 above. In the
results obtained by TermWatch. Rough Set theory is linked to "fuzzy set theory" not only because they represent another extension of classical "Boolean set theory", but also because fuzzy extensions of "rough set theory" have been introduced under the name of "alpha-RST11" which appears in the title
of the 5th text linked to this cluster. In the late nineties, applications of RST to IR began to be
extensively carried out as shown by the document ranked at the 6th position. In fact, the link
highlighted by TermWatch between the "rough set" and "information retrieval" clusters was generated
by the term variant "rough set theory to information retrieval". This variant has a unique occurrence in the whole corpus, thus would not be captured by statistical textmining methods based on occurrence criterion. Another interesting finding is the link between Rough Set and "Functional
Dependency”. For specialists of rough set, it is expected that the two clusters be linked but through a
term like "rough dependency". However, a search showed that this term does not appear in the corpus. The two clusters were linked in a very indirect way through variants of terms dealing with the concept of "fuzzy". This concept connects the two research topics "Rough Set" and "Functional Dependency" as shown in the series : functional dependency --> fuzzy functional dependency concept <-- fuzzy set
concept <-- fuzzy set --> fuzzy rough set <-- Rough Set. The first two terms are in the "functional
dependency" cluster, the others in the “Rough Set” cluster.
If the class Rough Set is so clearly highlighted by TermWatch through syntactic variations, one possible explanation, based on observed terminological behavior, is that authors of new or borderline topics try to use established terminology in order to mark their belongingness to a field, thus producing many variations. Expectedly, such novel terminology appears only in small set of texts. In the case of this corpus, only 30 out of 3355 texts contained the word Rough Set. This explains why such new and low occurring phenomena will be likely missed by clustering methods based on occurrence.
Discussion
We have presented an alternative multi-disciplinary approach to the textmining problem that integrates state-of-the-art research in computational terminology, clustering algorithms and visualization issues. TermWatch is particularly suitable for mapping research topics at the micro level, i.e; the level of a domain or a specialty because it focuses on linguistic relations between relevant text units. The results shown for the IR corpus are still preliminary. More experiments will be done in order to explore their different facets. For instance, it will be interesting to carry out a time series analysis in order to pinpoint trends in scientific research in these IR journals. Also, we can vary the two system parameters - the relations used for the clustering and the minimal link threshold considered for clustering, in order to observe the results obtained each time.
Other pending research issues are the filtering of the noisy substitution relations using a lexical database such as WordNet (Miller, 1998) or any domain-specific database, so as to ensure that only those variants which have some semantic links are used for clustering. We are also currently testing the detection of semantic relations such as synonyms and hypernyms through the use of linguistic cues (Hearst 1992 ; Jacquemin & Morin, 2002). Synonym relations can be signaled by the presence of parenthesis between a term and its synonym. Hypernym/hyponym relations are signaled by lexico-syntactic cues such as "such as, like, including, such_NP_as". Once these semantic variants are detected and filtered, we will tackle the issue of how to integrate them into the clustering procedure. Technically speaking, the number of relations that the system can handle are not limited. However, on a linguistic level, it will be relevant to give more weight to semantic variants in the clustering process. Terminology variations have a high potential for several applications amongst which the tracking of domain topic evolution. It is possible that the thematic mapping produced by the system can suggest new terms for query formulation following the discovering of unknown terms, topics or links. This potential usage of the thematic graphs generated by TermWatch in a normal IR context is yet to be fully explored.
Also pressing is the need to set up an evaluation protocol. Evaluating the system using the usual recall and precision yardsticks in IR will not be adequate since the system's output is not a list of relevant documents or texts which can be measured against a golden standard (a manually selected reference list). Measuring recall in the IR sense supposes that a human reading first determines what the
relevant topics in the corpus are and what their structure is. This can then be checked against those are mapped by the system at a given iteration. This will require a huge effort given the size of the corpus, as well as being subject to some arbitrariness. Evaluating a STW or textmining system calls for a specific evaluation metric which we are yet to set up.
References
Berry A., Kaba B., Nadif M., SanJuan E., Sigayret A. (2004). Classification et désarticulation de graphes de termes in JADT 2004, Leuven, Belgique, 10-12 mars, 2004, 12p.
Baeza-Yates, Ribeiro –Neto B. (1999) Query operations, in Modern Information retrieval. ACM Press, 117-139.
Barthelemy J.P., Leclerc B., Monjardet B. (1984) Ensembles ordonnés et taxonomie mathématique.
Annals of Discrete Mathematics, 23 523-548.
Callon M., Courtial J-P., Turner W., Bauin S. (1983). From translation to network : The co-word analysis. Scientometrics, 5(1).
Chen C., Cribbin T., Macredie R., Morar S. (2002). Visualizing and tracking the growth of competing paradigms : Two case studies. Journal of the American society for Information Science, 53(2002), n° 8, 678-689.
Crithchley F., Fichet B. (1994). Partial order of the principal clusters of dissimilarity. In Van Cutsem B. (eds.) Classification and dissimilarity analysis, Lecture Notes in Statistics, n° 93, Springer-Verlag, 1994, 5-65.
Dowdall J., Rinaldi F., Ibekwe-SanJuan F., SanJuan E. (2003). Complex structuring of term variants for Question Answering. Workshop on Multiword expressions : Analysis, Acquisition and
Treatment. In 41st Meeting of the Association for Computational Linguistics (ACL, 2003),
Sapporo, Japan, 12 July, 2003, 8p.
Hearst M.A. (1992). Automatic acquisition of hyponyms from large text corpora. Proceedings of the COLING'92, Nantes, 539-545.
Hearst M.A. (1999). Untangling Text Data Mining. Proceedings of the 37th Annual meeting of the
Association for Computational Linguistics, Maryland, June 20-26, 1999. [Invited paper].
Ibekwe-SanJuan F., Dubois C. (2002). Can Syntactic variations highlight semantic links between domain topics ? 6th International Conference on Terminology and Knowledge engineering (TKE
2002), Nancy, 28-30 August 2002, 57-63.
Ibekwe-SanJuan, F. (1998). A linguistic and mathematical method for mapping thematic trends from texts. Proceedings of the 13th European Conference on Artificial Intelligence (ECAI’98), Brighton UK, 23-28 August 1998, 170-174.
Jacquemin C., Spotting and discovering terms through Natural Language Processing, MIT Press, 2001, 378p.
Morin E, Jacquemin C. (2003). Automatic acquisition and expansion of hypernym links. Computer
and the humanities. Kluwer Academic press. 36p.
Polanco X., Grivel L., Royauté J. (1995). How to do things with terms in informetrics : terminological variation and stabilization as science watch indicators. Proceedings of the 5th International Conference of the International Society for Scientometrics and Informetrics, Illinois USA, 7-10 June 1995, 435-444.
Small H. (1973). Cocitation in the scientific literature : A new measure of the relationship between two documents. Journal of the American society for Information Science, 24, 265-269.
Small H. (1999). Visualizing science by citation mapping. Journal of the American society for
Information Science, 50(1999), n° 9, 799-813.
Salton, G., Singhal, A., Buckley, C., Mitra M. (1996). Automatic text decomposition using text segments and text themes. Proceedings of Hypertext, 53-65.
Silberztein M. (1993) Dictionnaire électronique et analyse automatique des textes. Le système INTEX. Masson, Paris.
Appendix 1. List of the journals used to constitute the IR corpus
Rank Nb. rec % Cumul-rec Cumul-% Journal name
1 831 25% 831 25% Information sciences
2 688 21% 1519 45% Journal of the American Society for
Information Science and Technology
3 283 8% 1802 54% Information processing & management
4 272 8% 2074 62% Journal of information science
5 267 8% 2341 70% Information systems management
6 175 5% 2516 75% Journal of Documentation
7 176 5% 2692 80% Information Systems
8 116 3% 2808 84% Information systems security
9 108 3% 2916 87% Library & information science research
10 108 3% 3024 90% Online information review
11 87 3% 3111 93% Journal of internet cataloging
12 70 2% 3181 95% Information retrieval & library automation
13 67 2% 3248 97% Knowledge organization
14 44 1% 3292 98% Journal of Information Science and
Engineering
15 34 1% 3326 99% International forum on information and
documentation
16 29 1% 3355 100% Information retrieval