HAL Id: dumas-01905987
https://dumas.ccsd.cnrs.fr/dumas-01905987
Submitted on 26 Oct 2018HAL is a multi-disciplinary open access archive for the deposit and dissemination of sci-entific research documents, whether they are pub-lished or not. The documents may come from teaching and research institutions in France or abroad, or from public or private research centers.
L’archive ouverte pluridisciplinaire HAL, est destinée au dépôt et à la diffusion de documents scientifiques de niveau recherche, publiés ou non, émanant des établissements d’enseignement et de recherche français ou étrangers, des laboratoires publics ou privés.
Exploring central nervous system effects of peripheral
botulinum toxin injection in writer’s cramp patients
using transcranial magnetic stimulation
Marie Fournier
To cite this version:
Marie Fournier. Exploring central nervous system effects of peripheral botulinum toxin injection in writer’s cramp patients using transcranial magnetic stimulation. Human health and pathology. 2018. �dumas-01905987�
AVERTISSEMENT
Ce document est le fruit d'un long travail approuvé par le
jury de soutenance et mis à disposition de l'ensemble de la
communauté universitaire élargie.
Il n’a pas été réévalué depuis la date de soutenance.
Il est soumis à la propriété intellectuelle de l'auteur. Ceci
implique une obligation de citation et de référencement
lors de l’utilisation de ce document.
D’autre part, toute contrefaçon, plagiat, reproduction illicite
encourt une poursuite pénale.
Contact au SID de Grenoble :
bump-theses@univ-grenoble-alpes.fr
LIENS
LIENS
Code de la Propriété Intellectuelle. articles L 122. 4
Code de la Propriété Intellectuelle. articles L 335.2- L 335.10
http://www.cfcopies.com/juridique/droit-auteur
Année 2018
EXPLORING CENTRAL NERVOUS SYSTEM EFFECTS OF PERIPHERAL BOTULINUM TOXIN INJECTION IN WRITER'S CRAMP PATIENTS USING
TRANSCRANIAL MAGNETIC STIMULATION
Effets centraux de l’injection périphérique de toxine botulique dans la crampe de l’écrivain : une étude en stimulation magnétique transcrânienne
THÈSE
PRÉSENTÉE POUR L’OBTENTION DU TITRE DE DOCTEUR EN MÉDECINE DIPLÔME D’ÉTAT
Marie FOURNIER
THÈSE SOUTENUE PUBLIQUEMENT À LA FACULTÉ DE MÉDECINE DE GRENOBLE
Le 23 Octobre 2018
DEVANT LE JURY COMPOSÉ DE
Présidente du jury et directrice de thèse : Me La Professeure Elena MORO
Membres : Me La Professeure Marie VIDAILHET
Mr Le Professeur Philippe KAHANE
Mr Le Docteur Christophe VIAL
Mr Le Docteur Olivier DAVID
L’UFR de Médecine de Grenoble n’entend donner aucune approbation ni improbation aux opinions émises dans les thèses ; ces opinions sont considérées comme propres à leurs auteurs.
UNIVERSITÉ GRENOBLE ALPES UFR DE MÉDECINE DE GRENOBLE
Remerciements
Aux membres du jury,
A Me La Professeur Elena Moro, je vous remercie de me faire l’honneur de diriger ma thèse. Merci pour votre optimisme au quotidien, que ce soit avec vos patients ou votre équipe. Merci de me donner l’opportunité de me former à vos côtés.
A Me La Professeur Marie Vidailhet, je suis très honorée que vous ayez accepté de participer à mon jury de thèse. Veuillez recevoir l’expression de toute ma gratitude.
Merci à toutes les deux d’être des modèles de neurologues accomplies, investies tant auprès des patients, que dans la recherche et l’enseignement.
A Mr Le Professeur Philippe Kahane, je te remercie de de me faire l’honneur de juger mon travail. Merci pour ta bienveillance.
A Mr Le Docteur Christophe Vial, je vous remercie me faire l’honneur de juger mon travail. Veuillez trouver ici l’expression de mes sincères remerciements.
A Mr Le Docteur Olivier David, je vous remercie de me faire l’honneur de juger mon travail. Merci de m’avoir permise de travailler au sein de votre équipe cette année.
A ceux qui ont permis ce travail,
Merci aux patients qui ont accepté de participer à cette étude.
A Estelle Raffin pour tes conseils précieux et tes relectures même en plein milieux de l’été ou la veille d’une présentation, ainsi que pour ton aide lors des tests en TMS,
A Clecio de Oliveira Godeiro Junior, qui a commencé ce travail, merci de t’être impliqué dans ce projet jusqu’au bout, je te souhaite un bel avenir personnel et professionnel dans ce pays que tu nous conté en nous faisant rêver !
A Sylvain Harquel, pour ton aide avec CortexTool (« casse-cortex »), et pour ton aide dans les tests en TMS,
A Brice Passera, merci d’avoir sauvé une des dernières dates du protocole grâce à ta réactivité,
Summary
Introduction. Writer’s cramp (WC) is a focal dystonia characterized by abnormal muscle
contractions leading to functional deficit at writing. Dystonia pathophysiological mechanisms
include sensorimotor integration dysfunction and loss of inhibition at several levels of the
nervous system. Treatment consists in botulinum toxin injection (BOT) in the affected muscles,
which is usually repeated every 3 months. Although its mechanism of action is peripheral by
blocking the release of acetylcholine at a presynaptic level, central nervous system effects have
been noted but are not well understood. We aimed at better understanding WC’s
pathophysiology and BOT effect by using neuronavigated and robotized transcranial magnetic
stimulation (TMS). This noninvasive brain stimulation technique allows to measure motor
cortex excitability. We hypothesized that electrophysiological responses (cortical excitability,
finger cortical representation, short afferent inhibition (SAI) reflecting sensorimotor
integration) will change with BOT in parallel with clinical parameters improvement.
Method. We studied 4 WC patients before, at one week, one month (M1), and three months
after BOT. At each visit, we studied motor and sensory clinical parameters and
electrophysiological responses (cortical excitability (CE), finger representation on the motor
cortex, SAI).
Results. We found that, at M1, while clinical parameters improved, CE decreased, fingers’
representation showed more or less overlap, and SAI reinforced.
Conclusion. Our results support a central action of BOT treatment in writer’s cramp: BOT
might modulate sensorimotor integration. Our preliminary data need to be confirmed with a
Abbreviations
APB: abductor policis brevis CoG : center of gravity ECR : extensor carpi radialis EMG : electromyography FCR : flexor carpi radialis FDI : first dorsal interosseus Gpe : globus pallidus pars externa Gpi : globus pallidus pars interna ICF : intracortical facilitation ISI : inter-stimuli interval LTP: long term potentiation LTD: long term depression MEG: magneto-encephalography MEP/PEM: motor evoked potential PMC: primary motor cortex
PNS: peripheral nerve stimulation RMT: resting motor treshold rTMS: repetitive TMS SAI: short afferent inhibition SD: spatial discrimination
SNr : substantia nigra pars reticulata SI : surround inhibition
ST: sensory treshold
TD: temporal discrimination
TMS: transcranial magnetic stimulation WC: writer’s cramp
Table of contents
Introduction ... 1
Dystonia ... 2
Transcranial magnetic stimulation ... 6
Dystonia’s pathophysiology ... 10
Reduced inhibition ... 11
Sensitive abnormalities ... 14
Sensorimotor integration* dysfunction ... 16
Maladaptive plasticity ... 17 Dystonia treatment ... 18 Research hypothesis ... 21 Methods ... 23 General procedure ... 23 Subjects ... 24 Clinical examination ... 24
Peripheral nerve stimulation (PNS) ... 25
MRI-based neuronavigation ... 25
Robotized transcranial magnetic stimulation ... 26
Electromyography ... 27
Experimental procedure ... 27
Data analysis ... 28
Results ... 30
Subjects ... 30
Clinical features at baseline and changes induced by the BOT injections ... 31
Electrophysiological parameters at baseline and changes after botulinum toxin injections ... 37
Discussion ... 46
Bibliography ... 53
Glossary ... 61
Appendix ... 64
1
Introduction
Human life is permitted by constant adaptation to our environnement. This adaptation needs an
interface: this is our body. Brain is the central node of this interface. Motor development is
particularly important because it allows to run away from danger and thus to preserve the specie
from predators. However, with evolution, more complexe motor skills were developed, which
contribution to life maintenance is not the subject of our discussion, like writing or music
playing. The acquisision or maintenance of expert motor skills can be pathologic, for example
in focal task-specific dystonia like writer’s cramp. Dystonia is a complex condition, which
recognition as an entity is fairly new (1911 for generalized forms, then 1976 for focal forms).
Indeed both comprehension of its pathophysiology and its treatment is still an evolving field of
interest and recent years have seen many publications which could not reach as much clinical
impact as expected. Current treatment of focal task dystonia consist in botulinum toxin
injections, which efficacy is obvious but hard to achieve in clinical routine. Parallely to clinical
advances on dystonia has the interest on new non-invasive brain stimulation techniques like
transcranial magnetic stimulation (TMS) (1985) raised. Our aim is to show that, in writer’s
cramp, both clinical motor and sensory parameters and electrophysiological TMS responses
reflecting dystonia pathophysiology evolve paralelly after botulinum toxin injection, supporting
a central effect of the treatment through modulation of peripheral motor and sensory afferences.
First we will present dystonia definition, classification and features, then we will present
transcranial magnetic stimulation and its protocols utilized to study sensorimotor pathways.
Then we will review literature concerning dystonia pathophysiology and botulinum toxin way
of action to go to our hypothesis. After a presentation of the method we will go through our
2
Dystonia
Definition
Dystonia is a movement disorder characterized by sustained or intermittent muscle contractions
causing abnormal, often repetitive, movements, postures, or both
.
Dystonic movements are typically patterned, twisting, and may be tremulous. Dystonia is often initiated or worsened byvoluntary action and associated with overflow muscle activation (1).
History: from definition to classification
Evolution of nosology reflects the evolution of dystonia’s understanting and is still evolving.
Dystonia was first described in its generalized form in 1911 by Oppenheim , and then by Flatau
and Sterling. Focal dystonia, initially described as cramps, spasms, or psychogenic
manifestations, were not considered as belonging to the same nosologic entity than generalized
forms until Marsden and Sheehy proposed it in 1976. This same year, Fahn and Elridge
separeted primary from secondary dystonia (due to a hereditary condition or to a known
environnemental cause). The first consensual definition of dystonia was put into words in 1984:
“sustained muscle contraction frequently causing twisting and repetitive movments or abnormal
posture”(1). Classification of dystonia than evolved with time, the most recent one, in 2013 (1)
introduced the term isolated, prefered to the long-standing term primary (which was confusing
because referring to pure as well as without any known cause), in order to describe dystonia
without any other symptoms than tremor. Dystonia plus is no longer employed, an is replaced
by combined (with other symptoms than dystonia). The term heredodegenerativ was also
replaced by distinct entities: degenerative nervous system pathology and inherited.
Classification
3 Ø Axis 1: clinical features:
- of dystonia:
o Age at onset (infancy, childhood, adolescence, early or late (+/- 21-40 y.) adulthood
onset).
o Body distribution (focal (one simple region), segmental (two adjacent regions or
more), multifocal (two non-adjacent regions or more), generalized (the trunk and
another regions) and hemidystonia (inferior and superior ipsilateral limb).
o Temporal pattern (in disease course and variability)
- of associative features:
o Isolated dystonia or associated with other movement disorders (tremor is
accepted)
o With other neurological or systemic manifestations
Ø Axis 2: etiology:
- Nervous system pathology: degeneration, structural lesion or other.
- Inherited or acquired:
* Inherited (e.g. the most frequent DYT 1 or DYT 6 mutations),
* Acquired (perinatal brain injury, toxic, drug-induced, vascular, psychogenic…)
* Idiopathic: sporadic or familial.
In clinical practice, we can roughly distinguish:
Ø Early onset isolated generalized dystonias, with an inherited genetic basis, which are
rare disease, symptoms tense to worsen with years,
Ø Late onset isolated focal dystonias, with a hereditary predisposition but no identified
mutation, usually not evolutive,
4 The most frequent focal dystonias are blepahrospasm and cervical dystonia. Writer’s cramp
is much rarer. It is a task-specific dystonia: dystonia is triggered by a specific task and
appears when writing. Other examples of task-specific focal dystonia are musicians’ cramp that
can affect the upper limb (strings or piano player) or the mouth (embouchure dystonia in brass
and woodwind players), athletes (golfers…), or workers (tailors, shoemakers…).
Ancillary motor features
Some clinical features are inherent to dystonia syndrome (so-called ancillary features):
- Overflow, is defined as “unintentional muscle contraction that accompanies but is anatomically distinct from the primary dystonic movement”,
- Sensory tricks or “geste antagoniste”, sensory stimulation that inhibits the motor symptom of dystonia, like cervical dystonia patients touching their homolateral cheek to avoid
torticollis. Its spectacularism partly explains why dystonia used to be regarded as a
psychiatric disease for a long time,
- Mirror movement: is “a unilateral posture or movement that is the same or similar in character to a dystonic feature that can be elicited, usually in the more severely affected
side, when contralateral” (1).
Non-motor symptoms in dystonia
There has recently been increased attention on non-motor symptoms associated with dystonia
(2). These symptoms include:
- sensory abnormalities (they will be described further)
- neuropsychiatric abnormalities: depression and anxiety seem to be frequent comorbidities in dystonia patients.
5 On the other hand, no abnormal cognition or sleep disorders are strongly and directly associated
to dystonia (sleep disorders are more frequent but correlated to depression).
Risk factors for task-specific dystonia (writer’s cramp and musician’s cramp)
Task specific dystonia is a focal dystonia which is task-triggered. Same muscles involved in a
different task won’t behave in dystonic manner. Several risk factors have been associated with
predisposing, triggering, and maintaining of task-triggered dystonia, in interacting with genetic
and environmental basis (3):
Ø Genetic and epigenetic factors are important, like family history of dystonia and some
susceptibility genes.
Ø Environmental factors are:
o highly rehearsed motor skills (stereotyped and spatial-temporally repeated task),
o a new, demanding a high spatial-temporal resolution tool,
o fatigue, overuse, loco-regional injury, biomechanical individual limitations,
o individual plasticity capacities, exposition, training in a propitious learning
window time, cognitive and emotional factors (like stressful conditions)
o attentional focus negatively impacts dystonia symptoms and performance.
Psychogenic dystonia
Psychogenic dystonia is currently classified among acquired dystonia, even if experts discussed
wether it should be considered as a pseudodystonia (dystonia imitator). Fahn and Williams
criterion (1988) for psychogenic movement disorders can be used, therefore features such as
incongruence, inconstitance or distractibility/multiple somatization/other false signs are being
tracked. Other definitions are more specific to dystonia (Espay et Lang, 2015), and search for
6 Future classifications could remove psychogenic dystonia from dystonia classification,
however we will see later that even if psychogenic, it shares some pathophysiological features
with non psychogenic dystonia.
Transcranial magnetic stimulation
Transcranial magnetic stimulation (TMS) is a non-invasive brain stimulation (NIBS) technique
based on the electromagnetic induction principle. It has a relatively good spatial (cm range)
and good temporal (ms) resolution but the stimulation is restricted on the superficial layers of
the cortex (maximum depth of 2-3cm max), depending on the coil, stimulation intensities,
waveforms.
Different protocols allow different uses of TMS on order to:
- Explore brain functions:
o Evaluate brain functions (online single, double or triple impulsion TMS protocols),
with a causality relation inference,
o Interfere (online single pulse or burst of TMS)
- Treat patients (offline repetitive TMS (rTMS) protocols).
“Online” protocoles explore the immediate consequence of a TMS pulse, whereas “offline”
protocols explore delayed consequences. Responses, to rTMS in particular, show a large
inter-individual variability (due to neuroanatomical or genetic factors…), and intra-inter-individual
variability (due e.g. to state-dependency, experimental conditions…). Current research aims at
better understanding the factors explaining this variability. Contraindication to TMS are
epileptic disorders, pregnancy, drug intake that can modify the response (see appendix )(4).
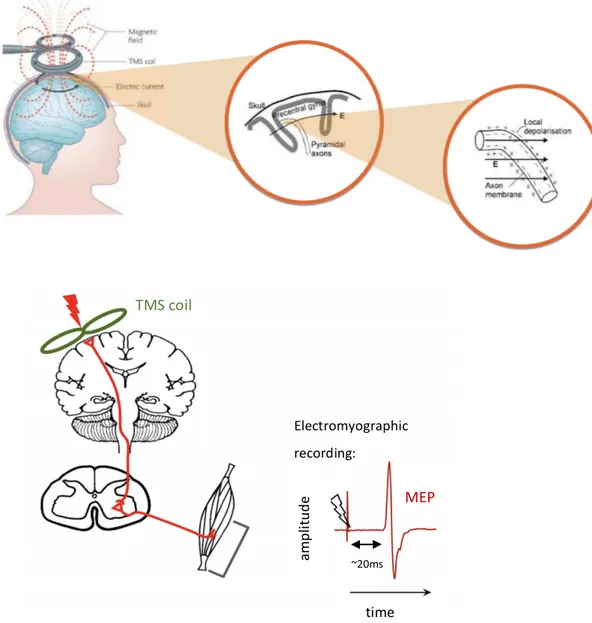
7 A copper most-often “figure of eight” coil delivers a magnetic stimulation over the scalp (fig.
1), which transforms into an electric impulsion thanks to the electromagnetic induction
principle. This electric impulsion, delivered over the motor cortex, is able to depolarize the
neurons underneath the coil and to elicit a cortical response constituted of a direct wave
(D-wave) and followed by indirect waves (I-waves) (5). If the stimulation is strong enough, it
activates the cortico-spinal pathway evoking a motor potential (MEP) which can be
measured by peripheral electromyographic electrodes. This potential occurs 15 to 45 ms
after the TMS pulse and its amplitude reflects cortical excitability.
Figure 1. On the top: Schematic representation of the electromagnetic induction principle
applied to a TMS pulse over the cortex. On the bottom: schematic representation of the motor
MEP time ~20ms TMS coil Electromyographic recording: am pl itu de
8 evoked potential to a TMS pulse over the motor cortex, as recorded by electromyography. Modified from Harquel, S. and Ridding and Rothwell (6)
Over the visual cortex TMS pulse can elicit phosphenes, over the language area it can
temporally block language production, allowing to explore, with a good spatial resolution and
causal inference, the implication of a given region in a given task.
Traditional TMS requires the examiner to hold the coil for the entire exam and this factor largely
hampers reliability of the results. Robotized and neuronavigated TMS improves spatial
resolution and reliability.
TMS protocols for the study of sensorimotor pathways (7)(8)(9)
Here we focus on TMS pulse applied over the sensorimotor pathways.
SIMPLE PULSE TECHNIQUES:
Cortical motor threshold is defined as the minimal intensity of motor cortex stimulation
required to elicit a reliable MEP of minimal amplitude in the target muscle, it can be assessed
in a resting (resting motor threshold, RMT) or active muscle (active motor threshold).
Reliability of the MEP is considered for MEP≥50µV in a resting muscle, and ≥100µV in an
active muscle (variability is more important in an active muscle which leads to consider a higher
minimum amplitude). The resulting parameter of cortical motor threshold on primary motor
cortex is the motor cortex excitability (7). Cortical mapping of motor representations can
be explored, by comparing MEP elicited by TMS stimulation of adjacent cortical regions.
Cortical silent period corresponds to the electrical silent period on a surface EMG activity
100-300 ms after a MEP. First part <50 ms is in link with spinal cord refractoriness, second part
9
Fig 2. Electromyographic recording showing motor evoked potential after a TMS stimulus over
the motor cortex (which artefact is hardly seen here) followed by the silent period, where background activity is lowered. From (6)
PAIRED PULSE TECHNIQUES:
Short interval intracortical inhibition (SICI), is a paired-pulse TMS technique, with a
conditioning subthreshold stimulus modifying the response to a test supra-threshold stimulus.
<5 ms inter-stimulus interval (ISI) is inhibiting (GABA-A mediated) (SICI), at 8-30 ms it is
facilitating (Intracortical Facilitation, ICF). Long interval intracortical inhibition (LICI), is
identical but ISI is at 50-200 ms, depending on GABA-B receptors.
Short afferent inhibition (SAI) and long afferent inhibition (LAI), consist in pairing a peripheral nerve stimulus (PNS) with a TMS pulse. The PNS can be cutaneous, at 2-3 times
the sensory threshold or evoking a motor twitch. SAI measured in fingers’ muscles occurs with
an ISI around 22-25ms, which correspond to the N20 somatosensory potential (conduction
latency from the peripheral stimulation to the primary sensory cortex) + 2-5 ms. LAI is at 200
msec. Both can be explored in a homotopic or heterotopic way, depending on PNS
delivered in the registered muscle or and adjacent muscle. SAI and LAI are cholinergic and
GABA-A influenced responses. Homotopic SAI has an inhibitory effect on MEP amplitude,
whereas heterotopic SAI is facilitating and increases MEP amplitude (11). SAI was
attributed to a cortical origin (N100 response) by a TMS-EEG study (11), which also showed
10 that SAI size of effect could reflect cortical excitability changes. SAI may contribute to
surround inhibition (that will be described further). This mechanism may allow precise
selection of movement in order to perform a specific task. However, functional significance of
SAI for hand control is unknown. An active muscle can modify the magnitude of SAI effect.
SAI is reduced during onset of muscle activity and sustained muscle contraction (12).LAI was
described as depending on cortico-cortical connections with implication of the primary and
secondary sensory cortex (SI, SII) projections to the motor cortex (13).
We will not develop here techniques such as cortical reciprocal inhibition (=central reciprocal
inhibition =antagonist cortical inhibition) which explores the effect of a peripheral stimulation
on a TMS pulse over antagonist muscles, inter-hemispheric inhibition (IHI), which explores
effect a stimulation of the contralateral cortex on a stimulation of the ipsilateral motor cortex,
or stimulation over the cerebellum in order to explore sensorimotor pathways (CBI,
thalamocortical inhibition induced by cerebellar stimulation).
PAIREDASSOCIATIVESTIMULATIONTECHNIQUES:
A particular technique derived from paired pulse techniques is the paired associative
stimulation method (PAS), which was developed in order to induce potentiation or inhibition,
thanks to a peripheral median nerve stimulation combined to a time-locked TMS pulse over the
motor cortex at a low frequency. At different ISI, MEPs can be facilitated (25 ms), or inhibited
(10-15 ms). PAS was assimilated to long term potentiation (LTP) and depression (LTD), and
such protocols allows to explore plasticity mechanisms. This method is different from rTMS.
Dystonia’s pathophysiology
No anatomical abnormality at the brain MRI has been found in isolated dystonia, whereas in
structural or acquired dystonia, abnormalities can be found in the sensorimotor striatum and
11
can be highlighted by functional imaging, brain mapping and electrophysiology
(5)(19)(20). It is important to remember that the exact origin of these abnormalities are not clear
and might due to compensation or to the endophenotype* of the disease, with symptoms linked
to the specific entity from which the patient suffers (e.g. some sensory abnormalities seems to
be endophenotypic as unaffected relatives can have them, and they can be found in other
unaffected parts of the body or contralaterally).
The pathophysiology of dystonia is therefore very complex. Its approach, in literature, used to
be anatomic (where?) and is nowadays more and more mechanistic (how?). On the anatomic
approach, the role of a wide range of structures were discussed: from basal ganglia (the
striatum), the thalamus, motor, parietal and frontal cortex, the cerebellum and mesencephalon
to the cortico-striato-pallido-thalamo-cortical and cerebello-thalamo-cortical loops. On the
mechanistic approach, the most recent hypothesis concerns: reduced inhibition, sensitive
abnormalities, defective sensorimotor integration and maladaptive plasticity. We will focus on
this last approach. Moreover we will focus, when possible, on focal dystonia, especially WC.
Reduced inhibition
Dystonia patients exhibit reduced inhibition at various levels of the nervous system, sometimes
in clinically unaffected body parts (21)(8).
Clinical evidence
- Overflow phenomenon and mirror movements suggest a lack of inhibition.
- Dexterity is abnormal in musician’s hand dystonia, with slowness, loss of rhythm and excessive strength (22); same results were found in non task-specific hand dystonia (23).
This also suggests a lack of inhibition.
Electrophysiological evidence
12 At spinal level, reciprocal peripheral inhibition, which is the inhibition of H reflex*
(corresponoding to the myotatic reflex) when stimulation of the antagonist muscle (24), is lost
in FHD. Likewise, at brainstem level, blink reflex recovery* (brainstem level) is abnormal in
blepharospam and generalized dystonia. However, supra-spinal control might explain those
lower-levels abnormalities.
b) Cortical level
Different TMS protocols explore cortical level: short and long intra-cortical inhibition (SICI,
LICI) and facilitation (ICF). Cortical silent period (CSP), central reciprocal inhibition and
interhemispheric inhibition. Some studies showed abnormalities in some of those protocols. We
won’t list them here. It’s however interesting to note that:
- the abnormalities were found in both or only the symptomatic hemisphere in unilateral FHD,
- Some studied found abnormalities linked to specific dystonia features like task-specificity or abnormalities in some groups of patients like the one experiencing mirror movements,
- Evaluation of the correlation between electrophysiological abnormalities and motor behavioural was uncommon, and studies who did so could fail to prove such a correlation,
- Asymptomatic mutation carriers (DYT1 for example) were also studied, and they could have some abnormal responses too.
- Psychogenic dystonia patients could have similar electrophysiological abnormalities than patients. This rise the question whether those abnormalities are cause or consequence, and
if psychogenic dystonia have same predisposal conditions than patients.
c) Surround inhibition (SI)
Surround inhibition is well-known in sensory pathways. More recently it was also discussed,
13 in an area surrounding an activated neural network, it’s a physiologic mechanism to focus
neuronal activity and to select neuronal responses. It has been proposed to be an essential
mechanism in the motor system where it could aid the selective execution of desired movements
(25). Protocols exploring SI are varied but usually deliver a TMS pulse triggered by onset of
movement, and measure conditioned MEP at onset of movement compared to unconditioned
MEP at rest. In focal hand dystonia, some studies using this protocol showed disturbed SI (26).
However, surround inhibition may starts before the onset of movement, at the early phase of
movement initiation (meaning movement-triggered TMS pulse are insufficient to explore SI).
One study found altered SI in FHD in the initiation phase of movement (27), the authors also
tested the contribution of SICI which was altered, so that SICI was said to contribute to surround
inhibition. Different inhibition mechanisms, among the previously described cortical
inhibition mechanisms may be involved in SI. However, studies exploring SI may be
unpowered in dystonia patient, as spotlighted by this recent review (28) which found an excess
of SI variability in focal hand dystonia patients.
d) Lack of inhibition in the cortico-striato-pallido-thalamo-cortical loop*
Indirect pathway (D2 receptors in the striatum) is thought to reduce movement, through GPe
and STN relay by increasing inhibitory outputs (GPi/SNr) to the thalamus and decreasing motor
cortical activity , whereas direct pathway (D1 receptors in the striatum) is thought to facilitate
movement, throught decreasing inhibitory outputs (Gpi/SNr) to the thalamus, liberating motor
cortical activity. Dystonia has been attributed to an imbalance between direct and indirect
pathways leading to reduced inhibition of the thalamus and enhanced motor cortex activity.
This was supported by reduced intraoperative recording firing rates of Gpi neurons in DBS
surgery for dystonia (29). Moreover, this imbalance could target only involuntary “surround”
movement that won’t be reduced, linking this mechanism to surround inhibition and motor
14
Sensitive abnormalities
Patients with dystonia definitely have obvious motor abnormalities. However, sensory
abnormalities can be brought to light with a deeper clinical testing, investigations and research
protocols (19)(30)(31)(2).
Clinical evidence
- Sensory symptoms may precede appearance of dystonia.
- The sensory trick (fig. 3) can relief temporally the motor symptoms
Fig 3. from (32)
- Peripheral blockade (lidocaine) can alleviate dystonic posture (33).
- Vibration-induced illusion of movement is altered bilaterally in focal dystonia (34)
15
Test evidence
- Spatial and temporal discrimination of a somaesthesic stimulation are impaired, even in
unaffected (and contralateral) body parts (36)
o temporal discrimination threshold is altered in different forms of focal dystonia,
independently from the region of the body affected and the severity of motor symptoms
(37)
o spatial discrimination was altered in FHD, with no correlation with severity,
bilaterally but with higher threshold in the dominant hand (36)
o temporal discrimination abnormalities might be more importantly involved than spatial
discrimination abnormalities, moreover crossmodal stimuli like visuo-tactile
discrimination might be more sensible, and a more effective sensory trick was
associated with a better visuo-tactile temporal discrimination in generalized dystonia
(38)
o intriguingly, patient with psychogenic dystonia had also abnormal temporal
discrimination threshold bilaterally, which may be a predisposal condition to develop
dystonia symptoms (39)
Functional imaging evidences
- PET studies showed diminished rCBF in the contralateral sensorimotor cortex in response to vibro-tactile stimulation in the affected and non-affected hand of patients with various
forms of unilateral dystonia (40),
Electrophysiological evidences
- Somatosensory homunculus (explored by somatosensory evoked potentials) was altered in focal hand dystonia (41)
16 - There is a reduced distance between the representational zones of the digits in primary
somatosensory cortex for the affected hand of dystonic musicians compared with the
representations of the digits in non-musician control subjects, explored in MEG (42)
- MEG studies showed bilateral disorganized S1 somatotopy in patients with task-specific dystonia, with enlarged and overlapping receptive fields (43)
- Same results were obtained in an fMRI approach in writer’s cramp (44)
- In a monkey models of dystonia, receptive fields of the sensory cortical neurons were
larger, responding to multiple parts of the body (45).
Sensorimotor integration* dysfunction
Clinical evidence- Highly skilled motor behavior need simultaneous integration of sensory inputs
- overtraining of highly temporally and spatially correlated repetitive sensory inputs can trigger dystonia in monkeys (45) ,
- the tonic vibration reflex (TVR) can reproduce dystonic symptoms (33)(46)
Test evidence
- Disturbance of perceptual body representation: rubber hand illusion* is altered in dystonia (47), in link with an integration defect of visuo-tactile information with proprioceptive
information.
- Abnormal temporal expectation: disturbed temporal prediction of the end of a visual body motion was found in WC patients compared to controls, suggesting alteration of writing
movement representation in dystonia, in favor of alteration of non-motor (sensory,
cognitive) aspects related to movement processing and planning (48).
17 - Planning level abnormality: an fMRI study found increased dorsal premotor activity during movement imagination for imagination of writing but not imagination of sharping in WC
(49)
- Altered parietal-premotor connectivity: an fMRI resting state connectivity analyses in WC patients found reduced connectivity between parietal regions and premotor regions
controlling writing (50).
Neurophysiology evidences:
- SAI and LAI TMS protocols deal with sensorimotor integration, most studies of SAI
in WC showed no abnormalities (51)(52)(53), whereas few studies of LAI in FHD found
some defect in homotopic LAI (54)(55),
- during DBS surgery recording in generalized dystonia found dedifferentiation of sensorimotor neurons of the internal part of the globus pallidus and of the sensory and
cerebellar relay nuclei of the thalamus (43),
Maladaptive plasticity
Excessive plasticity and plasticity regulation is considered as a major pathophysiological
feature of dystonia (56).
An excessive tendency to form associations between sensory inputs and motor outputs
(abnormal potentiation) and a failure to weaken already existing associations (deficient
depotentiation) might be responsible for maladaptive reorganization in FHD patients (57).
- Several studies based on PAS protocols found altered LTP-like plasticity in dystonia, in favor of dystonia being a disorder of synaptic scaling*.
- Interestingly PAS protocols were not altered in psychogenic dystonias, whereas abnormal responses in protocols studying inhibition (like SICI) was confirmed in this population (58)
18 - Motor cortex mapping, explored in TMS, is altered with displaced and distorted maps
in writer’s cramp (59) , for some patients bilaterally,
- Patients with cervical dystonia had also abnormal motor cortex mapping (60)
Task-specificity is still an important domain of study. An interesting review (3) discussed its
physiopathology in a dynamic point of view as a defective expert motor skills learning.
As a conclusion, WC pathophysiology is characterized by:
1) Excess of inhibition at various nervous system levels in affected and unaffected parts of the body,
2) Sensory abnormalities, which can be found in unaffected body parts (like temporal discrimination) but also in unaffected relatives,
3) Defective sensorimotor integration, with some motor and sensory cortices mapping abnormalities that can be found in both hemispheres,
4) Maladaptive plasticity, sometimes bilaterally, not found in psychogenic dystonias.
Dystonia treatment
General considerations
Management of dystonia is mainly symptomatic and differs for focal and generalized forms, as
presented in this recent review (61). First line treatment for focal or segmental dystonia consist
in botulinum toxin injections, whereas generalized dystonia are first targeted by drugs like
levodopa, anticholinergic drugs and baclofen. Some of those drugs ares used in a wide range of
dystonic conditions like anticholinergic drugs (trihexyphenidyl), antidopaminergic drugs (like
tetrabenazine), baclofen (GABAB agonist), whereas others are used in particular dystonias:
19 stimulation (DBS) is discussed in severe either generalized or focal/segmental dystonia when
first line therapies have failed. GPi is the most targeted area, but subthalamic nucleus or the
thalamus (ventral intermediate and ventral oral nucleus) are sometimes chosen. What can be
stressed here is the intriguing time-course of response to DBS, improvement is often long
compared to other movement disorders, like STN DBS for Parkinson’s disease, inversely, 30
hours are needed to reach baseline after turning the stimulation off, but after turning on again
previous efficacy is reached in a few hours (62).
Appart from those approaches, physiotherapy is considered as the second line treatment of
focal/segmental dystonias (or a complementary approach to BOT), but is under represented in
clinical routine.
A few series describing attemps with non-invasive brain stimulation techniques, among which
TMS, will be presented briefly at the end of the discussion.
Focus on botulinum toxin
Botulinum toxin (BOT) injections in the affected muscles is the first line treatment for WC. Its
effect lasts usually three months and thus injection has to be performed repetitively. Full
functional recovery is often unsatisfactory. Injections, performed by an expert, need a careful
clinical evaluation and selection of affected muscles (and not compensating ones). Injection of
two or three muscles in one or two points each is usually performed under echographic and/or
EMG control, starting with low doses to avoid disabling muscle weakness (63). The clinical
efficiency is obtained in 1 to 7 days, the maximum efficiency is obtained at 2 to 4 weeks, and duration of effect is of overall 3 months .
Observational studies have showed that most patients have a preserved efficacy over time, some
need a BOT dose adjustment, and few of them develop resistance to the toxin (with antibodies
20 their treatment after two years (63), linked to a lack of subjective efficacy and the unbalance
between efficacy and weakness caused by the injections.
Botulinum toxin was first isolated from a clostridium bacterium. Its mechanism of action as a
blocker of neuromuscular transmission was discovered in 1949. It was first used in strabismus
in 1977. It acts by inhibiting acetylcholine release by the presynaptic nerve termination in the
neuromuscular junction, whose consequence is a motor weakness (extrafusal effect). However,
weakness and efficacy are not correlated. Thus, it has been proposed that BOT also acts on the
muscles spindles (mechanoreceptors sensible to muscle elongation: intrafusal effect), which
consequence is a diminished tonic vibration response, which can last up to 7 months after toxin
injection. This effect is thought to modulate peripheral afferences to the brain, and by
plastic reorganization, to explain this indirect central effect of the peripheral injections.
An alternative theory is that BOT could have a direct central effect thanks to retrograde
transport to the brain, however fewer evidence can be found in literature for this hypothesis
(21)(65).
In FHD, central physiological abnormalities (reciprocal inhibition, cortical maps distortion and
intracortical inhibition), can be modified by botulinum toxin injections, with a good correlation
with clinical benefits: two studies (52, 53), showed reversal of motor cortex abnormalities,
respectively in writer’s cramp and cervical dystonia, sometimes bilaterally hit, after botulinum toxin injection. (52) showed in 5 WC patients that motor cortex displacement and distortion were transiently improved by botulinum toxin injection, but secondary worsened after loss of clinical efficacy at 3 months.
Nevertheless, link between peripheral afferences modulation and modification of central
21
Research hypothesis
Our goal is to better understand WC pathophysiology through the study of BOT mechanism of
action by using robotized and neuronavigated transcranial magnetic stimulation.
We have studied the relationship between:
- WC severity and sensorimotor capacities,
- Functional reorganization (motor cortex mapping) and sensorimotor integration (short afferent inhibition), following peripheral botulinum toxin injections.
We tested the working hypothesis that in WC patients, BOT will have a central indirect effect through modulation of sensory inputs to the motor cortex, thus reorganizing sensorimotor cortex, reflected by electrophysiological parameters modulated by BOT injections:
• At baseline, patients would have
- Clinical disturbance: motor abnormalities, with altered finger tapping reflecting
altered dexterity, and sensory abnormalities, with altered sensory threshold, temporal and spatial discrimination threshold.
- Electrophysiological disturbance with altered cortical excitability profile and aberrant
motor mapping (overlap between fingers), with poor and spatially disorganized SAI.
- More severe WC and more important would be the clinical abnormalities and
electrophysiologic abnormalities.
ð Our study will allow to identify clinical and electrophysiological biomarkers of
focal task specific hand dystonia.
• During the follow-up after botulinum toxin injections, we would expect: - Clinical motor and sensory parameters normalization to baseline;
22 - Electrophysiological parameters normalization, with cortical excitability profile
normalization, and muscle dissociation through better inhibitory afferences to the motor cortex.
- Clinical changes would scale with physiological improvement ð Our study will allow to characterize central effect of BOT.
23
Methods
This prospective monocentric (Centre Hospitalier Universitaire Grenoble Alpes) non-blinded
pilot study explored the link between sensorimotor capacities fluctuations and sensorimotor
representations plasticity in WC patients treated with BOT injections.
General procedure
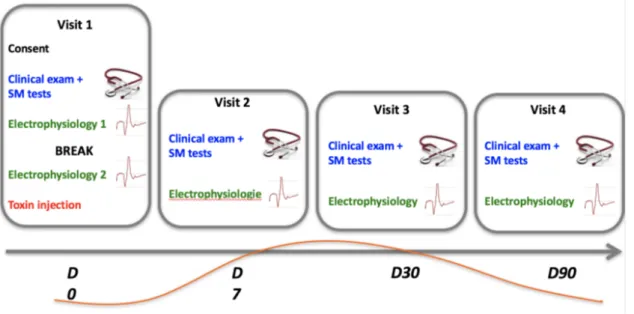
The same experimental procedure (fig 4) was conducted in each patient, before the BOT
injections (baseline), and at 7 days (J7), 1 month (M1), and 3 months (M3) after the botulinum
toxin injection: at each session, patients underwent clinical examination (severity, dexterity,
spatial discrimination task: 15 minutes) and electrophysiological exploration (75 to 90
minutes). Controls had no follow-up, they were tested once, with clinical examination
(dexterity, sensory threshold, temporal discrimination) and electrophysiological exploration.
Fig 4: General experimental procedure. Time line expectation of clinical benefit is drawn in
24
Subjects
Controls were recruited among healthy right-handed, without any history of psychiatric or
neurological disease. Subject gave their informed written consent to the procedure. Ethical
committees approved the study (N°ID/RCB: 2013-A01734-41). Patients were recruited among
the WC patients needing BOT injections at the day hospital of the Neurology Division of the
CHU of Grenoble Alpes. Inclusion criteria were adult WC patients treated with BOT injections.
Exclusion criteria were pregnancy, contraindication to TMS, presence of other neurological or
psychiatric background than dystonia). Subject gave their informed written consent to the
procedure. Ethical committees approved the study (N°ID/RCB: 2016-A01668-43). Study was
registered at clinicaltrials.gov (NCT03085745).
Clinical examination
WC severity was assessed among patients by the WCRS (writer’s cramp rating scale: see
appendix), with a score for abnormal movement (intensity and spreading over muscles, latency,
tremor) (0-28) and a score for abnormal speed (0-2). We also tested writing, but we don’t report
the data here. For controls and patients, dexterity was assessed using a finger tapping test on
a computer keyboard, II and Vth finger were tested, on both hands, the mean number of taps
for 10 seconds was recorded, repeated three times. Spatial discrimination, expressed in mm,
was assessed thanks to Johnson Van Boven Philips Domes, on II and Vth finger of each hands
(66), and corresponds to the patient’s acuity to distinguish horizontal or vertical positioned 3D
25
Peripheral nerve stimulation (PNS)
Peripheral electrical stimuli were given to the fingers through bipolar ring electrodes strapped
around the left index and little finger. We applied square pulses of 200 µs duration with the
cathode positioned at the proximal and the anode positioned at the distal interphalangeal joint
(Digitimer stimulator, Model DS7A, Hertfordshire, England). Perceptual threshold (PT) was
determined for the little and index fingers by a dichotomy method, delivering a series of three
stimuli at 1mA and then at 3mA than approaching the threshold by 3 consecutive stimulation
upper and then lower to the threshold. The PT was defined as the minimal intensity of
stimulation perceived by the participant in 3 out of 3 consecutive stimuli. Temporal tactile
discrimination time was the minimum time between two triple threshold stimulation intensity
were perceived as distinct 50% of times, it was also tested by trial-and-error. The peripheral
stimulation was applied 23 ms prior to the TMS pulse to elicit SAI (7) with inter-trial
interval from 4 to 5 sec, in each participant. Stimulation intensity was set to 300% of individual
PT of each finger for electrical digit stimulation. PNS was synchronized with TMS thanks to
the Signal software (Cambridge Electronic Design).
MRI-based neuronavigation
Either for study necessity (for controls) or in the context of the clinical management of the
patients, high-resolution T1-weighted magnetic resonance images (MRIs) were acquired for all
subjects. As described in (67), an automated cortical reconstruction of the T1-weighted images
was performed using the Localite neuronavigation system (Localite GmbH, Germany).
Processing of T1 high-resolution MRIs was performed using the TMSNavigator software
26 thanks to an infra-red points tracking between the subject’s head and its targeted MRI (see
further) (fig. 5).
Robotized transcranial magnetic stimulation
We used a MagPro x100 unit (MagVenture A/S, Denmark) connected to a cool-MC-B35
figure-of-eight coil (MagVenture A/S, Denmark) with windings of 35 mm diameter, held by the
Axilum Robotic TMS-Robot-2 (Axilum Robotic, (Strasbourg, France). This set-up allows a
2mm mean square position error and a better comfort for the experimenter (Sylvain Harquel.
Robotized Transcranial Magnetic Stimulation: from automatized protocols towards new
approaches in functional neuroimaging. Neurosciences. Université Grenoble-Alpes, 2017.
Français). Single-pulse TMS was performed. In order to keep TMS as spatially confined as
possible, we used a biphasic pulse configuration generating an antero-posterior followed by
postero-anterior (AP–PA) current in the brain.
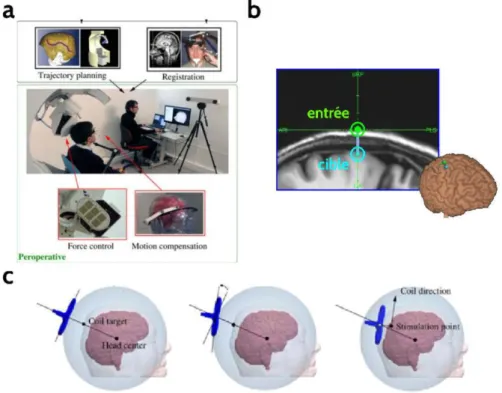
Figure 5. Functioning of the TMS robot developed by Axilum Robotics: a- general principal
of the robot-neuronavigation interface. B- target pointed by the robot-entry vector. C- movement phases allowing bobbin alignement with the target-entry vector.
27
Electromyography
We recorded the electrical muscle activity of the first dorsal interosseus (FDI) and the abductor digiti minimi (ADM) muscles of the dominanat hand simultaneously via single
subject surface electrodes using a bipolar belly-tendon montage. The analogic EMG signal was
amplified by means of a D360 (Digitimer Hertfordshire, United Kingdom), sampled at 12KHz
acquired via the Signal software (Cambridge Electronic Design, Cambridge, United Kingdom),
recorded from 100ms before and 120 ms after the TMS stimulation. (Cambridge Electronic
Design) and finally stored on a computer for offline analysis.
Experimental procedure
Electrophysiology.
- PNS: first we searched for the sensory threshold and measured the sensory temporal discrimination on the II and V finger (as defined earlier)
- TMS:
Resting motor threshold (RMT) was defined after a few stimulations over each M1
targets, beginning at 55% of the maximum stimulation intensity for the first session
(baseline), and then a little bit higher than the patient’s motor threshold for the other
sessions. Then, the RMT was defined on the hot-spot using the Maximum-Likelihood
Strategy using Parameter Estimation by Sequential Testing (MLS-PEST) approach.
Mapping procedures: TMS target locations in the precentral gyrus were marked prior to the
experiment on the segmented brain of each subject. The right M1HAND was identified by a
trained investigator using the characteristic knob-like shape of the sulcus (“hand knob”) as
anatomic landmark (68). The investigator placed seven (or six) targets in the posterior part of
28 curvature of the hand knob, forming a line of equidistant targets every 10 mm. For each of the
seven (or six) targets we applied 20 pulses delivered at inter-stimulus intervals jittered between
4 and 5 s. In each stimulation block, the order of conditioned (10 pulses preceded by electrical
stimulation) and unconditioned MEPs (Test stimulus alone, 10 pulses) was pseudo-randomized.
The intensity of TMS stimulator was set in order to get an average MEP amplitude in the ADM
muscle around 0.2-0.5 mV. Mean MEP amplitude value is measured so as to construct an
excitability profile along the central sulcus for the FDI and ADM (67).
Data analysis
The clinical tests were compared to baseline. Given the small sample size, only qualitative
descriptions will be performed.
Pre-processing of EMG recordings was performed using the CortexTool software (Harquel S.,
Beynel L., Guyader N., Marendaz C., David O., Chauvin A. CortExTool: a toolbox for
processing motor cortical excitability measurements by transcranial magnetic stimulation.
2016). It first consisted of removing artifacted trials and trials with too much spontaneous
contractions. Then, the MEPs were considered if happening 15 to 45 msec after the TMS pulse
and if they had at least of 40 microV peak to peak amplitude. Mean PEM amplitude and
standard deviation were calculated for each target for TMS pulse only (unconditioned MEP)
and for short afferent inhibition (SAI) stimulation protocol (PNS+TMS or conditioned
MEP). SAI was obtained by dividing each conditioned MEP amplitude by the respective
unconditioned MEP (=SAI ratio). We generated muscle excitability profiles for the TMS
pulse alone (unconditioned MEP or TS) and for the MEP preceded by peripheral stimulation
(conditioned MEP or SAI) along the targets. We explored the effect of PNS on TS in different
conditions: homotopic afferent interaction (median nerve stimulation on the IInd finger with
29 evoked TMS potential recorded on the Vth finger) as well as heterotopic afferent interaction
(median nerve stimulation on the IInd finger with TMS evoked potential recorded on the ADM,
and ulnar nerve stimulation on the Vth finger and evoked TMS potential recorded on the FDI).
We computed two additional indicators of cortical excitability. First, for patients only, we
calculated the area under the curve (AUC) to assess the effect of different peripheral
stimulation intensities during heterotopic and homotopic stimulation. AUC was calculated
according to the following formula:
𝑨𝑼𝑪 = 𝑴𝒆𝒂𝒏 𝑴𝑬𝑷 𝑨𝒎𝒑𝒍𝒊𝒕𝒖𝒅𝒆 𝑻𝒂𝒓𝒈𝒆𝒕(k)
𝟕
𝒌8𝟏
Target (k) refers to each target’s number (from 1 to 7) and Mean MEP Amplitude Target (k)
refers to the mean peak-to-peak Motor-Evoked-Potential amplitudes at each target (from target
1 to target 7). This indicator reflects the up or down regulation of the global corticospinal
excitability recorded from a single muscle (67)
We also computed the amplitude-weighted mean position, denoted here as the center of
gravity (CoG) of each muscle profile to return the one-dimensional muscle location along
M1HAND (59). WMP was calculated according to the following formula:
𝑾𝑴𝑷 = 𝟕𝒌8𝟏Target(k) * Mean MEP Amplitude Target(k) 𝑴𝒆𝒂𝒏 𝑴𝑬𝑷 𝑨𝒎𝒑𝒍𝒊𝒕𝒖𝒅𝒆 𝑻𝒂𝒓𝒈𝒆𝒕(k)
𝟕 𝒌8𝟏
Distinct weighted mean positions associated with the two muscle profiles suggest distinct
corticomotor representations for the two muscles.
30
Results
Subjects
Fifteen right-handed controls, mean age 25,5 +/-6,4 years, 2 males, were included. Six patients
with WC aged between 37 and 55 (mean 46 +/- 8,83 years) were included in the study from
April 2017 to March 2018 (Table 1, in appendix). One patient could not complete the whole
experiment because of an elbow trauma without any relationship with the present study, and
was excluded. Another patient had an hypotrophic contralateral hand with many contractions
during the experiments, so we could not assesse his data in this study. Three out of the four
remaining patients were right-handed. None had movement disorder family history or a genetic
mutation for dystonia. Time since diagnosis ranged from 2 to 20 years. Patient 01 and 02 were
not totally task-specific and their symptoms were a focal hand dystonia (P02) or a segmental
dystonia (P01), but all of them were initially affected by a typical unilateral writer’s cramp.
When other tasks were affected, it concerned sharp repetitive hand/finger movements like
tooth-brushing or peeling. All patients had a high need of present or past handwriting due to
their occupation. Symptoms were mainly a lack of function, but also pain or abnormal postures.
All patients had already had BOT injections from 3 to 8 years, which reflects sort of an efficacy
of the injections, as clinicians decided to pursue the injections. Last injection was at least 3
months before the baseline assessment and when the subjective effect had vanished. BOT
injections were done with Xeomin®, Dysport® or Botox® using different dose for clinical
31
Clinical features at
baseline and changes induced by the BOT injections
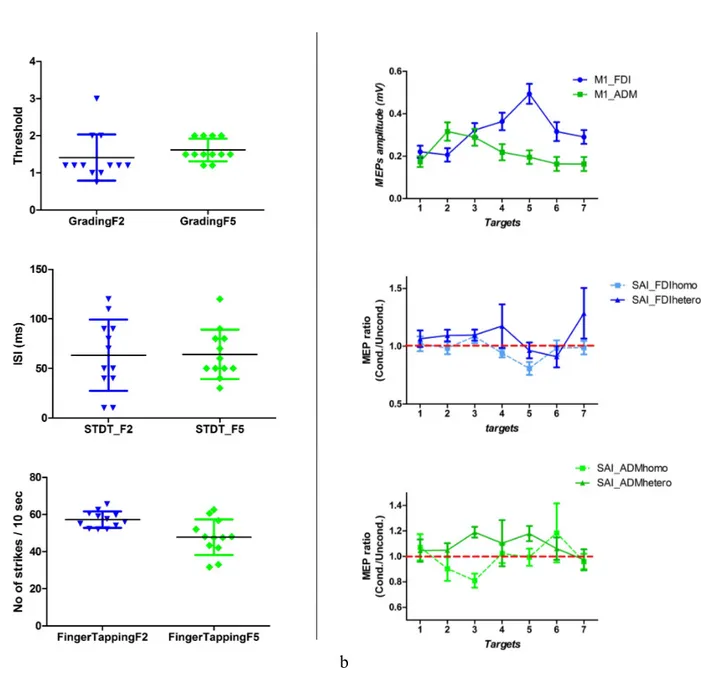
Clinical features at baseline
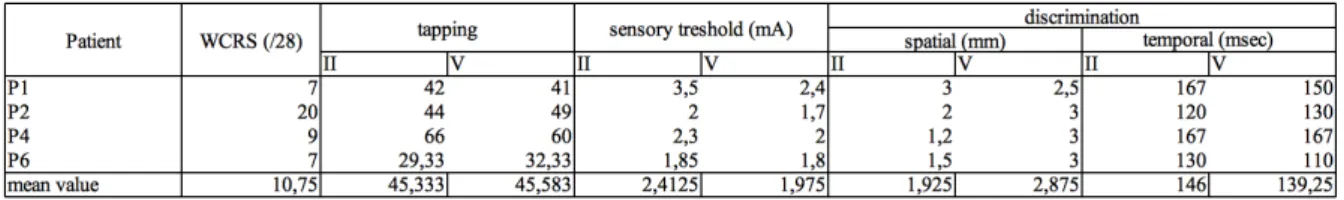
Table 2: Clinical feature at baseline for the four patients: WCRS, tapping in 10 sec, sensory
threshold, spatial and temporal discrimination.
Table 3: Clinical feature’s mean value +/- SD at baseline for the controls (n=15) and the
patients (n=4) for the II and V fingers and difference between the two fingers mean values: finger tapping in 10 sec, sensory threshold (mA), temporal discrimination (ms).
Mean WCRS was 10.75 out of 28. P01 and P06 had the minimum (WCRS=7), P02 had the
maximum (WCRS=20). Mean finger tapping value was 45,33 (II) and 45.58 (V). As a matter
of comparison controls (n =15) had mean value of finger tapping of 57.2 and 47.75,
respectively for II and V.. Mean sensory threshold (ST) was 2.4 mA on the II and 1,9 mA on
the Vth. Sensory threshold was higher on the II finger (mean 2,4; 1,8 to 3,5) than on the V
finger (mean 1.9; 1,7 to 2.4). As a matter of comparison, mean controls value for ST was 1.413
mA and 1.617 mA respectively for II and V finger. Patients mean spatial discrimination (SD)
was 1.9 mm on the II and 2.8 mm on the V. Patients’ SD was better on the II than the V finger
(1,9 mm, ranging 1.2 to 3.0 mm; vs 2.8 mm, ranging 2.5 to 3.0 mm). Mean temporal
discrimination was 146.0 ms (II) and 139.25 ms (V). As a matter of comparison mean controls value for TD was 63.33 and 64.17 ms for TD, respectively for II and V.
32
Clinical features follow-up
P01
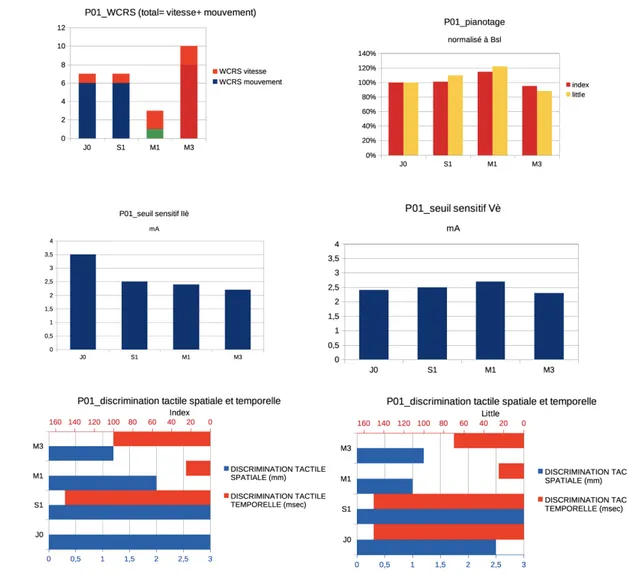
Figure 6: P01 clinical features at baseline and during follow-up for the affected hand. From left
to right and top to bottom: WCRS, tapping (pianotage) in the II and V finger normalized to Baseline (J0), sensory threshold (seuil sensitif) respectively in the II and V finger, spatial and temporal discrimination for the index and little finger at J0, S1 (=J7), M1 and M3.
Motor parameters: WCRS improved at M1 at its best (43% Bsl), then worsened at M3.
Tapping, both for fingers II and V improved better at J7 and M1 and worsened at M3. Sensory
parameters: Sensory threshold on II improved at J7, subsequently at M1 and M3; on V it
remains stable (with a slight worsening at M1). Temporal tactile discrimination on the II was
low at M1 and worsened at M3, whereas on the V it improved at M1 and worsened at M3.
Spatial tactile discrimination improved at M1 and M3 for finger II, it worsened at J7, improved
33
In summary, results for P01 showed a clear trend towards an improvement for both motor and sensory parameters at M1 and towards a deterioration at M3.
P02
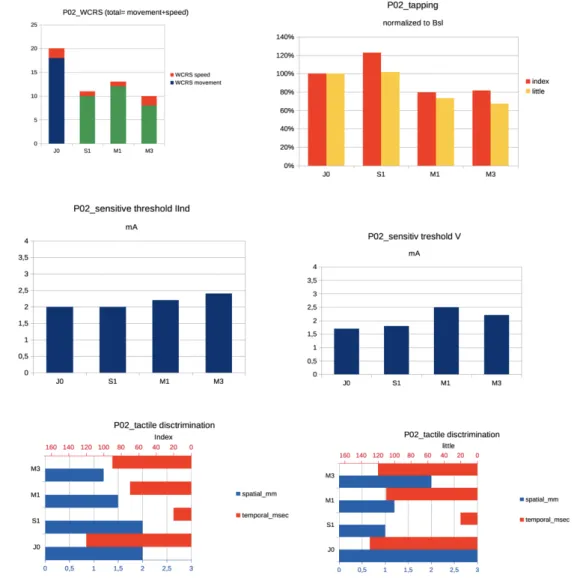
Figure 7: P02 clinical features at baseline and during follow-up for the affected hand. From left
to right and top to bottom: WCRS, tapping in the IInd and Vth finger normalized to Baseline (J0), sensory threshold (seuil sensitif) respectively in the IInd and Vth finger, spatial and temporal discrimination for the index and little finger at J0, S1 (=J7), M1 and M3.
Motor parameters: WCRS improves soon at J7, is the lowest at M3 (50% Bsl), does not worsen
at M3. Tapping improves at J7 and worsen at M1 and M3 for both fingers. Sensory parameters:
sensory threshold remains stable on the IInd, it gets worse at M1 for the Vth. Temporal tactile
34 discrimination improves at M1 and M3 for the IInd, it improves at J7 and M1 than worsen at
M3 for the Vth.
In summary, for P02, improvement both for motor and sensory parameters is earlier at J7 with a secondary worsening at M1 or M3 comparing to P01. For WCRS, improvement persists.
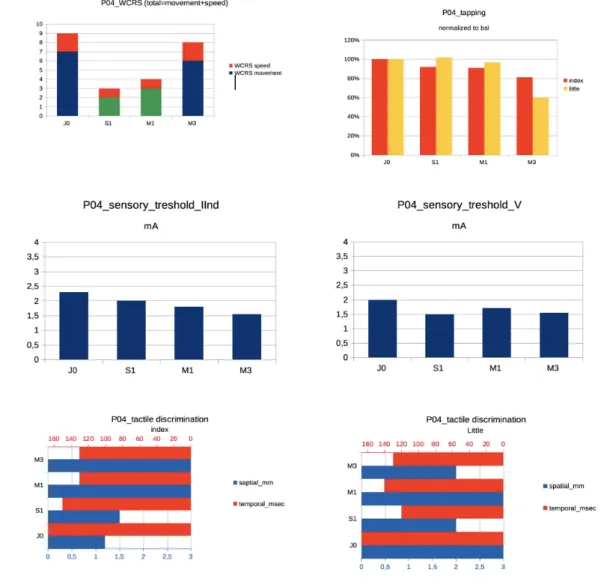
P04:
Figure 8: P04 clinical features at baseline and during follow-up for the affected hand. From left
to right and top to bottom: WCRS, tapping in the IInd and Vth finger normalized to Baseline (J0), sensory threshold (seuil sensitif) respectively in the IInd and Vth finger, spatial and temporal discrimination for the index and little finger at J0, S1 (=J7), M1 and M3.
Motor parameters: WCRS started to improve at J7, with the best improvement at J7 (33% Bsl),
35 V. Sensory parameters. Sensory threshold improved at J7, then M1 and M3 for the II, and
remained stable for the V. TD improved at J7, then M1 and M3 for the II; for the V it initially
improved (J7), then it remained stable. SD worsened on the II and V with an initial improvement
at J7 for the V.
In summary, for P04, a slight improvement in motor (WCRS, V tapping) and sensory parameters (sensory thresholds, TD, V SD) was seen at J7 followed by a worsening at M1 and M3.
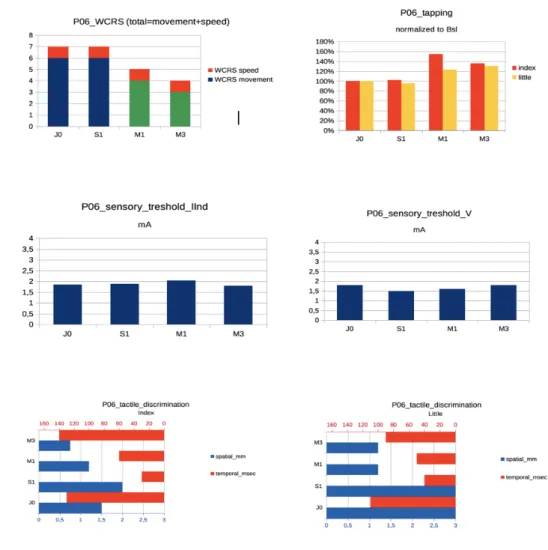
P06:
Figure 9: P06 clinical features at baseline and during follow-up for the affected hand. From left
to right and top to bottom: WCRS, tapping in the IInd and Vth finger normalized to Baseline (J0), sensory threshold (seuil sensitif) respectively in the IInd and Vth finger, spatial and temporal discrimination for the index and little finger at J0, S1 (=J7), M1 and M3.
36
Motor parameters: WCRS started to improves at M1, with the best improvement seen at M3
(57% Bsl). Tapping improved at M1 for both fingers, then the improvement continued at M3
for the V but not for the II.
Sensory threshold remained stable for both finger. TD improved at J7 for both fingers, then
worsened at M1 and M3. SD worsened or was stable at J7, and improved at M1 and M3.
In summary, for P06, motor parameters (WCRS, tapping) improved at M1, whereas sensory parameters improved at M1 (SD) or earlier (TD), or remained stable (ST).
In summary:
- At baseline, comparing data with heathy volunteers, WC patients showed altered
performances in all domains (finger tapping, sensory threshold, temporal discrimination).
- During the follow-up, there was
o A trend towards an improvement at M1 for all parameters (motor parameters,
i.e. WCRS and tapping, and sensory parameters i.e. sensory threshold, spatial and temporal discrimination),
o A trend toward a deterioration at M3 for all parameters,
o A trend to have motor and sensory parameters modulated in parallel,
o Different dynamics of improvement across patients: P02 improvement was
earlier at J7, for both motor and sensory parameters; P04 tended to run in the same way.
37
Electrophysiological parameters at baseline and changes after botulinum
toxin injections
Muscle profiles
Graph 1: Muscle profiles in controls. Mean MEP amplitude for each target (1 to 7 medially
to laterally) for FDI and ADM show that maximum MEP amplitude was found on M2 for ADM and on M5 for FDI.
38
Figure 10: Muscle profiles in patients: shows for patients P01, P02, P04 and P06 (from top
to bottom), and for FDI (index) on the left and ADM (little) on the right, mean amplitude of motor evoked potentials (upon 10 to 20 stimulations) over targets M1 to M6 (medially to laterally over the precentral primary motor cortex). Scale is not normalized beyond subjects and for the same subject beyond muscles (FDI/ADM).
The inspection of the muscle profiles in controls shows that, as attended, FDI representation is
more lateral than ADM on the primary motor cortex (graph 1). In patients as well (figure 10)
at baseline and during follow-up, FDI was more lateral than ADM.
39
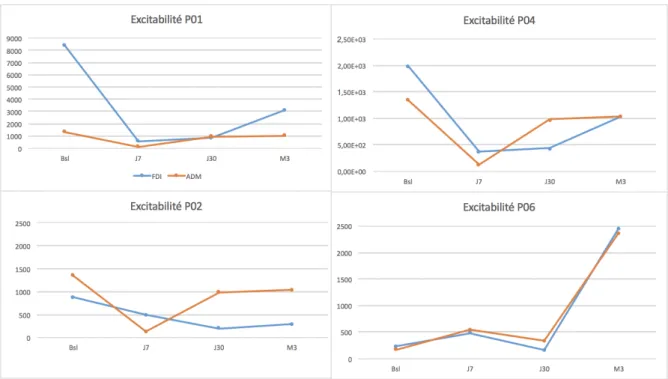
Cortical excitability and motor mapping at baseline and during follow-up
To better characterize the changes in global excitability, we computed the AUC (see methods)
(fig. 11), which represent the finger representation in a quantitative way and the CoG (which
represents the weighted mean position, as described in methods) reflecting spatial changes
along the longitudinal axis of the central sulcus.
To note, 50 microV RMT was stable over session for all the patients.
Figure 11: AUC curves for patients. For the four patients, AUC excitability curves at each
session from baseline to M3 for FDI (blue) and ADM (red). Scale is normalized between subject for P02, P04 and P06 but nor P01.
40
Figure 12: CoG slopes for patients. For the four patients, Center of Gravity (CoG) of the MEP
amplitude for FDI (blue) and ADM (red), for each session from Baseline (Bsl) to M3.
P01:
At baseline, this patient showed the highest differences of cortical excitability between FDI and
ADM, with a greater FDI muscle representation compared to the ADM muscle (fig. 11). FDI
and ADM CoG were distinct, with FDI more lateral than ADM (M5-M4). (fig. 12)
Follow-up showed a diminution of FDI PEM amplitude at J7 which increased a little at M1 and
then at M3, but remained inferior to baseline. ADM PEM remained stable (fig. 11). Center of
gravity of the maximum PEM changed from baseline to other conditions, with a loss of
distinction between ADM and FDI. CoG moved medially, at J7, from M3 (ADM)-M4(FDI) to
M2 (fig. 12).
P02:
At baseline, cortical excitabilities on FDI and ADM were similar. Cortical excitability at
baseline was the highest compared to all the other sessions. (fig. 11). FDI and ADM CoG were
distinct, with FDI more lateral than ADM (M4-M3). (fig. 12)
Follow-up showed that FDI cortical excitability reached its minimum at M1 and then raised but