ORIGINAL ARTICLE
Reference equations for ultrasound bone densitometry
of the radius in Central European children and adolescents
M. J. Scherrer&M. K. Rochat&D. Inci&A. MoellerReceived: 27 March 2014 / Accepted: 1 July 2014 / Published online: 16 July 2014 # International Osteoporosis Foundation and National Osteoporosis Foundation 2014
Abstract
Summary Bone density measurements are important for eval-uation and follow-up of children with alterations in their mineral status (increased risk for fractures and osteoporosis subsequently). Interpretation of these measurements relies on the availability of appropriate reference equations. We devel-oped gender-specific, age-dependent reference values of bone density for Central European children.
Introduction In recent years, there has been an increasing demand for the measurement of bone density in children exposed to an increased risk of early alterations in their bone status. These values must be compared to an adequate refer-ence population. The aim of the present study was to create reference equations of radial speed of sound (SOS) for Central European children and adolescents.
Methods In this cross-sectional study, SOS values were mea-sured at the distal third of the radius in 581 Swiss children and adolescents (321 girls and 260 boys) aged 6 to 16 years using the Sunlight Omnisense® 7000P quantitative ultrasound system.
Results Gender-specific reference equations for SOS values were derived by polynomial regression and combined a cubic dependence of age and a linear dependence of height. The
fitted SOS curves in our study population show a plateau period in both genders for younger ages followed by an increase phase beginning at the age of 12 in girls and 14 in boys. Neither the reported level of physical activity nor addi-tional sport nor self-reported calcium intake influenced the reference equations.
Conclusions Our results show a good agreement with similar studies using the same measurement technique on other body parts, suggesting a wide applicability of the obtained reference curves over different European populations.
Keywords Bone density . Quantitative ultrasound . Radius . Reference equations . Speed of sound
Abbreviations
SOS Speed of sound
DXA Dual-energy X-ray absorptiometry QUS Quantitative ultrasound
PBM Peak bone mass
Introduction
The development of bone density and mineral status in chil-dren and adolescents is of great relevance, as the majority of peak bone mass (PBM) is achieved by late adolescence [1]. An optimal PBM, in turn, is important to prevent fractures and osteoporosis in later life [2]. Bone density is not only influ-enced by extrinsic factors such as physical activity [3], nutri-tion [4,5], or medication [6] but also by intrinsic factors such as genetics (explaining up to 80 % of PBM variance) [7–9], gender, ethnicity, endocrine status [10,11], and chronic ill-nesses [12,13]. Thus, the demand for gender-specific and age-dependent reference values of bone density for children who are exposed to an increased risk of early alterations in their
Michael J. Scherrer and Mascha K. Rochat contributed equally to this work.
Electronic supplementary material The online version of this article (doi:10.1007/s00198-014-2807-1) contains supplementary material, which is available to authorized users.
M. J. Scherrer
:
D. Inci:
A. Moeller (*)Department of Respiratory Medicine, University Children’s Hospital of Zurich, Steinwiesstrasse 75, 8032 Zurich, Switzerland
e-mail: [email protected] M. K. Rochat
Department of Pediatrics, University Children’s Hospital of Lausanne, 1007 Lausanne, Switzerland
bone status (due to e.g., inflammatory bowel disease or cystic fibrosis) has grown during the last years. The quantitative ultrasound (QUS) technique is often applied to assess bone density in children, as the device is safe, easy to use, cost-effective, portable, and radiation-free [14].
Previous studies have reported normative data for QUS variables measured at the heel [15–19], proximal hand pha-langes [20–22], tibia (mid-shaft) [23–25], and radius (distal third) [23,25]. The distal third of the radius is a convenient region of interest in clinical practice, as the forearm is quickly and easily accessible. Due to the comfortable sitting posture of the child and the operator, the communication remains unim-peded during the QUS measurement, which enhances com-pliance. Reference values for these measurements have been presented for some individual countries [23,25]. However, to our knowledge, no radial QUS reference values in children and adolescents have been established in a Central European population to date.
The aim of our investigations was, therefore, to create pediatric reference equations of radial speed of sound (SOS) measurements in children and adolescents for a Central European population and to investigate effects of intrinsic and extrinsic factors on SOS.
Subjects and methods Subjects
We performed a cross-sectional survey of 581 children and adolescents (321 girls and 260 boys) aged 6 to 16 years attending primary, secondary, and academic high schools in Eastern Switzerland. In each school, teachers distributed a short questionnaire (additional data are given in Online Resource1) to be completed by the students themselves or the parents of all children between the ages of 6 and 16. An informed consent was obtained from the children’s parents for questionnaire data and bone density measurement. The study was approved by the local ethical board and the school board of every participating school.
Study protocol
Anthropometric data and basic health information were collected from the participants. Using a questionnaire (additional data are given in Online Resource1) complet-ed by the parents of the students, the following data were collected: age, gender, weight, height, handedness, previ-ous fractures, chronic illnesses, and current medication. Weight (in kilograms) and standing height (in centimeters) were measured according to WHO recommendations [26]. BMI was calculated by the quotient of weight (in kilo-grams) and height (in square meters).
Quantitative ultrasound
QUS measurements of the nondominant distal radius were performed using the Sunlight Omnisense® 7000P device (Sunlight Medical Ltd., Tel Aviv, Israel). The technique is based on the axial transmission of inaudible high frequent sound waves along the cortical bone at a center frequency of 1.25 MHz. The waves are generated by two transmitters in the handheld probe. The SOS is influenced by different bone variables (such as density, architecture, and elasticity) and is measured by the two receivers of the same probe. The distal radial QUS was measured at the point halfway between the tip of the outstretched middle finger and the olecranon. To opti-mize the contact between probe and examined skin, an ultra-sound coupling gel was used for transmission.
System quality verification: phantom
The quality of the measuring system was verified by a spe-cially designed phantom, supplied by the manufacturer, consisting of homogenous hard polymers. Depending on tem-perature, the phantom adapts its SOS value, imitating physical properties of the bone. On each measurement day, the SOS value of the temperature-equilibrated phantom was measured together with the room temperature and compared to internal standard values of the instrument. In this way, the temporal stability and accuracy of the system was ensured.
Statistical analysis
Statistical analysis was performed with the software SAS 9.2 (The SAS Institute, Cary, NC). The frequency of the popula-tion characteristics was compared between boys and girls using theχ2test for nominal or categorical variables and the t test for continuous variables. Reported p values are two-sided. p values <0.05 were considered significant.
For the analysis, we defined the following parameters: – Additional sport was defined as children participating in
physical activities additional to sports lessons at school. – Calcium intake was defined as the cumulative intake of
milk or milk products. Four categories were determined: (1) no milk or milk products intake, (2) milk or milk products intake a few times a week, (3) daily intake of milk or milk products, and (4) intake of milk or milk products several times per day.
– Chronic illnesses were defined as answering yes to one of the following:“Do you have asthma, chronic cough other than asthma, neurodermatitis, pollinosis, attention deficit hyperactivity disorder (ADHD), a cardiovascular disease, a musculoskeletal disease, a gastrointestinal disease, a neurological disease, or another disease?”
– Current medication was defined as answering yes to one of the following:“Do you use inhaled steroids, topical steroids for the skin, topical nasal steroids, other asthma medications, medication for ADHD, any contraceptive agents, or any other medications?”
The reference equations were estimated using the QUANT REG package in SAS 9.2. The relationship between the bone density parameter and the explanatory variables age and height stratified by gender was modeled. Weight was not included as it did not influence the SOS values. Prediction equations for the 10th, 25th, 50th, 75th, and 90th quantiles are shown as they correspond to clinically relevant cutoff points. The model fit was tested by R squared (fraction of explained variance) and likelihood ratio (LR) test as well as graphical residual analyses.
Results
Study population
Altogether, 749 questionnaires were distributed. Bone density was measured from the 581 children whose questionnaires were returned (response rate of 77.6 %). The study population consisted of 581 children and adolescents, 260 (44.7 %) boys and 321 (55.2 %) girls, with an age range between 6 and 16 years. Most of the children reported no impairments to health (80.21 %), did not take any current medication (93.29 %), and did not have any previous fractures (78.49 %). Twenty-two of the children reported a diagnosis of asthma, with only two being on inhaled corticosteroids. None of the remaining children had chronic diseases or were on medications, which are expected to affect their bone status and were therefore included in the data analysis. Significantly, more boys reported to perform additional sports than girls (86.7 vs 79.1 %; p=0.016), and there were no other significant differences between girls and boys regarding study population characteristics. Additional characteristic features of the study population are compiled in TableAof the online repository. Speed of sound distribution
In boys, the mean observed SOS was 3,792 m/s (standard deviation 97.94) with individual measurements ranging be-tween 3,548 and 4,086 m/s. In girls, the mean SOS was 3,857 m/s (standard deviation 138.95) with individual mea-surements ranging between 3,575 and 4,202 m/s. In Table1
and Fig.1, the mean and standard deviation of SOS values measured at radius for each age class separated by gender are shown. In the lower age range, the differences between both genders and age classes are relatively small. However, the mean SOS values show a distinct increase beginning at the age
of 12 years in girls, whereas in boys, the increase starts only about 2 years later, at the age of 14 years. Accordingly, the values for girls are higher above the age of 13 years. The difference between males at 14 years and females at 12 years was not statistically significant (p=0.3286) possibly due to the small sample size of these specific ages (29 males at 14 years; 26 females at 12 years).
The increase in mean SOS over the entire investigated age range is about three times larger in girls than in boys. Table1
also includes the medians of the age classes. Differences between arithmetic means and medians are relatively small and not systematic, indicating a near-symmetric statistical distribution of the SOS values within the age classes. Reference equations
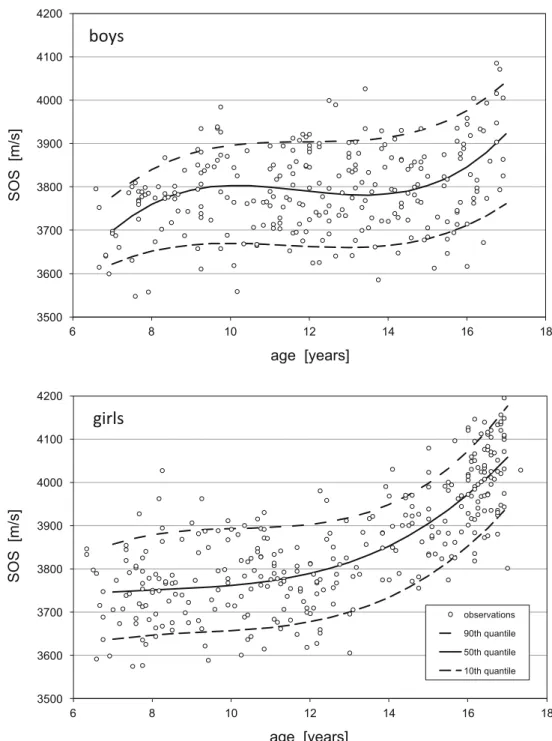
Gender-specific reference equations for median SOS values and other quantiles were derived by regression analysis, and the best fit for both genders was obtained by a combined cubic dependence of age and a linear dependence of height. Residual analyses were performed graphically for the models and are shown in Fig.2. The comparison with the theoretical distributions indicates that the data points have a near-ideal Gaussian distribution around the fitted model equation. Within the quantile regression framework, we estimated ref-erence equations for the 10th, 25th, 50th, 75th, and 90th quantiles using all SOS values (Table2). A graphical repre-sentation of the fitted equations together with the measured SOS data points as a function of age and stratified by gender is shown in Fig.2. For the curve plots, the mean height for each age class and gender was used. The curves show a plateau period in both genders for younger ages followed by an increase phase beginning at the age of 12 years in girls and at 14 years in boys. For this model, the r2for boys was 0.16 and the LR test was p=0.006. For girls, the r2was 0.60 and the LR test was p<0.001. Thus, the fitted model equations show a significant correlation for both genders, but the explained variability is much lower for boys than for girls. Although the data of the entire study population were included in the fitting of the reference equations, we recommend the use of the equations only for children in the age range of 7–16 years as there were only 16 children under the age of 7.
Most of the children considered themselves fit (183/581, 31.5 %) or very fit (389/581, 66.9 %), and only a minority reported to be little (8/581, 1.5 %) or not fit (1/581, 0.1 %). This made the variable difficult to test in this population. Similarly, most of the children declared to take no medication (542/580, 93.45 %). According to the questionnaire, two children regularly used inhaled corticosteroids, two children nasal steroids, and five other nonsteroidal asthma medications. One child reported the use of topical steroid creams and eight children medication for ADHD; 1 girl was on contraceptive medication, and 19 children reported “other” medications,
which also makes the variable difficult to test. For the total population, we found no significant effects of reported calci-um intake (p=0.4665) and additional physical activity (p= 0.8799) on SOS.
Discussion
In the present study, we developed gender-specific reference equations for Central European children aged 6 to 16 years using radial SOS measurements. In our study population of 581 healthy children, the SOS curves show a plateau period in both genders for younger ages followed by an increase phase beginning at the age of 12 years in girls and 14 years in boys. Our results show a good agreement with similar studies in Israel [23] and Greece [25] in the age range 6 to 16 years using the same device (Sunlight Omnisense® 7000P) and site (distal
third of the radius). Besides reference equations for QUS at the radius, reference databases of calcaneal [15–19], phalangeal [20–22], and tibial QUS [23–25] have been discussed in previous studies. Nevertheless, the findings of these investi-gations are more difficult to compare with our results, as other regions of interest and different ultrasound techniques were used for the measurements.
In our study, there are considerable gender differences between the SOS increases in boys and girls. As shown in Fig.1, in boys, there was a tendency for slightly lower SOS values at the age of 10 years and, again, at the ages of 14 and 15 years with an increase thereafter, whereas in girls, the SOS values declined at the age of 11 years and a steeper increase starts at the age of about 12 years. As the number of partici-pating boys at the age of 10 years was lower than that at the other age groups (n=15), we cannot exclude that the sample size was explaining this finding. On the other hand, the
Table 1 Sample size (n), arith-metic mean, standard deviation (SD), and median of radial SOS (in meter/second) for age classes in boys and girls
Age class Boys Girls
n Mean ±SD Median n Mean ±SD Median 6 6 3,675 ±80 3,642 10 3,725 ±94 3,732 7 20 3,731 ±79 3,768 29 3,744 ±84 3,743 8 17 3,767 ±51 3,775 27 3,763 ±93 3,750 9 27 3,817 ±97 3,838 22 3,790 ±101 3,787 10 15 3,732 ±87 3,762 30 3,794 ±94 3,819 11 36 3,793 ±79 3,784 28 3,750 ±61 3,761 12 29 3,790 ±101 3,778 26 3,789 ±87 3,782 13 31 3,809 ±98 3,834 15 3,823 ±101 3,849 14 29 3,801 ±75 3,795 21 3,889 ±79 3,901 15 23 3,781 ±93 3,765 30 3,909 ±89 3,892 16 27 3,874 ±120 3,864 81 4,023 ±86 4,025 3500 3600 3700 3800 3900 4000 4100 4200 5 6 7 8 9 10 11 12 13 14 15 16 17 SOS (m/s) age (years) boys girls
Fig. 1 Arithmetic means and standard deviations of observed radial SOS values for age classes in boys and girls. For illustrative purposes, the data are slightly shifted horizontally. Number of data in each age class is shown in Table2
decreases at 14/15 years in boys and 11 years in girls are very likely to be at least in part explained by hormonal changes during puberty. Similar age-dependent differences in SOS have been described in other studies [21–23] with a flattening [21,22] or slight decrease [23] of SOS values in boys between the ages 9–14 years and a flattening of SOS values in girls aged 6 to 10 years [21,22] or 9–12 years [23], respectively, and correlated with pubertal stages [21–23].
These age-dependent differences in SOS have been de-scribed in other studies [21–23]. In our study, the overall increase of SOS with age in boys was weak, and thus, the explanatory power of the fitted model was significantly lower
than for girls. The gender differences are similar to the findings of several previous studies using different QUS techniques at different regions of interest [18, 20–23, 25] but differ from others [16,17]. Possible causes affecting gender differences that have been discussed in the listed literature are the physio-logically later onset of puberty-related bone growth [19–21] in boys, the influence of sex steroids [19] in boys, a potentially stronger reduction in relative soft tissue thickness in girls fol-lowing puberty [20], as well as the changes in bone architecture and in the different bone properties [24]. For these reasons, the development of bone density in boys is more difficult to explain than the development of bone density in girls.
3500 3600 3700 3800 3900 4000 4100 4200 6 8 10 12 14 16 18 SOS [m/s] age [years]
boys
3500 3600 3700 3800 3900 4000 4100 4200 6 8 10 12 14 16 18 SOS [m/s] age [years] observations 90th quantile 50th quantile 10th quantilegirls
Fig. 2 Statistical age-dependent curves according to the reference equations for SOS measured at the distal third of the radius (Sunlight Omnisense®; Sunlight Medical Ltd., Tel Aviv, Israel) in boys (n=260) and girls (n=321), illustrated by the 90th to 10th quantiles. Mean height for each age in boys and girls was taken. The slight decrease of the fitted medium curve (50th quantile) for boys in the age range 11 to 13 years is not statistically significant
Due to characteristics such as the lack of radiation exposure, the possibility of examination at bedside, the cost-effectiveness, as well as the easy, fast, and safe handling of the device, QUS is particularly indicated to assess repeatedly bone mineral status in children. In a 7-year follow-up study, Trimpou et al. [27] showed a strong positive correlation between QUS measure-ments and both bone mineral density (BMD) and bone mineral content (BMC) measured with dual-energy X-ray absorptiom-etry (DXA), indicating that the accuracy and precision of QUS is very high [27]. Therefore, QUS may be a practical and useful alternative to DXA measurements. In children, the tibia (mid-shaft) and radius (distal third) are the skeletal sites usually measured using a multisite QUS device (by using different probes). It has been shown that the precision of radial, phalan-geal, and tibial SOS is in the similar high range, which suggests an adequate precision for clinical application [14]. Furthermore, both Levine et al. [28] and Hartman et al. [29] found a signif-icant correlation between tibial and radial SOS by using the ultrasound system. Additionally, the anatomical structures of the forearm needed for marking the examination point are well defined and visible, which enhances the precision of the mea-surements. The fast and easy accessibility to the forearm and the comfortable sitting posture during the measurement of the distal third of the radius support a good compliance even in difficult situations.
The vast majority of the participating children reported additional physical activity besides the school sport lessons (3 h per week), but only few children declared very high levels of additional physical activity. This may explain the lack of correlation between the reported level of activity and SOS measurements in our population. Similarly, the estimated cal-cium intake was comparable in most children with surprising-ly little variability. There was onsurprising-ly one child reporting no intake of calcium-rich foods or drinks.
Limitations
The present study is limited by its cross-sectional design. Prospective studies with repeated assessments over years on the same study subjects diminish interindividual differences and changes in intrinsic and extrinsic influences across ages. However, during childhood and adolescence, fat mass
increases more than lean body mass creating an inhomoge-neous distribution of soft tissues. In longitudinal studies, where the same region of interest is studied more than once, body composition will differ between measurements [1]. Thus, even though a cross-sectional design shows greater interindividual differences and can be taken as the starting point for a prospective study, it reduces the inhomogeneity in measurements typically found in prospective studies and is, therefore, a valid study design to be used in QUS measure-ments. The evaluation of Tanner stages in the study subjects in addition to the gathered anthropometric data in this study would have brought more precise information about the pu-bertal status of the children and adolescents and possibly provided an explanation for the gender differences. However, the precise assessment of Tanner status was not feasible in this specific school setting, where whole classes were investigated, as it was not possible to provide sufficient privacy. Pubertal status was evaluated using self-report instru-ments with drawings in other studies [23], but this method may have some risk of imprecise reporting.
Conclusions
We created gender-specific reference equations for radial SOS values in a healthy Central European pediatric population according to the main anthropometric findings of age and height. The results of the present study can be used as refer-ence equations for radial SOS values in children and adoles-cents in Central Europe. The distal third of the radius as the region of interest provides several advantages in clinical prac-tice, especially as a fast and easily accessible site.
Acknowledgments We would like to thank the children and adoles-cents who participated in the study as well as their parents.
Conflicts of interest None.
References
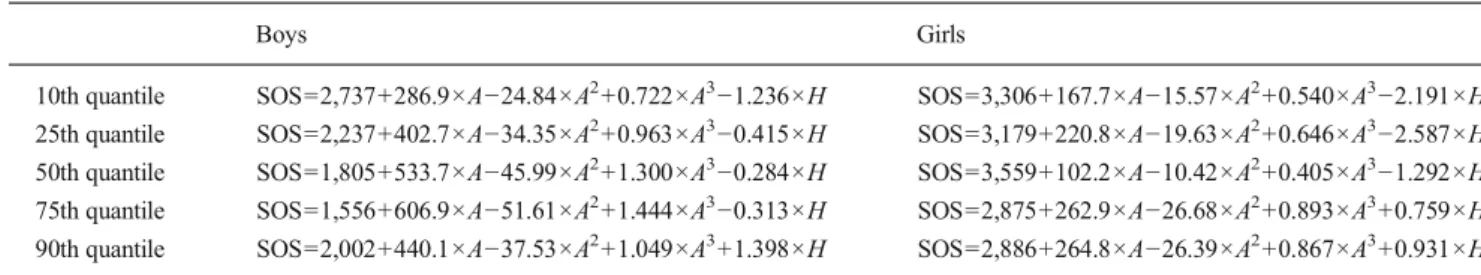
1. Henry Y, Fatayerji D, Eastell R (2004) Attainment of peak bone mass at the lumbar spine, femoral neck and radius in men and women: Table 2 SOS reference equations for 6–16-year-old boys and girls as a function of age (A, in years) and height (H, in centimeters), determined by the SAS QUANTREG procedure
Boys Girls
10th quantile SOS=2,737+286.9×A−24.84×A2+0.722×A3−1.236×H SOS=3,306+167.7×A−15.57×A2+0.540×A3−2.191×H 25th quantile SOS=2,237+402.7×A−34.35×A2+0.963×A3−0.415×H SOS=3,179+220.8×A−19.63×A2+0.646×A3−2.587×H 50th quantile SOS=1,805+533.7×A−45.99×A2+1.300×A3−0.284×H SOS=3,559+102.2×A−10.42×A2+0.405×A3−1.292×H 75th quantile SOS=1,556+606.9×A−51.61×A2+1.444×A3−0.313×H SOS=2,875+262.9×A−26.68×A2+0.893×A3+0.759×H 90th quantile SOS=2,002+440.1×A−37.53×A2+1.049×A3+1.398×H SOS=2,886+264.8×A−26.39×A2+0.867×A3+0.931×H
relative contributions of bone size and volumetric bone mineral density. Osteoporos Int 15:263–273
2. Pérez-López F, Chedraui P, Cuadros-López J (2010) Bone mass gain during puberty and adolescence: deconstructing gender characteris-tics. Curr Med Chem 17:453–466
3. Pitukcheewanont P, Punyasavatsut N, Feuille M (2010) Physical activity and bone health in children and adolescents. Pediatr Endocrinol Rev 7:275–282
4. Prais D, Diamond G, Kattan A, Salzberg J, Inbar D (2008) The effect of calcium intake and physical activity on bone quantitative ultra-sound measurements in children: a pilot study. J Bone Miner Metab 26:248–253
5. Bonjour J (2005) Dietary protein: an essential nutrient for bone health. J Am Coll Nutr 24:526S–536S
6. Weldon D (2009) The effects of corticosteroids on bone growth and bone density. Ann Allergy Asthma Immunol 103:3–11, quiz 11–13, 50 7. Bonjour J, Chevalley T, Rizzoli R, Ferrari S (2007) Gene-environment interactions in the skeletal response to nutrition and exercise during growth. Med Sport Sci 51:64–80
8. Davies J, Evans B, Gregory J (2005) Bone mass acquisition in healthy children. Arch Dis Child 90:373–378
9. Cvijetic S, Colic Baric I, Satalic Z (2010) Influence of heredity and environment on peak bone density: a parent-offspring study. J Clin Densitom 13:301–306
10. Cashman K, Hill T, Cotter A, Boreham C, Dubitzky W, Murray L, Strain J, Flynn A, Robson P, Wallace J, Kiely M (2008) Low vitamin D status adversely affects bone health parameters in adolescents. Am J Clin Nutr 87:1039–1044
11. Baroncelli G, Saggese G (2005) Effect of GH treatment on bone mass in children with GH deficiency. J Endocrinol Invest 28:23–27 12. Reix P, Bellon G, Braillon P (2010) Bone mineral and body
compo-sition alterations in paediatric cystic fibrosis patients. Pediatr Radiol 40:301–308
13. Blazina S, Bratanič N, Campa A, Blagus R, Orel R (2010) Bone mineral density and importance of strict gluten-free diet in children and adolescents with celiac disease. Bone 47:598–603
14. Baroncelli G (2008) Quantitative ultrasound methods to assess bone mineral status in children: technical characteristics, performance, and clinical application. Pediatr Res 63:220–228
15. van den Bergh J, Noordam C, Ozyilmaz A, Hermus A, Smals A, Otten B (2000) Calcaneal ultrasound imaging in healthy children and adolescents: relation of the ultrasound parameters BUA and SOS to age, body weight, height, foot dimensions and pubertal stage. Osteoporos Int 11:967–976
16. Sawyer A, Moore S, Fielding K, Nix D, Kiratli J, Bachrach L (2001) Calcaneus ultrasound measurements in a convenience sample of healthy youth. J Clin Densitom 4:111–120
17. Mughal M, Ward K, Qayyum N, Langton C (1997) Assessment of bone status using the contact ultrasound bone analyser. Arch Dis Child 76:535–536
18. Wünsche K, Wünsche B, Fähnrich H, Mentzel H, Vogt S, Abendroth K, Kaiser W (2000) Ultrasound bone densitometry of the os calcis in children and adolescents. Calcif Tissue Int 67: 349–355
19. Zhu Z, Liu W, Xu C, Han S, Zu S, Zhu G (2007) Ultrasound bone densitometry of the calcaneus in healthy Chinese children and ado-lescents. Osteoporos Int 18:533–541
20. Barkmann R, Rohrschneider W, Vierling M, Tröger J, de Terlizzi F, Cadossi R, Heller M, Glüer C (2002) German pediatric reference data for quantitative transverse transmission ultrasound of finger phalan-ges. Osteoporos Int 13:55–61
21. Baroncelli G, Federico G, Vignolo M, Valerio G, del Puente A, Maghnie M, Baserga M, Farello G, Saggese G, Group PQU (2006) Cross-sectional reference data for phalangeal quantitative ultrasound from early childhood to young-adulthood according to gender, age, skeletal growth, and pubertal development. Bone 39:159–173 22. Halaba Z, Pluskiewicz W (2004) Quantitative ultrasound in the
assessment of skeletal status in children and adolescents. Ultrasound Med Biol 30:239–243
23. Zadik Z, Price D, Diamond G (2003) Pediatric reference curves for multi-site quantitative ultrasound and its modulators. Osteoporos Int 14:857–862
24. Lequin M, van Rijn R, Robben S, Hop W, van Kuijk C (2000) Normal values for tibial quantitative ultrasonometry in Caucasian children and adolescents (aged 6 to 19 years). Calcif Tissue Int 67: 101–105
25. Christoforidis A, Papadopoulou E, Dimitriadou M, Stilpnopoulou D, Gkogka C, Katzos G, Athanassiou-Metaxa M (2009) Reference values for quantitative ultrasonography (QUS) of radius and tibia in healthy Greek pediatric population: clinical correlations. J Clin Densitom 12:360–368
26. (1995) Physical status: the use and interpretation of anthropometry. Report of a WHO Expert Committee. World Health Organ Tech Rep Ser 854:1–452
27. Trimpou P, Bosaeus I, Bengtsson B, Landin-Wilhelmsen K (2010) High correlation between quantitative ultrasound and DXA during 7 years of follow-up. Eur J Radiol 73:360–364
28. Levine A, Mishna L, Ballin A, Givoni S, Dinari G, Hartman C, Shamir R (2002) Use of quantitative ultrasound to assess osteopenia in children with Crohn disease. J Pediatr Gastroenterol Nutr 35:169–172 29. Hartman C, Brik R, Tamir A, Merrick J, Shamir R (2004) Bone
quantitative ultrasound and nutritional status in severely handicapped institutionalized children and adolescents. Clin Nutr 23:89–98