Université de Montréal
Development of Auditory Repetition Effects with Age: Evidence from EEG
Time-Frequency Analysis
Par
Audrey-Rose Charlebois-Poirier
Département de psychologie Faculté des arts et des sciences
Mémoire présenté en vue de l’obtention du grade de Maîtrise ès sciences (M. Sc.) en psychologie
Résumé
La présentation répétée d’un son inconnu conduit à des effets de répétition comprenant la suppression (‘repetition suppression’ ou RS) ou l’augmentation (‘repetition enhancement’ ou RE) de l’activité neuronale. Ces phénomènes reflètent des mécanismes cérébraux impliquant un apprentissage perceptuel. L’objectif de ce mémoire de maitrise était d’apporter une perspective développementale de l’activité cérébrale sous-tendant l’apprentissage perceptuel auditif. L’EEG a été enregistré chez 101 participants sains âgés de 3 à 40 ans pendant un paradigme auditif passif durant lequel 30 pseudo-mots étaient répétés 6 fois chacun. Des analyses en temps-fréquence ont été calculées pour chaque répétition. La puissance spectrale enregistrées en EEG entre chaque répétition a été comparée au moyen de modèles linéaires mixtes. Les résultats montrent qu’un effet de répétition survient au cours du développement mais varie en fonction de l’âge et des bandes de fréquences. Du RS et RE ont été observés à tous les âges dans le thêta bas et le gamma respectivement. Un effet développemental a été trouvé de façon plus précoce pour le RS dans le thêta haut et de façon tardive pour le RE dans le thêta bas. Ces résultats montrent que les processus impliquant un apprentissage perceptif auditif, tel que le RS et le RE, suivent une trajectoire développementale spécifique en fonction des rythmes cérébraux. Les effets de répétition reflèteraient différents niveaux de traitement des stimuli qui se développeraient de manière indépendante. Des recherches supplémentaires seront nécessaires pour préciser le rôle fonctionnel des effets de répétitions sur le développement cognitif.
Abstract
The repeated presentation of unfamiliar sounds leads to repetition effects comprising repetition suppression (RS) and enhancement (RE) of neural activity. These phenomena reflect mechanisms involved in perceptual learning and are associated with a decrease or increase in EEG spectral powers. The objective of this Master’s thesis is to provide a developmental perspective of the cortical activity underlying auditory perceptual learning. EEG was recorded in 101 healthy participants ranging from 3 to 40 years during an auditory paradigm comprising 30 pseudowords repeated six times each. EEG time-frequency spectral power was calculated for each presentation and was compared to quantify repetition effects. Linear mixed model analysis revealed that some repetition effects occurred across ages and others varied with age in specific frequency bands. More precisely, RS and RE were found across ages in lower theta and gamma frequency bands respectively between the first and all subsequent pseudoword presentations. Developmental effects were seen in the RS observed in the higher theta/low alpha band and in the later occurring RE in the lower theta band. These results show that processes involved in auditory perceptual learning, such as RS and RE, are modulated by maturation. Further, repetition effects reflect different levels of stimulus processing and these levels seem to develop independently. More research is required to identify the exact functional roles of auditory repetitions effects on cognitive development.
Keywords : repetition suppression, repetition enhancement, EEG spectral power, brain development, time-frequency analysis.
Table of Content
RÉSUMÉ ... I ABSTRACT ... II TABLE OF CONTENT ... III LIST OF TABLES ... VI LIST OF FIGURES ... VII LIST OF ABBREVIATIONS ... VIII ACKNOWLEDGEMENTS ... X GENERAL INTRODUCTION ... 1 Brain development ... 1 Auditory cortex ... 2 Prefrontal cortex ... 4 Learning ... 4 Repetition effects ... 5 Repetition effect models ... 6 Development of auditory repetition effects ... 8 Auditory event related potentials ... 8 Time-frequency analysis ... 10 SCIENTIFIC ARTICLE ... 13Abstract ... 15 Keywords: ... 15 1. Introduction ... 16 2. Materials and Methods ... 19 2.1 Participants ... 19 2.2 Apparatus, stimuli and procedure ... 20 2.3 EEG recordings ans analysis ... 21 2.4 Statistical analysis ... 23 3. Results ... 24 3.1 Linear mixed models ... 24 3.2 Models divided by TFW ... 25 3.3 Age interaction ... 31 4. Discussion ... 35 4.1 Time-frequency without age effects ... 36 4.2 Time-frequency windows with age effects ... 37 4.3 Neuronal mechanisms underlying age related changes in repetition effects ... 39 4.4 Conclusion ... 40 Competing interests ... 40 Funding Source ... 41 Acknowledgements ... 41 References ... 42 GENERAL DISCUSSION ... 46
Objectives, Results and Scientific Contributions ... 46 Pseudowords, language acquisition and predictive coding ... 48 Lack of Regions of Interest Effect ... 49 Auditory Pseudoword Paradigm ... 50 PERSPECTIVES ... 53 Methodological and Data Analysis Perspectives. ... 53 Developmental and Clinical Perspectives. ... 55 CONCLUSION ... 57 REFERENCES ... 58
List of tables
Scientific Article
Table 1 Mean sum of power (±SD) for each repetition and age group and t statistics for significant power differences between repetitions at Cz and for TFW2 (Bonferroni corrected p-values). ... 28
Table 2 Mean sum of power (±SD) for each repetition and age group and t statistics for significant power differences between repetitions at F3g and for TFW3 (Bonferroni corrected p-values). ... 30
Table 3 Mean sum of power (±SD) for each repetition and age group and t statistics for significant power differences between repetitions at Cz and for TFW1 (Bonferroni corrected p-values). ... 34
Table 4 Mean sum of power (±SD) for each repetition and age group and t statistics for significant power differences between repetitions at Cz and for TFW4 (Bonferroni corrected p-values). ... 34
List of Figures
Scientific Article
Fig. 1 EEG sum of powers for TFW1 across presentations one through six (Rep1-Rep6) over ROI Cz averaged for each age group. Error bars are showing standard deviations. ***p<0.001 ... 26
Fig. 2 EEG sum of powers for TFW2 across presentations one through six (Rep1-Rep6) over ROI Cz averaged for each age group. Error bars are showing standard deviations. ***p< 0.001, **p<0.01 ... 27
Fig. 3 ERSP plots of repetitions one through six for participants with ages 3 to 6 at Cz.31
Fig. 4 ERSP plots of repetitions one through six for participants with ages 7 to 11 at Cz. ... 32
Fig. 5 ERSP plots of repetitions one through six for participants with ages 12 to 17 at Cz. ... 33
Fig. 6 ERSP plots of repetitions one through six for participants with ages 18 and over at Cz. ... 35
List of abbreviations
ASD Autism Spectrum Disorder
CAEP Cortical Auditory Evoked Potentials EEG Electroencephalography
ERD Event-Related Desynchronization ERP Event-Related Potentials
ERS Event-Related Synchronization ERSP Event-Related Spectral Perturbation fMRI Functional Magetic Resonance ICA Independent Component Analysis IQ Intellectual Quotient
ISI Inter-stimulus Interval LMM Linear Mixed Model
PIQ Performance Intellectual Quotient PFC Prefrontal Cortex
RE Repetition Enhancement ROI Region of Interest RS Repetition Suppression SGT Superior Temporal Gyrus SVD Singular Value Decomposition TFW Time-Frequency Window
« Notre confiance n’a pour limite, que l’honnêteté des autres. » - Alex
Acknowledgements
It’s 3am, I am tired of writing, and all I can think about is how grateful I am to be surrounded by amazing people that help me grow in so many ways. I am one who believes that what defines and shapes us is the people that we let into our lives. Heureusement, la vie a mis sur mon chemin des personnes exceptionnelles qui m’apportent toutes quelque chose d’unique.
Tout d’abord, merci à ma directrice, Sarah Lippé. Merci de m’avoir permis de réaliser ce projet, de continuellement croire en mes capacités scientifiques et de me pousser à m’améliorer.
Merci à ma famille, qui est à la base de toutes mes réussites. Merci à la plus importante, ma maman, ma source de réconfort, sans qui je n’aurais jamais pu me rendre où je suis maintenant. Ta force et ta persévérance me pousse à m’améliorer à tous les jours! Merci à mon papa, qui même lorsque je ne vois plus le sommet de la montagne, m’accompagne dans la réalisaition de mes objectifs. Ta « drive » et ta ténacité me motivent à toujours faire l’extra que les autres ne font pas. Merci à ma grand-maman. Sans toi, rien de tout cela ne serait possible. Thank you for always supporting and understanding me. Merci à mon grand frère Jeff, qui est fort probablement mon plus grand fan. Tes encouragements et ton enthousiasme envers mes accomplissements me touchent énormément! Merci à Alex, mon inspiration, ma preuve que rien n’est impossible. Si je réussie à réaliser le dixième des choses que tu as accomplies, je serai extrêmement comblée. Merci à ma petite sœur, Cassy, qui m’est si importante. I am so proud of the woman you are, thank you for inspiring me in so many more ways than words can express. Finally, thank you Georgie boy! I know you would’ve be so proud of me, and I wish I could’ve shared this experience with you. Thank you for having shaped the person I am today.
Thank you to my non-scientific/school related friends! I don’t know if any of you will read this, but you are all so passionate about my academic journey that I can’t, not mention you guys. Thank you for allowing me to be a well-rounded person by letting me explore other aspects of life. Honorable mention to my bestie Valerie! Thank you for proof-reading this, but mostly for being such an amazing friend. Thank you for being by my side every step of the way.
Merci à ma deuxième famille au labo NED. Vous avez joué un rôle important dans mes accomplissements, tant professionnels que personnels. Vous avez tous des qualités qui m’inspirent à devenir une meilleure personne et je me sens choyée de pouvoir vous côtoyer à tous les jours. Merci pour les mots d’encouragements, merci pour vos conseils, merci pour les lunchs, merci de rire avec moi, merci de pleurer avec moi, merci d’embarquer dans mes folleries, bref merci de faire partie de ma vie! Vous êtes tous et toutes très important.e.s pour moi!
Special thanks to my dearest Inga. Our friendship is one of the greatest gifts this lab could’ve given me. Thank you for staying late nights at the lab with me, thank you for checking up on me, thank you for believing in me, for the numerous pep talks, for always, always, always being so supportive and leading me in the right direction by providing me with the most honest advice. This adventure wouldn’t have been the same without you!
Merci à ma choupine, Fanny, la grande soeur que je n’ai jamais eue. Notre amitié est ma plus belle découverte de 2017/2018. Merci de m’avoir relu des centaines de fois, merci de m’écouter, merci de me guider, merci d’être là pour moi dans mes moments heureux comme dans les plus sombres, merci de m’avoir épaulée durant toutes les étapes de cet accomplissement. J’ai hâte de voir ce que le future nous réserve, où que nous soyons!
General Introduction
Brain development is a process that encompasses a plethora of changes in terms of its structural and functional properties, that also involves many cognitive changes. Understanding how these changes influence one another is mandatory to provide a better knowledge of how the healthy brain evolves through life. More specifically, this master’s thesis focuses on the developmental course of auditory learning repetition effects. Hence, the first section of this master’s thesis will highlight the maturation of cortical regions involved in the processing of auditory stimuli. Learning and the development of its neural correlates will also be described with a specific focus on experiments in the field of electroencephalography. The second section will present a scientific manuscript investigating the developmental course of auditory repetition effects using time-frequency analysis.Finally, the third section will present a general discussion and will address prospects for future research.
Brain development
Human brain development is a complex, long-lasting process that begins in the early embryonic stage and continues well into adolescence, as well as throughout adulthood (Stiles & Jernigan, 2010). Research in neuroscience suggests that the biology of the brain is the foundation for behavior and the development of abilities (Anderson, 2016; Barrett & Satpute, 2013). Of particular interest for this Master’s thesis is the development of cortical regions involved in auditory processing and their relation to learning. Many studies have shown that the processing of repeated auditory stimuli involves not only the auditory cortex but also non-auditory higher order areas including the frontal cortex (McDonald et al., 2010; Orekhova et al., 2013; Sussman,
Steinschneider, Gumenyuk, Grushko, & Lawson, 2008). Understanding the development of these cortical areas is important to get a better idea of how they are involved in learning.
Electroencephalography (EEG) is a neuroimaging technique that has been widely used to study the functional activity of the brain by looking at the neuronal activity associated to specific sensory, motor and cognitive events (Luck, 2014; Pietto, Gatti, Raimondo, Lipina, & Kamienkowski, 2018). In order to give rise to these activities, averaging techniques of the EEG signal need to be performed to extract these responses from the different sources of neural activity comprised in the signal (Luck, 2014). The resulting averaged waveforms consist of a sequence of positive and negative voltage deflections, which are called event-related potentials (ERP) components (Luck, 2014). ERP techniques have been used in many studies to demonstrate the development of auditory processing. For example, cortical auditory evoked potentials (CAEPs) have been shown to provide an important index of auditory system function and plasticity (Sussman et al., 2008).
Auditory cortex
The auditory cortex demonstrates a prolonged maturational time course compared to other sensory regions of the brain, which reflects both its anatomical complexity and its implication in lengthy processes such as language acquisition (Moore & Linthicum, 2007). Maturation in the auditory cortex is believed to take place on a cortical layer-by-layer basis (Moore & Linthicum, 2007) in which lower layers of the auditory cortex are thought to mature faster than the upper layers (Orekhova et al., 2013). In early childhood, from ages two to five, the major developmental change is continued axonal maturation in the deep layers of the auditory cortex. Axons grow, slowly and steadily, until adult density is reached by five years of age (Moore &
from six to twelve years of age. At this period in the developmental course, the superficial cortical layers and their intra-cortical connections with the other layers and between hemispheres mature (Moore and Linthicum (2007).
Changes in the morphology of auditory ERPs with age have been shown to reflect the maturation of the auditory cortex (Orekhova et al., 2013). Lippe, Martinez-Montes, Arcand, and Lassonde (2009) studied the development of CAEPs in a cohort of infants and children aged from 1 month to 5 years of age in comparison to adults. In a paradigm using broadband noises, they confirmed the presence of maturational changes in CAEPs throughout infancy, with ERPs not reaching the adult pattern at 5 years of age. Furthermore, other studies using ERPs indicate significant differences between adolescents and adults in terms of the amplitude and latency of certain components involved in basic auditory processing (Sussman et al., 2008), thus indicating that adult morphology of cortical auditory response is not reached until late adolescence
(Orekhova et al., 2013; Strauss, Kotz, Scharinger, & Obleser, 2014). Behaviorally, auditory cortex maturation can be approached by observing the development of sound and speech discrimination (Moore & Linthicum, 2007). For example, gains in the ability to discriminate speech under difficult conditions are observed during late childhood (Orekhova et al., 2013). Therefore, enhanced language acquisition and detection skills may reflect a capacity for complex auditory processing (Orekhova et al., 2013).
Primary and secondary auditory areas are mainly in charge of basic processing of auditory stimuli. This being said, other cortical areas in charge of cognitive processes have been shown to play an integral role in these processes (Machado, Teixeira, & da Costa, 2018).
Prefrontal cortex
The prefrontal cortex (PFC), the association cortex of the frontal lobe, is involved in many cognitive abilities and plays a crucial role in executive functioning in humans (Teffer & Semendeferi, 2012). It matures later in development and exhibits more complex dendritic arborizations than posterior regions (Fuster, 2002; Teffer & Semendeferi, 2012). Indeed, a proliferation of synapses in the frontal cortex can be observed from childhood to puberty, followed by a plateau phase. By the end of adolescence, an elimination and reorganization of synaptic connections takes place (Blakemore & Choudhury, 2006). Accordingly, the development of the PFC is assumed to follow an inverted U-shape peaking around age six (Shaw et al., 2008), characterized by synaptogenesis in early childhood, increased synaptic pruning in adolescence followed by a slight increase in synaptogenesis and stabilization in adulthood (Teffer & Semendeferi, 2012). This developmental trajectory is thought to be linked to the maturation of frontal lobe cortical networks involved in many higher order processes such as language, decision-making, attention control and working memory (Casey, Galvan, & Hare, 2005). Interestingly, Diamond, Prevor, Callender, and Druin (1997) have found that a gradual improvement in performance on tests measuring executive functions are closely related to this slow PFC development (Diamond et al., 1997). Furthermore, modulation of prefrontal cortical activity using transcranial direct current stimulation has confirmed its role in basic learning mechanisms of sensory perception. Thus, the PFC is involved in early sensory encoding through top-down processing (Lafontaine, Theoret, Gosselin, & Lippe, 2013).
Learning
Developing and maintaining a good learning ability is essential to cope with a changing environment at every stage of life. Learning mechanisms and their underlying cerebral correlates are therefore a major field of interest for research in cognitive neuroscience. Habituation, a process that occurs as early as the fetal stage, is one of the most primitive forms of perceptual learning (Leader, Baillie, Martin, & Vermeulen, 1982). The main method to study the neurological correlates of habituation is to observe brain activity linked with the repeated presentation of a stimulus, namely, repetition effects (Grill-Spector, Henson, & Martin, 2006). Repetition effects, as observed by neuroimaging techniques, are thought to be the most primitive and fundamental neurophysiological correlate of learning as demonstrated by studies in animals, infants and fetuses (Morokuma et al., 2004; Snyder & Keil, 2008).
Repetition effects
Repetition effects comprise both repetition suppression (RS) and repetition enhancement (RE) which are cortical responses to repeated stimuli. RS has been related to the recognition of a familiar stimulus whereas RE has been linked to the repetition of an unfamiliar one (R. N. Henson, 2015). More specifically, RS is a robust cortical process defined as the reduction in neuronal activity following the presentation of a repeated stimulus (Grill-Spector et al., 2006). On the other hand, RE is described as an increase in the neural response associated with recognition, learning and prediction of repeated stimuli (Recasens, Leung, Grimm, Nowak, & Escera, 2015). RS and RE are therefore thought to be complementary mechanisms of regularity encoding that occur at different time scales and cortical regions (Recasens et al., 2015). Studies have shown that behavioral performance, such as response accuracy and reaction time, reflect learning and are positively correlated with measures of RS in response to repeated stimuli, where a good behavioral performance showed greater RS than a bad one (Henson, 2003). These phenomena
have been studied using multiple neuroimaging techniques, which have confirmed that repetition effects are present not only in cortical areas responsible for stimulus processing (R. Henson, 2003), but also at different cortical levels involved in higher level stimulus processing (Grill-Spector et al., 2006). Using magnetoencephalography source analysis, Recasens et al. (2015) demonstrated that auditory RS and RE are complementary mechanisms of regularity encoding. More precisely, they found that RS in early auditory components involved regions of the auditory cortex located in the temporal and parietal brain regions. They also found a late RE effect in the frontal regions. Thus, they demonstrated that the neuronal generators in charge of RS and RE reflects functionally separated mechanisms implicated in different stages of auditory processing of the human brain (Recasens et al., 2015). Studies have shown that the repeated presentation of sounds (speech and non-speech) led to a reduction in bilateral neural activity of the temporal cortex but also that of additional regions surrounding it (Emberson, Cannon, Palmeri, Richards, & Aslin, 2017). This reduction in activity is thought to be linked to the presence of inhibitory interneurons in the upper layers of the auditory cortex (Kudela, Boatman-Reich, Beeman, & Anderson, 2018), layers which have been shown to develop later in life (Orekhova et al., 2013). These latter results suggest that maturational changes in the anatomy of the brain may lead to developmental changes in patterns of cortical activity.
Repetition effect models
Several studies have tackled the complex task of modeling repetition effects at the neuronal level. Although competing repetition effects models exist, the ones within the theoretical framework of predictive coding, including the sharpening model and sensory gating, provide the best explanation for the neural correlates of learning.
Sharpening model. The sharpening model postulates that the presentation of repeated information leads to a fine-tuned cortical representation of sensory information (Alink, Abdulrahman, & Henson, 2018; Desimone, 1996; Grill-Spector et al., 2006). While novel stimuli activate large populations of non-specific neurons, repeated stimulus exposure results in fewer firing neurons. Neurons that keep firing carry critical information needed to identify the stimulus whereas neurons that stop firing are not, thus creating a more specific or sharper representation (Wiggs & Martin, 1998).
Sensory Gating. Similarly, sensory gating is described as the early processing step of filtering redundant sensory information related to stimulus processing during its repeated presentation (Campbell, Bean, & LaBrec, 2018; Marshall, Bar-Haim, & Fox, 2004). This model describes the ability of the central nervous system to prevent sensory cortical areas from being flooded with irrelevant information by filtering incoming stimuli (Brinkman & Stauder, 2007). Marshall et al. (2004) have found that gating of irrelevant or repetitive stimulus information is present in different age groups. This ability is thought to involve many cortical areas such as the temporo-frontal, hippocampal and frontal cortical networks (Campbell et al., 2018).
Predictive coding. Predictive coding is a neurobiological framework that explains how biological systems infer and learn from perceptual inputs. An implicit process creates an internal model of sensory input with the goal of minimizing surprise, also called prediction error (Auksztulewicz & Friston, 2016). The model is based on the bidirectional flow of information in a hierarchical neural network where the incoming sensory inputs are encoded by representational units located at the higher levels of the network (Friston, 2005). These higher levels then send predictions to prediction error units located in the lower level, where the new sensory input is compared with the prediction (Ylinen, Bosseler, Junttila, & Huotilainen, 2017). Matching
between input and prediction results in a suppressed neural response, whereas a mismatch elicits a prediction error response, which is projected back to the higher level to adjust the internal model. For repetition effects, predictive coding explains RS in early sensory processing areas as a consequence of the progressive reduction in prediction error from higher-order, associative areas of the cortex such as the frontal cortex (Friston, 2005; R. Henson, 2003). Consequently, RS is considered the physiological correlate of a reduction in prediction error in response to a repeatedly presented stimulus achieved through the modification of existing connections between hierarchical levels (Baldeweg, 2006). In other words, as the difference between bottom-up sensory input and top-down experience-dependent prediction is lessened for each repetition, stimulus processing becomes more efficient and leads to the reduction of neurons needed to represent the stimulus as well as an enhanced ability to recognize and retrieve items from memory (Auksztulewicz & Friston, 2016).
Given the complexity of the cortical processes underlying RS and learning, it is believed that the combination of the different models provides the best explanation for the underlying neuronal correlates of repetition effects ( Grill-Spector et al., 2006).
Development of auditory repetition effects
Auditory event related potentials
Emberson et al. (2017) brought forth that the developing brain does not respond to repetition in the same way that the mature brain does and provided robust evidence that auditory RS in the auditory cortices and frontal lobe is already observed in infants. Many developmental studies focused on sensory gating using the reduction in amplitude in auditory ERP between repetitions of clicks as a measure of RS. In a sample ranging from 7 to 13 years of age, Marshall
et al. (2004) found a positive correlation between RS and age, showing stronger RS in older subjects. These results were replicated in a sample with a larger age span, from 5 to 29 years of age (Brinkman & Stauder, 2007). Thus, younger age groups (ages 5 to 12) are believed to show less sensory gating when compared to older children and adults while also showing more within group variance (Davies, Chang, & Gavin, 2009). Further, adult patterns of sensory gating are thought to appear only around early adolescence (Marshall et al., 2004)
Research on language and word learning related RS seems to focus on infants and shows RS in response to simple stimuli and RE when more complex ones are used (Dehaene-Lambertz, Dehaene, et al., 2006). Furthermore, development in older children has mostly been investigated in the framework of sensory gating as described earlier. Consequently, there is a lack of knowledge regarding the development of repetition effects across all age groups especially when using more complex language-related stimuli. Additionally, sensory gating focuses on early, perceptual components and does not allow insight into later, more cognitive and memory-related neural correlates of learning. Using a more complex type of language-related stimulus would potentially better reflect repetition effects as well as their development.
Although ERPs allow a precise temporal resolution of cortical activity, this technique paints a pretty restrictive portrait of brain activity as they cause a loss of information that might be crucial to the understanding of certain cortical processes The EEG averaging technique used to generate ERPs can cause the loss of event-related changes in the magnitude and phase of EEG oscillations at specific frequencies (Luck, 2014). These neural oscillations are involved in the routing of information within and across brain regions but also in the control of information gating and maintaining sensory representations (Recasens, Gross, & Uhlhaas, 2018; Roach & Mathalon, 2008). Since less attention has been paid to the contribution of rhythmic activity
towards auditory perceptual learning, methods of EEG analysis emphasizing this type of activity should be adopted to clarify the functional correlates of auditory learning in the developing brain.
Time-frequency analysis
Time-frequency analysis is an EEG analysis technique that focuses on the spectral variations of the EEG signal through time (Luck, 2014). This method allows us to view the brain’s parallel processing of information, with oscillations at various frequencies reflecting multiple neural processes co-occurring and interacting which contribute to the integrative and dynamically adaptive processing of information (Roach & Mathalon, 2008). To quantify the changes in oscillatory activity in the time-frequency domains, methods focus on the quantification of the neuronal event-related synchronization (ERS) and event-related desynchronization (ERD) (Pfurtscheller & Aranibar, 1977). ERS and ERD result in increases and decreases in EEG power, respectively (Pfurtscheller, 1977). As such, changes in power are considered changes in neuronal synchrony. Thus, time-frequency analysis informs on which frequencies have the most power at specific points in time and space.
The brain’s oscillatory activity spans a large range of frequencies commonly divided into five frequency bands, namely delta, theta, alpha, beta and gamma. These frequency bands are thought to develop at different rates and reflect different cognitive processes (Jeannerod, 1997). Maturational studies of EEG oscillations report that lower frequencies decrease and higher frequencies increase with age (Clarke, Barry, McCarthy, & Selikowitz, 2001).
Of interest, the theta and gamma bands are thought to reflect most cognitive processes important in auditory learning (Crivelli-Decker, Hsieh, Clarke, & Ranganath, 2018; Musacchia et al., 2017).
Theta. Although literature is conflicted regarding the accepted frequency range for theta band oscillations (Kropotov, 2010), the most commonly accepted range is 4 to 7Hz varying in amplitude and morphology (Jeannerod, 1997). The development of theta rhythms over frontal areas is thought to facilitate sustained emotional states and its presence over central areas reflects periods of focalized attention as well as realization of mental tasks implicating mnemonic processes (Muller & Jacobs, 2009). In a series of experiments, Klimesch was able to demonstrate that in human scalp EEG, the theta band synchronization responded selectively to the encoding of new information into episodic memory (Klimesch, 1999). In RS, Rigoulot et al. (2017) recently found in a sample with an age range of 9 to 32 years, that theta band power diminished after the second presentation of a visual stimulus over frontal electrodes proving the involvement of the theta band in repetition effects. Together, these results show that theta oscillations are involved in repetition effects underlying learning by encoding stimulus properties into episodic memory.
Gamma. Gamma waves encompass frequencies ranging from 30 to 250Hz (Tallon-Baudry & Bertrand, 1999) which can further be divided into 2 bands called low (from 30 to 60Hz) and high (from 60 to 250Hz) gamma (Ainsworth et al., 2011; Edwards, Soltani, Deouell, Berger, & Knight, 2005). Auditory gamma oscillations are thought to reflect memory processes involved in learning (Frund, Busch, Korner, Schadow, & Herrmann, 2007). During speech discrimination tasks, high gamma frequencies are found in the posterior superior temporal gyrus, part of the auditory cortex demonstrating its implication in the processing of more complex stimuli (Crone, Korzeniewska, & Franaszczuk, 2011). These results indicate that gamma band synchronization is not a purely sensory driven phenomenon, but reflects general aspects of cortical functions (Fries, 2009) involved in the perceptual binding between stimulus features (Scheeringa & Fries, 2017). Very sparse information exists on the developmental course of gamma waves especially in the
context of auditory learning. Although gamma rhythms can probably occur across the entire cortex, gamma band synchrony exhibits great spatial specificity (Scheeringa & Fries, 2017). For example, it was found that increased gamma-band suppression in the prefrontal region in adults was positively correlated with faster reaction times in a visual encoding task (Ossandon et al., 2011). Further, gamma frequencies in the auditory cortex are mainly associated with the encoding of rapid feature analysis, temporal binding of stimulus events and attention control (Musacchia et al., 2017).
Together, theta and gamma oscillations reflect important neuronal activity that might underlie cognitive processes involved in habituation and learning. This being said, we do not know their precise roles, how these frequency bands influence each other or if other frequency bands might come into play when learning processes are triggered by repetition paradigms. Moreover, the maturation of repetition effects has yet to be elucidated.
Scientific Article
Objective. The objective of the scientific article included in this Master’s thesis is to elucidate the developmental course of auditory repetition effects across frequency bands. We hypothesize that the characteristics of repetition effects change with age, based on the different structural maturation observed in the auditory and frontal cortices.
Contributions. The scientific article included in this Master’s thesis describes the research project that was conducted by Audrey-Rose Charlebois in the framework of her Master’s degree, based on an initial idea from her supervisor Sarah Lippé. This project is part of the research on brain development in healthy individuals conducted in the Neuroscience of Early Development laboratory. As the first author of the scientific article, Audrey-Rose Charlebois devised the research problem, participated in the testing of subjects, took care of EEG data pre-processing, conducted the statistical analyses and wrote the article. Inga Sophia Knoth was involved in the design of the study, helped with participant recruitment and testing as well as the development of data pre-processing pipelines and statistical analyses. Valérie Côté and Charles-Olivier Martin helped with recruitment and data acquisition of participants. Fanny Barlaam was involved in the development of data analysis techniques, in the interpretation of results and in proofreading of the article. Jean-Marc Lina, with the help of Kristian Agbogba, worked on the technical development of data analysis strategies. Sébastien Jacquemont provided additional data. Sarah Lippé guided Audrey-Rose throughout the whole process. The article is currently under final review by co-authors before submission. It is expected to be submitted to Cerebral Cortex within the next month.
Development of auditory repetition effects with age: evidence from EEG
time-frequency analysis
Audrey-Rose Charlebois-Poirier1,2,3,4, Valérie Côté1,2,3,4, Kristian Agbogba1,2,5, Charles-Olivier Martin2, Julie Tremblay2, Jean-Marc Lina5, Fanny Barlaam1,2,3, Sébastien Jacquemont2,Inga Sophia Knoth1,2
Sarah Lippé1,2,3,4
1 Neuroscience of Early Development (NED), Montreal, Quebec, Canada
2 Research Center of the CHU Sainte-Justine Mother and Child University Hospital Center,
Université de Montréal, Montreal, Quebec, Canada
3 Department of Psychology, Université de Montréal, Montreal, Canada
Abstract
Repetition effects are defined as changes in the neural response to repeatedly presented stimuli and reflect elementary forms of auditory perceptual learning. However, data is lacking on how repetition effects in response to complex verbal auditory stimuli develop with age. Moreover, less attention has been paid to the contribution of cortical oscillatory activity in the development of auditory repetition effects. In this study, EEG was recorded in 101 participants from 3 to 40 years old while 30 pseudowords were repeated 6 times each. EEG time-frequency (TF) analyses were computed for each pseudoword presentation and linear mixed models were used to reveal how age was related to auditory repetition effects. For all ages, RS occurred early after stimulus onset in the lower theta band between the first and all subsequent repetitions. Similarly, RE was observed in gamma TF power between the first and all subsequent repetitions, again across ages. Importantly, only adults showed significant RS in the early occurring low alpha band and RE in the late low theta rhythms. Our data shows that the repetition effect is a general principle of the brain. However, neural mechanisms responsible for it mature until adulthood.
Keywords:
Repetition suppression, repetition enhancement, EEG spectral power, brain development, predictive coding.
1. Introduction
Even in early stages of development, the brain exploits statistical regularities from inputs. These regularities are learned from repetition and form expectations facilitating further processes. This phenomenon has been known as repetition suppression in the brain signal (Nordt, Hoehl, & Weigelt, 2016). Several theoretical frameworks have attempted to provide an explanation for the cortical processes involved in repetition suppression (Kim, 2017). According to the sharpening model, repeated information leads to a sharpening of information representation in the cortex (Desimone, 1996; K. Grill-Spector, R. Henson, & A. Martin, 2006; Wiggs & Martin, 1998). While novel stimuli activate large populations of non-specific neurons, repeated stimulus exposure results in fewer firing neurons. These neurons carry critical information needed to identify the stimulus, thus creating a more specific or sharper representation (Wiggs & Martin, 1998). In the theoretical framework of “predictive coding’ (Friston, 2005), neuronal sharpening is thought to happen due to an interplay between bottom-up sensory input and top-down expectations in hierarchically organized sensory systems, ranging from the primary areas receiving sensory information from thalamic nerve projections to the frontal cortex generating predictive percepts (Summerfield et al., 2006). As the difference between bottom-up sensory input and top-down experience dependent prediction is reduced for each repetition, stimulus processing becomes more efficient, leading to the reduction of neurons needed to represent the stimulus as well as an enhanced ability to recognize and retrieve items from memory (Auksztulewicz & Friston, 2016). In addition to RS, repetition effects also include repetition enhancement (RE) where the repeated presentation of a stimulus leads to an increase in cortical activity (Sawamura, Orban, & Vogels, 2006). RE has received much less attention than RS but is also thought to reflect changes in information processing guided by principles of predictive
coding (Segaert, Weber, de Lange, Petersson, & Hagoort, 2013). Since attention was shown to counteract RS, RE may be the result of varying levels of attention to the stimuli (Garrido, Rowe, Halasz, & Mattingley, 2018). Combining the sharpening and predictive coding models provides a strong theoretical framework for the explanation of repetition effects. Since predictive coding is believed to underlie learning, it has specifically been used to explain language skill acquisition in infants (Saffran, Aslin, & Newport, 1996), such as word leaning and recognition (Gagnepain, Henson, & Davis, 2012).
Auditory repetition effects occur at all ages in normally developing children and have been extensively used to study language development in infants. Neonates and 3 month-olds show a decrease in EEG amplitude in response to spoken syllables, the decrease being greater for the first repetition than for following ones (Lambertz & Dehaene, 1994; Dehaene-Lambertz & Pena, 2001). In 2 month-olds a reduced BOLD response was found to repeated when compared to varied music and speech segments (Dehaene-Lambertz et al., 2010) and 9 month-olds show a decrease in BOLD response with each subsequent repetition of a word (Bortfeld, Shaw, & Depowski, 2013). However, RE has also been reported in preverbal infants. Three month olds showed increased BOLD responses to the second as compared to the first presentation of a sentence in Broca’s area (Dehaene-Lambertz, Hertz-Pannier, et al., 2006), suggesting RE in response to more complex stimuli (syllables vs. sentences). Interestingly, the same paradigm induced RS in inferior frontal and broad temporal regions in adults, suggesting that repetition effects to verbal auditory stimuli change with age (Dehaene-Lambertz, Dehaene, et al., 2006).
Regarding the development of repetition effects in children, most studies focused on the developmental trajectory of sensory gating – a specific type of RS that describes the process of
filtering redundant sensory stimuli information, often measured as a reduction in P50 amplitude in response to the second presentation of an auditory ‘click’ stimulus (Brinkman & Stauder, 2007). Sensory gating was found to be positively correlated with age, showing stronger RS in older subjects when investigated in a sample ranging from seven to 13 (Marshall et al., 2004) and five to 29 (Brinkman & Stauder, 2007) years. Adult patterns of sensory gating appeared in adolescence (Marshall et al., 2004). Younger age groups ((Brinkman & Stauder, 2007): 5-7 years,(Davies et al., 2009): 5-12 years) showed less sensory gating when compared to older children and adults while also showing more within-group variance (Davies et al., 2009).
Given these results, it appears that language and word learning related RS has been intensively studied in infants, showing RS in response to simple and RE in response to complex stimuli whereas development with age in older children has mostly been investigated in the framework of sensory gating, demonstrating mostly an increase in RS with age. Data is lacking for the development of repetition effects in young children as well as in response to more complex language-related stimuli. Additionally, sensory gating focuses on early, perceptual components whereas it does not allow insight into later, more cognitive and memory-related components of the EEG signal.
The majority of research on the development of auditory EEG repetition effects has been done using ERPs. Generally, comparing ERPs across ages is complicated due to changes in morphology, amplitudes and latencies of components occurring with maturation (Fox, Anderson, Reid, Smith, & Bishop, 2010). Less attention has been paid to the contribution of oscillatory activity in an auditory habituation setting. Cortical rhythms play an important role in routing information within and between cortical regions, as well as controlling information gating and
framework indicates that neural oscillations are fundamental for the signaling of top-down predictions and bottom up prediction-errors conveyed across hierarchical regions in distinct rhythmic brands (Recasens et al., 2018).
In this study, we aim at elucidating the developmental course of auditory repetition effects using time-frequency analysis of brain responses to repeatedly presented pseudowords. We hypothesize that characteristics of repetition effects change with age, based on the structural and functional maturation of brain regions involved in auditory learning. More precisely, we predict that specific frequency bands involved in cortical processes will exhibit different patterns of repetition across ages.
2. Materials and Methods
2.1 Participants
A total of 112 healthy subjects took part in an auditory electroencephalography (EEG) experiment. Eleven participants had to be excluded from the EEG analyses due to difficulties in testing, movement artifacts and incomplete neuropsychological results. The 101 remaining participants (35 females) ranged in age between three and forty years (X=19.5 years, SD= 11 years). As intellectual quotient (IQ) can affect the repetition effects (Knoth et al., 2018), scores for Performance IQ (PIQ) were obtained using the Leiter R, the WPPSI-IV, the WISC-V, and the WAIS-IV’s PIQ scales depending of the age of the participant. PIQ scores ranged from 67 to 155 with a mean of 105 (SD=15.7). Recruitment took place at the CHU Ste-Justine Hospital and the University of Montreal. All participants were healthy and had no history of brain injury, psychiatric or neurological illnesses, did not take any medication, and were born at term. Normal hearing was reported in all participants. All of them were native French speakers. The study
protocol was reviewed and approved by the ethics, administrative, and scientific committees at the CHU Ste-Justine Hospital Research Center. Written informed consent obtained before the experiment from participants and parents or legal guardians of participants under the age of 18.
2.2 Apparatus, stimuli and procedure
Auditory stimuli were generated by a Dell Optiplex 790 PC using E-Prime 2.0 (Psychology Software Tools, Inc., Pittsburgh, PA, USA). A total of 30 two-syllables pseudowords were chosen as ecological stimuli to induce learning of unfamiliar material. These words were taken from the BELEC (Mousty, Leybaert, Alegria, Content, & Morais, 1994) and the ODÉDYS-II (Jacquier-Roux, Valdois, Zorman, Lequette, & Pouget, 2009) pediatric batteries. The pseudowords used had a mean duraation of 1365ms (SD= 8ms) and were recorded in a soundproof chamber while being read by a female native French speaker. Volume was normalized across pseudowords to -3dB SPL.
The EEG recording took place in an electrically shielded and dark soundproof experimental chamber. To induce a repetition effect, each pseudoword was presented six times with an interstimulus interval of 250ms. After the sixth presentation of the pseudoword, a 500ms inter-trial interval ensued, followed by the presentation of a new pseudoword. Stimuli were presented at a 70dB SPL intensity and 16-bit resolution. Two speakers (BX5a, M-Audio, Canada) were located laterally at a 30cm distance from the subject’s ears. A movie was shown to participants during the installation of the EEG net to reduce movement artifacts and facilitate the installation process. This same movie was silenced for the duration of the experiment (without subtitles), and participants were instructed to passively listen to the pseudowords being presented. The order of pseudowords was kept the same for all participants to avoid similar pseudowords to
2.3 EEG recordings ans analysis
A high-density EEG system containing 128 electrodes was used for continuous recording (Electrical Geodesics System Inc., Eugene, OR, USA). Signals were acquired and processed by a G4 Macintosh computer using NetStation EEG Software (Version 4.5.4). The vertex was used as the reference electrode during recording and impedances were maintained below 40 kΩ (Tucker, 1993). EEG data was analog bandpass filtered from 0.01 to 4000 Hz and sampled at 1000 Hz. Off-line pre-processing was carried out with MATLAB (version R2014b) and EEGlab toolbox (v.13.6.5b) (Delorme & Makeig, 2004; Makeig, Debener, Onton, & Delorme, 2004). Data was initially resampled to 250Hz and was digitally filtered with a lower-bound 0.5 filter and a 60Hz notch filter. Twenty-eight electrodes containing muscular artifacts, around the neck and face were removed for all participants. Electrodes with voltages lower than 2µV and higher than 200µV were removed using the trimOutlier plugin from EEGlab. Data was then re-referenced to an average reference. Eye movement artifacts were corrected using the semi-automatic independent component analysis (ICA) tool implemented in EEGlab. Each segment contains epochs from -440 to 1536ms encompassing each repetition of a pseudoword. EEGlab’s jointprob function (which determines the probability distribution of values across data epochs) was used to exclude trials in which values exceeded a certain threshold (in terms of standard deviation [SD], single channel limit was set to 6 SD and all-channel limit to 2 SD). Trials with voltage amplitudes of ±200 µV were also algorithmically removed. Finally, all trials were visually inspected and those contaminated with artifacts were manually removed. Following epoch rejection, an average of 148.55 epochs (SD 19.6) per participant were considered artefact free and kept for analysis.
For the time-frequency decomposition, six regions of interest (ROI) were chosen for analysis: left frontal (F3), right frontal (F4), centrofrontal (FCz), central (Cz), left temporal (T5) and right temporal (T6).
A Singular Value Decomposition (SVD) was computed on all electrodes defining each ROI with MATLAB (The Mathworks Inc., Natick, MA) and the first component was retained for each ROI. Each epoch of the SVD signal was analyzed in the time-frequency domain with complex Gaussian Morlet’s wavelets (Tallon-Baudry & Bertrand, 1999). This convolution provided for each trial a TF power map for each trial:
𝑃 𝑡, 𝑓 = 𝑤 𝑡, 𝑓 ∗ 𝑠 𝑡 )
where s(t) was the signal as a function of time t and w(t,f) was for each time t and frequency f a complex Morlet’s wavelet:
𝑤 𝑡, 𝑓 = 𝐴 ∗ 𝑒𝑥𝑝 −𝑡)
2𝜎1) ∗ 𝑒𝑥𝑝 2𝑖𝜋𝑓𝑡
with 𝐴 = (𝜎𝑡 𝜋)7 8
9 and 𝜎𝑡 = :
);<=, and σf a function of the frequency f: σf = @ AB.
In the EEGlab toolbox, wavelet cycles have been defined by entry 3 0.8 as parameters. A baseline correction was performed by computing the average of all six repetitions of a pseudoword and dividing each repetition by this mean. Each repetition was then represented as Event Related Spectral Perturbation (ERSP) plots. The ERSP (Makeig, 1993) shows mean log event-locked deviations from baseline mean power at each frequency. Finally, a grand mean average across subjects was computed for each ROI.
To identify the time-frequency windows of interest for the statistical analysis, six t-test maps were generated to identify significant differences between power in time-frequency oscillations associated with each repetition. T-test maps represented comparisons between subsequent presentations (i.e. first vs. second, second vs. third, etc).
Five time-frequency windows (TFW) showing significant repetition effects were identified. The sum of all values contained in each time-frequency window was used as total power in time-frequency oscillations value by window for each repetition of a pseudoword
2.4 Statistical analysis
All statistical analyses were performed using SPSS statistics, version 25 (IBM Corp., Armonk, NY, USA). Linear mixed model (LMM) analyses were performed to understand how age might contribute to repetition effects in spectral power. A LMM approach was chosen because it can easily deal with missing data and with small sample size, in addition to enabling random intercepts and slopes, allowing for nonlinear modelling and selecting appropriate covariance structure (Field, 2014; West, 2009). A series of steps were undergone to determine model fit starting by evaluating if fixed intercept and fixed slope would improve the ROI*TFW*Rep model according to the Chi-square -2log likelihood ratio test (Field, 2014). The appropriate polynomial structure for changes in power across repetitions was chosen by comparing model fit for linear, quadratic and cubic structures (Shek & Ma, 2011). LMM analysis was performed using maximum likelihood for estimation method (Field, 2014) and predictor groups, age and PIQ, were added sequentially, verifying if model fit was improved by addition of each predictor using chi-square likelihood ratio test (Field, 2014). Finally, covariance structure was selected by comparing model fit between available structures using Akaike’s Information Criterion (AIC) (Field, 2014).
Depending on the significant interactions and main effects found, additional LMMs were performed to explore power changes across repetitions on each TFW separately following the same series of steps previously described for each model. Bonferroni-corrected post hoc paired comparisons were performed for significant main effects. Significance level was set to 5% (p=0.05). Finally, in order to explore significant interactions and reveal patterns of RS, the cohort was divided into four age groups reflecting auditory development, namely 3 to 6, 7 to 11, 12 to 17, and 18 years and older (Litovsky, 2015) .
3. Results
3.1 Linear mixed models
Baseline model: intercept, slope and polynomial structure. The construction of the model started with a repeated measures (repetition (6) x ROI (6) x TFW (5)) baseline model with power as outcome variable and repetition, ROI and TFW as fixed effects, without any predictors. The Chi-square likelihood ratio test displayed a better fit with fixed intercept [vs. with a random intercept: χ2 (1, N = 101) = 0.125, p > 0.995]. Next, we introduced a random slope to the model, allowing slopes across repetitions to vary between participants, which did not significantly improve the model [c2 (1, N = 101) = -1391.796, p > 0.995]. To examine the fit of a quadratic
curve model, we added a quadratic term for repetition (repetition*repetition) to the model, which displayed a significantly better fit compared to the linear model [c2 (24, N = 101) = 167.029,
p < 0.001]. We then looked at the model fit of a cubic curve model by adding a cubic term (repetition*repetition*repetition) to the model, which demonstrated a significantly better fit compared to the quadratic model [c2 (24, N = 101) = 77.642, p < 0.001]. Therefore, using the
Predictors. The first predictor added to the model was age to verify if this information improves model fit. Interactions between repetition and TFW; age and repetition; age and TFW; age and ROI, and repetition, ROI and TFW as well as repetition, ROI and TFW were entered as fixed effects. Adding the predictor “age” improved the model significantly [c2 (15, N = 101) =
47.621, p < 0.001]. While no significant main effect was found for repetition and ROI, TFW yielded a significant effect (F (3, 4792.478) = 30.049, p= 0.0001), meaning that power significantly changed across TFW. Furthermore, a significant main effect was found for age (F (1, 3649.037) = 12.727, p= 0.0001), meaning that power also significantly changed across age. A significant interaction was found between the cubic repetition term and TFW (F (3, 4537.878) = 15.612, p= 0.0001), suggesting that power at each repetition differed between TFW. Finally, an interaction was found between the cubic repetition term and age (F (1, 3678.878) = 4.379, p= 0.036), suggesting that the cubic repetition term also differed according to age.
To evaluate the effect of IQ on the model, PIQ was added as a second predictor and fixed effect to the model. There were no significant results and model fit was not significantly improved with PIQ [c2 (9, N = 101) = 3.047, p >0.2]. PIQ was therefore not retained in the
subsequent models.
3.2 Models divided by TFW
Based on the significant interaction between TFW and repetitions, separate models for each TFW were built to examine their distinct repetition effects. The construction of the models for each TFW started again with a repeated measures baseline model (repetition (6) x ROI (6)) with TF power as outcome variable and repetition and ROI as fixed effects, without any predictors.
TFW1: 4.5-9Hz & 200 to 950ms. A fixed intercept, fixed slope and a quadratic curve model [c2 (6, N = 101) = 40.551, p < 0.001] had the best fit using the chi-square likelihood ratio test. Age was added as a predictor and model fit was significantly improved [c2 (8, N = 101) = 17.624, p <
0.05]. A significant main effect of age was observed (F (1, 1133.878) = 7.704, p = 0.006), meaning that power differed across age. Further, a significant interaction between age and quadratic repetition term was found (F (1, 1195.472) = 9.808, p = 0.002), showing that power for each repetition differed across age. Further statistical inquiries to explain this interaction are specified in the “Age interaction” section. Figure 1 shows the sum of powers across repetitions for TFW1.
Fig. 1 EEG sum of powers for TFW1 across presentations one through six (Rep1-Rep6) over ROI Cz averaged for each age group. Error bars are showing standard deviations. ***p<0.001
Rep 1Rep 2Rep 3Rep 4Rep 5Rep 6 Rep 1Rep 2Rep 3Rep 4Rep 5Rep 6 Rep 1Rep 2Rep 3Rep 4Rep 5Rep 6 Rep 1Rep 2Rep 3Rep 4Rep 5Rep 6 -1500 -1000 -500 0 500 1000 1500 Sum of power TFW1 3 to 6 years 7 to 11 years 12 to 17 years 18 years and older
*** *** *** *** ***
TFW2: 3-4.5Hz & 200 to 1000ms. As determined by the chi-square likelihood ratio test, best fit for the baseline model was found to be a fixed intercept and slope model with cubic curve [c2 (6,
N = 101) = 48.417, p <0.001]. A significant main effect was found for the quadratic repetition term (F (1, 943.772) = 31.669, p = 0.0001), meaning that power significantly changed between repetitions. A Bonferroni-corrected post hoc test showed a significant reduction in power between the first and all following presentations of a pseudoword (results in Table 1). The addition of age as a predictor did not improve the model significantly [c2 (9, N = 101) = -50.202,
p > 0.995]. Figure 2 shows the sum of powers across repetitions for TFW2.
Fig. 2 EEG sum of powers for TFW2 across presentations one through six (Rep1-Rep6) over ROI Cz averaged for each age group. Error bars are showing standard deviations. ***p< 0.001, **p<0.01
Rep 1Rep 2Rep 3Rep 4Rep 5Rep 6 Rep 1Rep 2Rep 3Rep 4Rep 5Rep 6 Rep 1Rep 2Rep 3Rep 4Rep 5Rep 6 Rep 1Rep 2Rep 3Rep 4Rep 5Rep 6 -1000 0 1000 Sum of power TFW2 3 to 6 years 7 to 11 years 12 to 17 years 18 years and older *** *** *** *** *** *** *** *** *** *** *** *** *** *** *** *** *** *** *** *** ** ** ** ** ** ** ** **
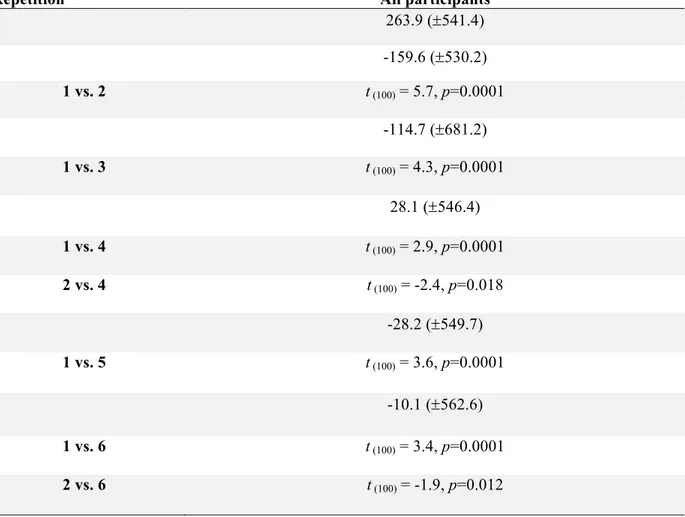
Table 1 Mean sum of power (±SD) for each repetition and age group and t statistics for significant power differences between repetitions at Cz and for TFW2 (Bonferroni corrected p-values).
Repetition All participants
1 263.9 (±541.4) 2 -159.6 (±530.2) 1 vs. 2 t (100) = 5.7, p=0.0001 3 -114.7 (±681.2) 1 vs. 3 t (100) = 4.3, p=0.0001 4 28.1 (±546.4) 1 vs. 4 t (100) = 2.9, p=0.0001 2 vs. 4 t (100) = -2.4, p=0.018 5 -28.2 (±549.7) 1 vs. 5 t (100) = 3.6, p=0.0001 6 -10.1 (±562.6) 1 vs. 6 t (100) = 3.4, p=0.0001 2 vs. 6 t (100) = -1.9, p=0.012
TFW3: 30-40Hz & 815 to 1125ms. Using the chi-square likelihood ratio test, best fit for the baseline model was found using a fixed intercept and slope and a cubic curve model [c2 (6,
N = 101) = 26.954, p <0.001]. The addition of age as a predictor significantly improved the model [c2 (9, N = 101) = 18.902, p <0.05]. This being said, the main effect for age was not
significant (F (1, 1466.885) = 1.093, p= 0.296) nor was the interaction of age and cubic repetition term (F (1, 1478.190) = 0.093, p= 0.761). A significant interaction was found between the cubic
repetition term and ROI (F (5, 2559.808) = 4.021, p= 0.001), meaning that power significantly changed between repetitions across ROI.
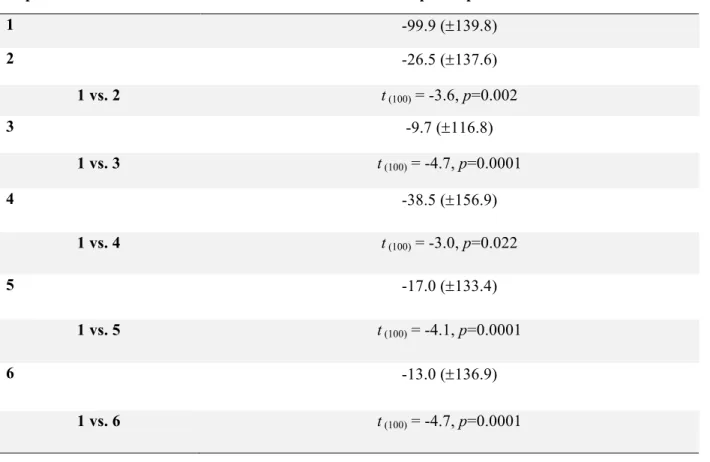
As was done with the previous TFW, LMMs were performed by ROI to explore this interaction. Again, the baseline model with the best fit was found to be a linear model with fixed intercept and slope. A significant main effect for repetition was found at frontocentral, left frontal, right frontal and right temporal sites [frontocentral: (F (1, 377.866) = 6.764, p= 0.010); left frontal: (F (1, 376.317) = 14.133, p= 0.0001); right frontal: (F (1, 378.319) = 4.067, p= 0.044); right temporal: (F (1, 375.515) = 4.847, p= 0.028)]. A Bonferroni-corrected post hoc test within each of these ROIs revealed significant differences in power between repetitions only in frontocentral and left frontal ROIs. For the frontocentral ROI, a significant increase in power between repetition 1 and 4 was observed. At left frontal ROI, a significant increase in power was observed between the first and all subsequent repetitions (results in Table 2).
Table 2 Mean sum of power (±SD) for each repetition and age group and t statistics for significant power differences between repetitions at F3g and for TFW3 (Bonferroni corrected p-values).
Repetition All participants
1 -99.9 (±139.8) 2 -26.5 (±137.6) 1 vs. 2 t (100) = -3.6, p=0.002 3 -9.7 (±116.8) 1 vs. 3 t (100) = -4.7, p=0.0001 4 -38.5 (±156.9) 1 vs. 4 t (100) = -3.0, p=0.022 5 -17.0 (±133.4) 1 vs. 5 t (100) = -4.1, p=0.0001 6 -13.0 (±136.9) 1 vs. 6 t (100) = -4.7, p=0.0001
TFW4: 3-5Hz & 1200 to 1500ms. Using the chi-square likelihood ratio test, best fit for the baseline model was found using a fixed intercept, fixed slope and a linear model. Age was added as a predictor and model fit was significantly improved [c2 (7, N = 101) = 15.005, p <0.05]. A
significant main effect of age was then observed (F (1, 951.511) = 6.530, p= 0.011), meaning that power differed across age. Further, a significant interaction between age and repetition was found (F (1, 976.855) = 6.498, p= 0.011), showing that power for each repetition differed across ages. Further statistical analyses to explain this interaction are specified in the “Age interaction” section.
3.3 Age interaction
As mentioned above, TFW1 and TFW4 all exhibited a repetition*age interaction. To further explore this significant interaction, we decided to split the cohort in the following four age groups: 3 to 6 years old, 7 to 11 years old, 12 to 17 years old and 18 years older. We ran separate LMMs for TWF1 and TWF5 by age groups in order to clarify how age influenced repetition effects. Using the steps described earlier, best model fit was obtained using a linear model with fixed intercept and slope.
3 to 6 years old. None of the two TFWs had a significant main effect for repetition in this age group [TFW1: (F (1, 113.698) = 0.080, p= 0.778); TFW4: (F (1, 113.441) = 0.072, p= 0.788)]. Figure 3 shows ERSPS plots for each repetition for the 3 to 6 years old age group.
Fig. 3 ERSP plots of repetitions one through six for participants with ages 3 to 6 at Cz.
7 to 11 years old. Neither of the two TFWs showed a significant main effect for repetition for this age group [TFW1: (F (1, 176.382) = 0.616, p= 0.434); TFW4: (F (1, 174.352) = 0.438, p= 0.495)]. Figure 4 shows the ERSP plots for each repetition for the 7 to 11 years old group.
Fig. 4 ERSP plots of repetitions one through six for participants with ages 7 to 11 at Cz.
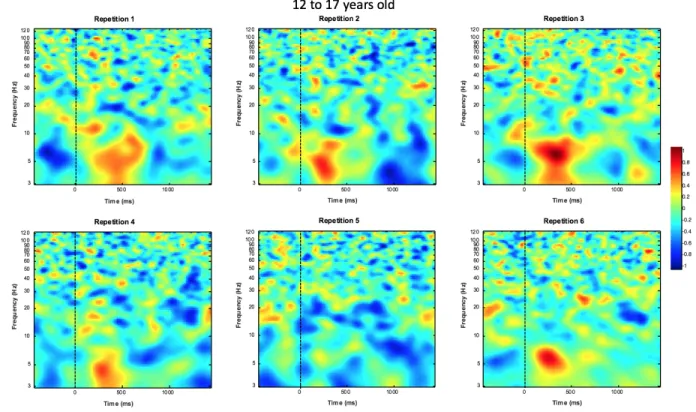
12 to 17 years old. Once again, the two TFWs did not show a statistically significant repetition effect for this age group [TFW1: (F (1, 146.053) = 0.704, p= 0.403); TFW4: (F (1, 166.336) = 0.000, p= 0.983)]. Figure 5 shows the ERPS plots for each repetition for the 12 to 17 years old group.
Fig. 5 ERSP plots of repetitions one through six for participants with ages 12 to 17 at Cz.
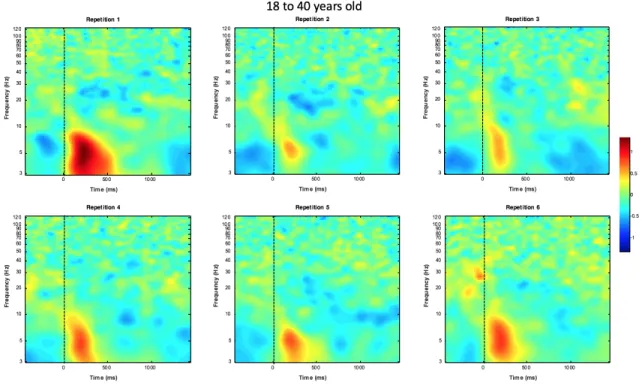
18 years old and above. Significant main effects of repetition were found for both TFWs in this age group. For TWF1, the significant main effect observed (F (1, 446.970) = 14.615, p= 0.0001) showed that power changed between repetitions. A Bonferroni-corrected post hoc test showed a significant reduction in power between repetition one and all subsequent repetitions (results in Table 3). TFW4 showed a significant main effect for repetition (F (1, 502.091) = 12.267, p= 0.001). Bonferroni-corrected post hoc test showed that the reduction in power is significant between repetitions 1 and 5 as well as 1 and 6 (results in Table 4). Figure 6 shows the ERSP plots for each repetition for the 18 years and older group.
Table 3 Mean sum of power (±SD) for each repetition and age group and t statistics for significant power differences between repetitions at Cz and for TFW1 (Bonferroni corrected p-values).
Repetition 3 to 6 years 7 to 11 years 12 to 17 years 18 years and older
1 51.2 (±478.8) -97.4 (±839.1) 218.9 (±752.1) 378.0 (±710.1) 2 -3.1 (±580.7) -239.5 (±710.1) 64.8 (±419.4) -265.2 (±699.6) 1 vs. 2 t (636) = 4.585, p=0.0001 3 139.1 (±839.1) -66.9 (±665.9) 418.8 (±879.3) -276.5 (±726.0) 1 vs. 3 t (520) = 4.570, p=0.0001 4 -225.3 (±678.2) 42.8 (±637.5) -221.2 (±782.6) -186.0 (±699.2) 1 vs. 4 t (519) = 3.622, p=0.0001 5 -288.9 (±681.2) -119.5 (±749.0) -325.0 (±854.3) -229.9 (±894.6) 1 vs. 5 t (519) = 4.017, p=0.0001 6 -134.6 (±839.1) -225.9 (±625.7) 201.1 (±779.9) 32.0 (±721.5) 1 vs. 6 t (519) = 2.685, p=0.001
Table 4 Mean sum of power (±SD) for each repetition and age group and t statistics for significant power differences between repetitions at Cz and for TFW4 (Bonferroni corrected p-values).
Repetition 3 to 6 years 7 to 11 years 12 to 17 years 18 years and older
1 -141.3 (±191.5) -167.9(±279.9) -88.3 (±254.9) -185.9 (±285.2) 2 -23.5 (±292.1) -73.4 (±259.7) -121.8 (±273.3) -140.6 (±275.4) 3 -54.8 (±242.9) -11.5 (±280.0) -0.3 (±290.8) -170.6 (±293.6) 4 -34.2 (±168.1) -122.1 (±264.7) -182.7 (±285.4) -154.7 (±324.4) 5 -164.8 (±180.1) 43.6 (±267.6) -166.2 (±343.2) -63.9 (±295.1) 1 vs. 5 t (519) = -2.0, p=0.049 6 -107.4 (±286.8) -46.8 (±247.7) -5.1 (±365.8) -19.7 (±297.7) 1 vs. 6 t (519) = -3.2, p=0.002