HAL Id: hal-01462457
https://hal.archives-ouvertes.fr/hal-01462457
Submitted on 6 Jun 2020
HAL is a multi-disciplinary open access archive for the deposit and dissemination of sci-entific research documents, whether they are pub-lished or not. The documents may come from teaching and research institutions in France or abroad, or from public or private research centers.
L’archive ouverte pluridisciplinaire HAL, est destinée au dépôt et à la diffusion de documents scientifiques de niveau recherche, publiés ou non, émanant des établissements d’enseignement et de recherche français ou étrangers, des laboratoires publics ou privés.
Impact analysis of the CAP reform on main agricultural
commodities. Report III AGMEMOD – Model
Description
Lubica Bartova, Robert M’Barek, Hans van Meijl, Myrna van Leeuwen,
Andrzej Tabeau, Petra Salamon, Oliver von Ledebur, Frederic Chantreuil,
Fabrice Levert, Trevor Donnellan, et al.
To cite this version:
Lubica Bartova, Robert M’Barek, Hans van Meijl, Myrna van Leeuwen, Andrzej Tabeau, et al.. Impact analysis of the CAP reform on main agricultural commodities. Report III AGMEMOD – Model Description. [Contract] EUR 22940 EN/3, European Commission. 2008, 95 p. �hal-01462457�
EUR 22940 EN/3 - 2008
Impact Analysis of CAP Reform on the
Main Agricultural Commodities
Report IIIAGMEMOD – Model Description
Author: AGMEMOD Partnership Editors: Lubica Bartova and Robert M'barek
The mission of the IPTS is to provide customer-driven support to the EU policy-making process by researching science-based responses to policy challenges that have both a socio-economic as well as a scientific/technological dimension.
European Commission
Directorate-General Joint Research Centre Institute for Prospective Technological Studies Contact information
Address: Edificio Expo. c/ Inca Garcilaso, s/n. E-41092 Seville (Spain) E-mail: jrc-ipts-secretariat@ec.europa.eu Tel.: +34 954488318 Fax: +34 954488300 http://ipts.jrc.ec.europa.eu http://www.jrc.cec.eu.int Legal Notice
Neither the European Commission nor any person acting on behalf of the Commission is responsible for the use which might be made of this publication.
A great deal of additional information on the European Union is available on the Internet. It can be accessed through the Europa server
http://europa.eu.int
JRC44263 EUR 22940 EN/3 ISSN 1018-5593
Luxembourg: Office for Official Publications of the European Communities
© European Communities, 2008
Impact Analysis of CAP Reform
on the Main Agricultural Commodities
Report III
AGMEMOD – Model Description
Author:
AGMEMOD Partnership
Editors:
Lubica Bartova and Robert M'barek
Report III AGMEMOD – Model Description
■ AGMEMOD Partnership:
• Agricultural Economics Research Institute (LEI), The Hague, The Netherlands: Hans van Meijl, Myrna van
Leeuwen, Andrzej Tabeau
• Bundesforschungsanstalt für Landwirtschaft (FAL), Braunschweig, Germany: Petra Salamon, Oliver von
Ledebur
• Centre of Agricultural Economics, INRA-ESR, Rennes, France: Frédéric Chantreuil, Fabrice Levert
• Teagasc-Rural Economy Research Centre (RERC), Athenry, Co. Galway, Ireland: Trevor Donnellan, Kevin
Hanrahan
• Latvian State Institute of Agrarian Economics (LSIAE), Riga, Latvia: Danute Jasjko, Guna Salputra, Ludmilla
Fadejeva
• University of Ljubljana, Biotechnical Faculty (LJUB), Ljubljana, Slovenia: Emil Erjavec, Stane Kavcic, Darja
Regoršek
• Universitat fur Bodenkultur Wien (BOKU), Wien, Austria: Martin Kniepert
• Université Catholique de Louvain (UCL), Louvain-La-Neuve, Belgium: Bruno Henry de Frahan, Olivier
Harmignie
• Institute of Agriculture Economics (IEABG), Sofia, Bulgaria: Nedka Ivanova, Mariya Peneva
• Research Institute of Agriculture Economics (VUZE), Prague, Czech Republic: Ivan Foltyn, Jan Kubát • Food and Resource Economic Institute (FØI), Frederiksberg C, Denmark: Jorgen Dejgaard Jensen
• Institute of Economics and Social Sciences of Estonian Agricultural University (EAU), Tartu, Estonia: Mati Sepp • MTT Agrifood Research Finland (MTT), Helsinki, Finland: Jyrki Niemi, Lauri Kettunen
• Department of Economics, University of Athens (NKUA), Athens, Greece: Elias Mantzouneas • Corvinus University of Budapest (CUB), Budapest, Hungary: Tibor Ferenczi
• Polytechnic University of Marche-Ancona (UNIVPM), Ancona, Italy: Roberto Esposti, Antonello Lobianco • Lithuanian Institute of Agrarian Economics (LAEI), Vilnius, Lithuania: Irena Krisciukaitiene, Salomeja
Andrekiene, Andrej Jedik, Willi Meyers, Aiste Galnaityte
• Warsaw School of Economics (WSE), Warsaw, Poland: Sylwia Krawczyńska, Katarzyna Kowalska
• Institute of Agricultural Economics (IEARO), Bucharest, Romania: Camelia Serbanescu, Cristian Kevorchian • Slovak Agricultural University (SAU), Nitra, Slovak Republic: Lubica Bartova, Pavel Ciaian, Jan Pokrivcak • Unidad de Economia Agraria, Centro de Investigacion y Tecnologia Agroalimentaria de Aragon, (CITA),
Zaragoza, Spain: Azucena Gracia
Report III AGMEMOD – Model Description 1
■ Foreword
Quantitative models are important tools for analysing the impact of agricultural policies. One of the modelling approaches used to analyse the impact of the Common Agricultural Policy is AGMEMOD (AGricultural MEmber states MODelling), an econometric, dynamic, partial equilibrium, multi-country, multi-market model. AGMEMOD models provide extensive details of the agricultural sector in individual EU Member States and the EU as a whole.
A study was carried out from November 2005 until June 2007 by the AGMEMOD Partnership under the management of the Agricultural Economics Research Institute (LEI, the Netherlands), in cooperation with the European Commission's Joint Research Centre - Institute for Prospective Technological Studies (JRC-IPTS). The aim was to generate projections for the main agricultural commodity markets for each year from 2005 until 2015.
Detailed documentation on the AGMEMOD modelling approach, along with the outcome of the study, is published in five reports in the JRC-IPTS Scientific and Technical Report Series (Box 1) under the heading "Impact analysis of CAP reform on the main agricultural commodities". Box 1 Impact analysis of CAP reform on the main agricultural commodities
Report I AGMEMOD – Summary Report
This report presents the projections of agricultural commodity markets under the baseline, further CAP reform, enlargement scenarios and exchange rate change sensitivity analyses for the aggregates EU-10, EU-15, EU-25 and EU-27. It summarises the characteristics of the modelling tool used, focusing in particular on the features implemented in this study, and addresses issues that need further attention. (http://www.jrc.es/publications)
Report II AGMEMOD – Member States Results
This report outlines the results of the baseline projections of agricultural commodity markets, further CAP reform scenario impact analyses and exchange rate change sensitivity analyses for individual EU-27 Member States except Malta and Cyprus. For Bulgaria and Romania enlargement and non-enlargement scenarios are analysed. (http://www.jrc.es/publications)
Report III AGMEMOD – Model Description
This report describes the modelling techniques used by the AGMEMOD Partnership, with the emphasis on new commodities modelled and policy modelling approaches. (http://www.jrc.es/publications)
Report IV AGMEMOD – GSE Interface Manual
The Manual gives an overview of the GAMS Simulation Environment (GSE) interface and its application with the AGMEMOD model. (http://www.jrc.es/publications)
Report V Commodity Modelling in an Enlarged Europe – November 2006 Workshop Proceedings
These proceedings consist of presentations and conclusions of a workshop held in November 2006. The presentation of outcomes of the other models such as FAPRI, ESIM, AGLINK and CAPSIM are included in addition to the AGMEMOD approach. (http://www.jrc.es/publications)
We acknowledge the work undertaken by country teams of the AGMEMOD Partnership and by Myrna van Leeuwen, LEI, the Netherlands, the project co-ordinator.
Report III AGMEMOD – Model Description 2
■ Executive summary
In this report the AGMEMOD modelling tool, modelling techniques, scenarios and new features developed and applied in a study carried out by the AGMEMOD Partnership in cooperation with JRC-IPTS are described. AGMEMOD is an econometric, dynamic, partial equilibrium, multi-country, multi-market model and provides extensive details of the agricultural sector in individual EU Member States and the EU as a whole.
The objectives of the study were threefold:
i) To provide market projections for the main European agricultural commodities based on the latest agricultural and trade policy developments and information available;
ii) To assess the impacts of selected scenarios on the main European agricultural commodity markets. In particular, these scenarios concern the introduction of decoupling and new direct payment schemes as well as the enlargement of the EU in 2007;
iii) To apply and improve an agricultural sector model for the enlarged EU, implemented in standard computer software (GAMS and MS Excel), and to make a preliminary version operational and available for the European Commission.
Projections and simulations have been generated for individual EU Member States and the EU at
different aggregation levels (EU-10, EU-15, EU-25, EU-27), providing results on supply, demand, trade and prices for the main agricultural commodities (cereals, oilseeds, livestock products and dairy products).
The impact of the following scenarios was analysed:
• The Baseline scenario for the Member States before the 2004 enlargement and Slovenia models reflects the 2003 CAP reform, which covers the additional milk quotas, a cut in intervention prices and national implementation of the Single Farm Payment Scheme (SFP). For the 2004 enlargement Member States implementation of the Single Area Payment Scheme (SAPS) until 2008 followed by introduction of the Single Farm Payment Scheme from 2009 onwards are assumed. Complementary national direct payments remain in force in the Member States of the 2004 enlargement until 2013; • The Further CAP Reform scenario, in which all direct payments are decoupled and the
rates of compulsory modulation are doubled to 10%, both from 2007 onwards;
• The Enlargement scenario, which examines the consequences of accession to the EU of Bulgaria and Romania.
The AGMEMOD modelling system applied in this study has been econometrically estimated at individual Member State level. The country models contain the behavioural responses of economic agents to changes in prices, policy instruments and other exogenous variables of agricultural markets. Commodity prices adjust so as to clear all markets considered. For each commodity modelled and in each country, the system generates the main domestic market variables such as production, food and feed demand, prices, trade and stocks. Agricultural income is calculated at sector level. As all policy-relevant agricultural markets are covered, the econometrically modelled country-specific agricultural markets also provide a sound basis for an analysis of the impacts of policy changes.
To ensure that the projections of the modelling system are consistent from an economic and policy perspective, projections have been validated by standard econometric methods and through consultation with national experts. In addition, the study analysed the impact of three alternative paths of the US dollar against the euro exchange rate changes in a form of a sensitivity analysis.
Report III AGMEMOD – Model Description 3 The obtained projections largely accord with the a priori expectations. A decline (increase in the value of the €/US dollar exchange rate compared with the baseline assumptions leads to higher (lower) internal EU market prices and consequent adjustments to production, domestic use, imports and exports.
Although results differ across countries, the key findings of this study regarding the aggregated EU-25 baseline projection analyses are as follows:
• Despite the decoupling measures of the 2003 CAP reform (also referred to as the Luxembourg Agreement), the EU production in several sectors (wheat, maize) will grow over the period 2005-2015.
• Higher dynamics can be found in the oilseed sector with demand propelling the markets. • The decoupled payments will induce a further decline in beef and lamb production. • Pig meat and poultry production are largely unaffected by decoupling.
• The dairy sector is expected to be negatively affected by declining prices, which occur largely as a consequence of the reductions in intervention prices for dairy products, but quotas will still be fulfilled.
• A shift away from butter and skimmed milk powder production can be expected and at the same time growth in the production of cheese is projected.
The key findings of this study regarding the scenario projection analyses are as follows: • The Further CAP Reform scenario projections tie in with a priori expectations, in that the
impact of policy measures assumed in this scenario is very limited due to the fact that many Member States had already chosen to largely decouple direct payments under their implementation of the Luxembourg Agreement at national level.
• The 2007 Enlargement of the EU with the accession of Romania and Bulgaria is not expected to dramatically change the situation of most key EU agricultural markets. There are increases projected for the production of EU sunflower oil, soft wheat and maize, but accession is projected to have less of an impact on livestock and meat markets.
Although the agricultural markets of the individual countries have different levels of development and the country models are being further developed, the projections provide useful information about general trends of individual Member State agricultural markets.
This report, Report III AGMEMOD - Model Description, summarises methodological issues and describes how a plausible and consistent database is developed as a basis for correctly estimating model parameters, achieving proper simulation results and policy recommendations. The principles of equation specifications and model closure are depicted, followed by an analysis of applied estimations and testing techniques for models. The report describes the projection and simulation procedures of a particular country and EU models and the structure of a particular country and AGMEMOD EU models.
New commodities (rye, oat, triticale) have been modelled and implemented in the AGMEMOD model under the JRC-IPTS study. The commodity models (described in flow charts), the linkages of commodity models in a particular country model and EU models are explained. Special attention is given to the role of prices and closure of models. In addition, the report also discusses further development of AGMEMOD modelling tools.
Report III AGMEMOD – Model Description 4
■
Table of contents
■ Foreword... 1 ■ Executive summary... 2 ■ Table of contents ... 4 List of Tables... 4 List of Figures ... 5 List of Annexes ... 6 Acronyms ... 6 1. Introduction ... 72. Methodology of AGMEMOD model ... 9
2.1. Data base ... 9
2.2. Functional form models... 12
2.3. Estimation and validation ... 17
2.4. Solving the EU model... 18
2.5. Projection generation ... 19
3. Model structures... 21
3.1. Overview on country model structure... 21
3.2. Commodity models ... 23
3.3. EU-15 model... 27
3.4. EU-25 and EU27 models... 30
3.5. Validation ... 31
4. New commodities in AGMEMOD: rye, oat and triticale ... 33
4.1. Production of rye... 34
4.2. Production of oats ... 37
4.3. Production of triticale ... 39
4.4. German market of rye, oat and triticale ... 40
4.5. New AGMEMOD commodity markets and policy description... 45
4.6. Model implementation of new commodities in the AGMEMOD model ... 49
5. Scenarios ... 53
5.1. Baseline scenario ... 53
5.2. ‘Further CAP reform’ Scenario ... 56
5.3. Implementation of SFP, SAPS and decoupling in country models ... 58
5.4. USD/EUR exchange rate Scenario... 68
5.5. EU Enlargement scenario... 71
6. Software environment... 73
7. Discussion and conclusions... 76
8. References ... 78
9. Annexes ... 80
List of Tables
Table 2.1: CAP policy variables ... 11Table 2.2: Commodities and their key markets ... 12
Table 3.1: Technical characteristics of country models in AGMEMOD... 23
Table 3.2: Output characteristics of country models in AGMEMOD ... 23
Table 4.1: Cereal intervention stocks in the EU and Germany (1000 mt) ... 35
Table 4.2: Area of production (1000 ha), yield (100 kg/ha) and production of rye (1000 mt) in the EU-25 ... 36
Table 4.3: Balance sheet of rye in Poland (in 1000 mt)... 37
Table 4.4: Area of production (1000 ha), yield (100 kg/ha) and production of oats (1000 mt) in the EU-25... 39
Table 4.5: Area of production (1000 ha), yield (100 kg/ha) and production of triticale (1000 mt) in the EU-25. 40 Table 4.6: Balance sheet for rye in Germany (in 1000 mt) ... 41
Table 4.7: Balance sheet for oats in Germany (1000 mt)... 42
Table 4.8: Balance sheet for triticale in Germany (1000 mt)... 43
Table 4.9: New product model mnemonics description ... 51
Report III AGMEMOD – Model Description 5
Table 5.2: World Crop Price Projections used in the Baseline and Scenario Projections ... 55
Table 5.3: World Meat and Dairy Product Price Projections used in the Baseline and Scenario Projections .... 55
Table 5.4: Total supply inducing multiplier impacts of decoupled payments in EU-15 and in Slovenia, up to 2015 ... 63
Table 5.5: Total supply inducing multiplier impact of SAPS payments in New Member States up to 2015 (MULT4) ... 66
Table 5.6: Total supply inducing multiplier impact of CNDP in New Member States, 2015 (MULT5)... 67
Table 9.1: Compulsory and Voluntary Modulation Rates in France and the Netherlands ... 82
Table 9.2: Budgetary support (euro per 100 kg) for main agricultural commodities in the Czech Republic... 83
Table 9.3: Budgetary support (euro per 100 kg) for main agricultural commodities in Estonia ... 83
Table 9.4: Budgetary support (euro per 100 kg) for main agricultural commodities in Hungary ... 83
Table 9.5: Budgetary support (euro per 100 kg) for main agricultural commodities in Latvia ... 84
Table 9.6: Budgetary support (euro per 100 kg) for main agricultural commodities in Lithuania... 84
Table 9.7: Budgetary support (euro per 100 kg) for main agricultural commodities in Poland... 84
Table 9.8: Budgetary support (euro per 100 kg) for main agricultural commodities in Slovakia ... 85
Table 9.9: Baseline Exchange Rate Data... 86
Table 9.10: Exchange rate data at US$ 1.3 per euro... 87
Table 9.11: Exchange rate data at US$ 1.4 per euro... 87
Table 9.12: Exchange rate data at US$ 1.0 per euro... 88
Table 9.13: Macro-economic assumptions for Bulgaria... 89
Table 9.14: Macro-economic assumptions for Romania... 89
Table 9.15: Price determination for agricultural products in Bulgaria (prod prices, euro per tonne)... 90
Table 9.16: Price determination for agricultural products in Romania (prod. prices, euro per tonne) ... 91
Table 9.17: Budgetary support for agricultural commodities in Bulgarian model (mio euro) ... 92
Table 9.18: Budgetary support for agricultural commodities in Romanian model (mio euro) ... 93
List of Figures
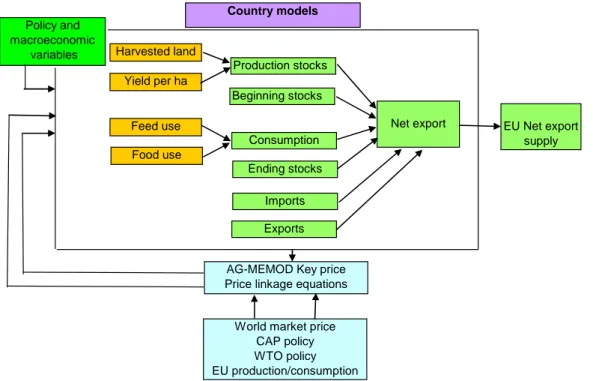
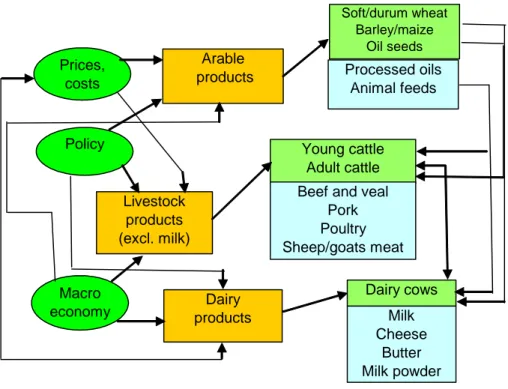
Figure 3.1: Country and EU model structure in AGMEMOD ... 21Figure 3.2: Linkages between commodity markets in AGMEMOD ... 24
Figure 3.3: Cattle and beef model in AGMEMOD ... 24
Figure 3.4: Pigs and pig meat model in AGMEMOD ... 25
Figure 3.5: Sheep and sheep meat model in AGMEMOD... 25
Figure 3.6: Poultry model in AGMEMOD... 26
Figure 3.7: Dairy products model in AGMEMOD... 26
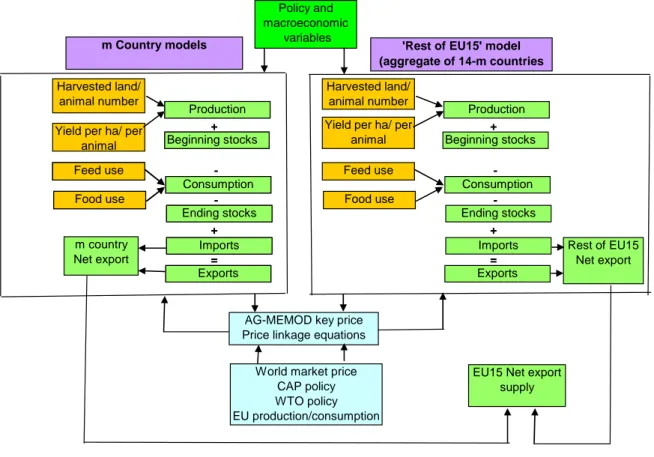
Figure 3.8: EU-15 model commodity structure in AGMEMOD ... 27
Figure 3.9: File structure of the EU-15 model... 29
Figure 3.10: EU-25 hybrid model structure in AGMEMOD... 30
Figure 3.11: EU27 hybrid model structure in AGMEMOD... 31
Figure 4.1: Comparison of EU coarse grain production between 1991 and 2004 ... 33
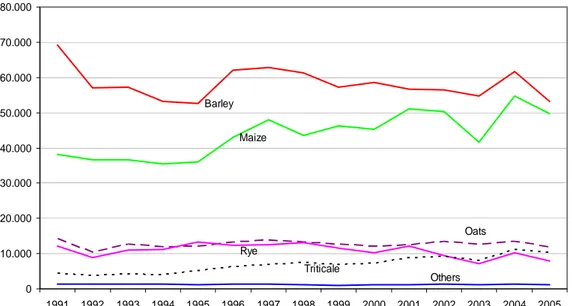
Figure 4.2: Development of coarse grain production in the EU-25 ... 34
Figure 4.3: EU-25 rye production share for 2005 ... 36
Figure 4.4: EU-25 oats production share 2005 ... 38
Figure 4.5: EU-25 triticale production share 2005 ... 40
Figure 4.6: Rye prices in Germany 1999 to 2005 (€/tonnes) ... 42
Figure 4.7: Development of feed oats prices in Germany 1999 to 2005 (€/tonne) ... 43
Figure 4.8: Development of triticale prices in Germany 1998/99 to 2004/05 (€/tonne) ... 44
Figure 4.9: Rye, oats and triticale in the EU (1,000 ton)... 45
Figure 4.10: Share of EU-25 rye, oats and triticale production in most important EU countries, 2004 ... 46
Figure 4.11: Area allocation of grains ... 47
Figure 4.12: Rye sub-model in AGMEMOD ... 48
Figure 4.13: 'Other grains' sub-model in AGMEMOD... 48
Figure 4.14: German producer prices for barley, rye and 'other grains' (oats) ... 49
Figure 4.15: The grain sub-model ... 52
Figure 5.1: Baseline Exchange Rate... 55
Figure 5.2: World market prices used in Baseline and Scenario Projections... 56
Figure 5.3: US$/euro exchange rate projections ... 69
Figure 6.1: GSE concept in relation to AGMEMOD ... 74
Report III AGMEMOD – Model Description 6
List of Annexes
Annex 1: Implementing the Single Payment Scheme in the AGMEMOD model ... 80
Annex 2: Baseline policy implementation in the Member States of the 2004 enlargement ... 83
Annex 3: Baseline exchange rate data ... 86
Annex 4: Scenario exchange rate data... 87
Annex 5: Assumptions for Bulgaria and Romania in (Non)-Enlargement scenarios ... 89
Acronyms
AGMEMOD AGricultural MEmber states MODelling
CAP Common Agricultural Policy
CEECs Central and Eastern European Countries
CNDP Complementary National Direct Payments (top-ups)
EU-10 8 EU Member States of the 2004 enlargement, Malta and Cyprus not included EU-12 10 EU Member States of the 2004 and 2007 enlargements, Malta and Cyprus not
included
EU-15 15 EU Member States to May 2004
EU-25 23 EU Member States after the 2004 enlargement, Malta and Cyprus not included
EU-27 25 EU Member States after the 2007 enlargement, Malta and Cyprus not included
FAPRI Food and Agricultural Policy Research Institute, USA
GAMS General Algebraic Modelling System
GDP Gross Domestic Product
GSE GAMS Simulation Environment
JRC-IPTS Joint Research Centre - Institute for Prospective Technological Studies (Spain)
MS Member State
OECD Organisation for Economic Co-operation and Development
PSE Producer Support Estimate
SAPS Single Area Payment Scheme
SFP Single Farm Payment
USD U.S. Dollar
Introduction
Report III AGMEMOD – Model Description 7
1. Introduction
The most common approaches for quantitative assessments of agricultural policy reforms are based on partial equilibrium (PE), computable general equilibrium (CGE) and programming models. A broader variety of models can be found in depicting impacts of the Common Agricultural Policy (CAP), but their use is more focused on production effects and on farms impacts alone rather than on market reactions. Typically these models formulate different production activities which are optimised with respect to a set of production restrictions, prices and costs. Values concerning these variables are usually set exogenously. Instead of values for prices or costs, functions can be implemented in these models so that they will also reflect market processes. However, even with such improvements, the models often tend to be hypersensitive to small changes.
The advantage of CGE models is that they capture the interaction between the agricultural sector and the non-agricultural sectors of the economy and quite frequently the global integration (Van Tongeren and Van Meijl, 2001). However, to limit the complexity of the models and to improve their computational feasibility, agricultural production is often aggregated. Furthermore, inclusion of some agricultural policy measures is sometimes difficult due to this aggregation of agricultural production and inadequate representation of physical resource constraints (Banse and Hagerman, 1996). Tyers and Anderson (1992) note that such aggregation often weakens the interaction and causal linkages between different agricultural production sectors in CGE models. Moreover, it is quite common to model agricultural policy instruments as price wedges. PE models do not include by definition linkages that allow for the analysis of the impact of developments in the agricultural sector on other sectors of the economy. Otherwise PE models incorporate more details on production and policy instruments (Salvatici et al., 2001). PE models generally describe one sector or a group of closely related products in an economy with a greater level of dis-aggregation than is common in CGE models. Due to the capacity of PE models to incorporate detailed representations of relationships between policy instruments and agricultural commodity supply and demand, these types of models are very suitable to the analysis of the agricultural sector of developed economies. The PE framework also facilitates the extensive coverage of detailed products and countries. Important features of the PE model grouping are their relatively simple economic structure, and interpretable results. This last feature can be advantageous when model results are used by non-economists. A more detailed overview on general and partial equilibrium models and their different features can be found in Van Tongeren and Van Meijl (2001).
One of the study objectives was to apply and further develop a modelling system that captures the dynamics of a large number of agricultural commodity markets, the impact on these markets of a diversity of applied policy instruments as implemented across each EU Member State. For these purposes projections and scenario simulations have been carried out with AGMEMOD model, a PE modelling approach.
The AGMEMOD model was improved in the following way:
• new commodities ‘rye’ and ‘'other grains'’ were specified, estimated and implemented in the country models of significance;
• the decoupled payment system was modelled differentially across the Member States in
line with national implementation;
• the EU-10 models were prepared for migration from Excel to GAMS;
Introduction
Report III AGMEMOD – Model Description 8
• the EU-10 models were added to the combined EU-15 version, resulting in a EU-25
hybrid model;
• the Bulgarian and Romanian models were added to the EU-25 hybrid model, resulting in
a EU-27 hybrid model;
• user-friendly software was implemented in the combined EU-15 model.
The present Report III AGMEMOD - Model Description is comprised as follows. Chapter two summarises the methodological issues. It describes how a plausible and consistent database is developed as a basis for estimating the models correctly and achieving proper simulation results and policy recommendations. The principles of the equation specifications and the model closure are depicted, followed by an examination of the applied estimation and testing techniques for the commodity models. The final part in this chapter looks at the projection and simulation procedures of the country and EU models. The third chapter describes the structure of the country and EU models of AGMEMOD.
The fourth chapter contains a description of new commodity markets in AGMEMOD and how they are modelled. It shows the commodity models (flow charts), the linkages of commodity models in a country model and the EU models. Special attention is given to the role of prices and closures of the models.
Policy scenarios applied in this study are described in the chapter five and software environment of AGMEMOD in chapter six. Finally chapter seven outlines the state of the art of the AGMEMOD modelling tool and discusses further developments.
Methodology of AGMEMOD model
Report III AGMEMOD – Model Description 9
2. Methodology of AGMEMOD model
This chapter outlines the research techniques used in the AGMEMOD model: the development of country model templates, the selection and acquisition of data, the description of the model’s functional forms, the validation procedures, the solving of the model and the generation of projections. Each of these steps is described in the chapter.
The foundation for AGMEMOD model is laid on the country model templates, which assure compatibility of the national models and the commonality of data. The country model templates encapsulate the modelling system used. This system consists of econometric and calibrated models for the main agricultural commodities in the EU Member States. The software embodying the template is also designed so that the resulting country models link together to form a combined one for the EU as a whole.
The model template (Hanrahan, 2001; Riordan, 2002) contains the following issues in respect to the commodity markets in AGMEMOD:
• outline of the role of the commodities in the agricultural sector, its relationship with other commodities and its connection with input markets;
• definition of policy instruments to be explicitly included; • layout of flow charts to show:
- the linkages between production, consumption, stock and trade;
- the influence of economic and policy variables;
- the linkages with other commodity markets;
• assembly and use of data according to agreed definitions; • information on the key prices such as:
- the EU key market;
- specification of price equation;
- econometric estimation and projections up to 2015; • specification of the functional forms of the commodity model; • labelling of variables (mnemonics).
Partners from EU Member States applied the template to develop their national AGMEMOD model.
2.1. Data base
A plausible and consistent database is necessary to estimate the country models correctly. The criteria for assessing the admissibility of data in the project include:
- reliability and accessibility of the data series and their up-dating;
- additivity of variables: the country level numbers for many variables have to add-up to acceptable totals for the EU as a whole (e.g., the national commodity balance sheets must add-up to that for the EU);
- data consistency across all models for the variables that drive the individual models, (e.g., the currency exchange rates);
- availability of the projections for the macroeconomic variables that drive the models (e.g., GDP, inflation, population growth);
- relevance of the data to the users of the results.
Methodology of AGMEMOD model
Report III AGMEMOD – Model Description 10
refer to initial stocks, production, imports, human food consumption, feed use, processing and industrial use, exports and ending stocks. Eurostat data sources - AgrIS (Agricultural Information System) and NewCronos are used as these meet the above mentioned criteria. Furthermore, these sources have user's relevance as they will tend to be widely used and referenced by policy makers and agricultural interests. The ideal condition would be to use all data from the same database. In practice, however, databases may be incomplete or inconsistent in showing different numbers for the same variables or they may include unclear definitions. Gaps range from the absence of a data point in a series, to the total absence of data for the series in one or more countries. Where there were gaps, comparable data from other sources (FAO, USDA and national sources) are derived, or, as a last resort, interpolations based on statistical techniques or expert judgement are used. Data sources must always be communicated, so that discrepancies can be detected.
Data in Eurostat sources, like in other databases, are subject to frequent revisions. These revisions might not only affect the previous years but also longer periods. As long as these amendments are not taken into account by re-estimations, model results will not reflect the changes in the database. Since the models are not re-estimated in the JRC-IPTS study, one has to keep in mind that deviations, between model projections and actual data, could be caused by data revisions. The AGMEMOD model uses two types of data, a set for exogenous variables and a set for endogenous variables. The integrity of the model results rests on the use of both data sets.
Exogenous data
Data for exogenous variables are determined outside the model. In the selection of these data series, attention is given to the availability of authoritative projections of their levels to 2015. Exogenous data for macroeconomic variables, policy variables and key prices are consistent across all of the country models in AGMEMOD. Exogenous data sets are now briefly described.
Macroeconomic data
Variables included in this data set are: - inflation rates per country;
- per capita economic growth per country;
- currency exchange rates (U.S. dollar/euro, national currency/euro); - population per country;
- world market price per commodity.
Macroeconomic projections are obtained from the Commission services and other internationally recognised sources. They are checked so as to ensure that radically divergent projections, for the development of inflation, currency exchange rates and economic growth across EU Member States, are not used.
Values for the world market price projections are used from the FAPRI modelling system, with the similar to AGMEMOD model structure. This allows for the incorporation of the impact of global supply and demand developments on the EU agricultural markets.
Policy data
Policy data show the variables affected by CAP and GATT-WTO measures and reflect the differences in policies applied across EU member states (Table 2.1). AGMEMOD includes the following policy variables:
Methodology of AGMEMOD model
Report III AGMEMOD – Model Description 11
- Subsidies on products, including aids/grants for crops and headage premiums; - Subsidies on production, including those for land set-aside and for cattle premiums; - Quantitative restrictions, including quotas for milk deliveries and for numbers of animals
eligible for headage payments; - Single Farm Payment (SFP);
- Single Area Payment Schemes (SAPS) for new Member States (the 2004 and 2007 enlargements);
- Ssubsidised export limits and tariff rate quota levels.
Table 2.1: CAP policy variables
Market Policy variables
Grains
Set-aside rate Compensation Intervention price Reference yield
Oilseeds Set-aside rate Compensation
Reference yield
Livestock
Suckler cow quota Bull premium Suckler cow premium Beef intervention price Ewe premium
Animal density threshold
Dairy
Milk quota (adjusted) Feed subsidy
Butter consumption subsidy Butter intervention price SMP intervention price CAP reform of June 2003 for
Member States before 2004 (from 2005) and Member Sates of the 2004 enlargement (from 2007)
Single Farm Payment (SFP)
Policy up to 2007 for Member
States of the 2004 enlargement Single Area Payment Scheme (SAPS)
Key prices
For each modelled commodity, a key price is defined (Table 2.2) as a commodity price at the most important commodity market in the EU. Time series price data for the commodities are used in all country models, particularly for establishing linkages between these system-wide prices and those in each of the countries.
Endogenous data
To the greatest possible extent, partners extract data from Eurostat databases when compiling their commodity supply, use and price datasets. Where necessary, data from national and international agencies are used to supplement the data available from these sources. Each partner checks the commodity datasets assembled so as to ensure that, for all commodity markets and for all sample time period, the following supply and use identity hold exactly:
Methodology of AGMEMOD model
Report III AGMEMOD – Model Description 12
t t
t t
t
t imports beginning stocks domesticuse exports ending stocks
production + + ≡ + +
Where data on the supply and use do not balance, adjustments are made by partners, so as to ensure that the balance held for all commodities and all time periods modelled.
Table 2.2: Commodities and their key markets
Commodity Key market Commodity Key market
Soft wheat France Sunflower seed Rotterdam
Durum wheat Italy Sunflower meal Rotterdam
Barley (feed) France Sunflower oil Rotterdam
Maize (grain) France
Rye Germany Beef Germany
Other grains Germany Pig meat Germany
Rapeseed Hamburg Lamb meat Ireland
Rapeseed cake Hamburg Broiler Germany
Rapeseed oil Netherlands Butter Germany
Soybean Rotterdam Skimmed milk powder Netherlands
Soymeal Rotterdam Cheese France
Soybean oil Netherlands
Under the 5th Framework Programme project an internally consistent and coherent database of annual time series of supply, use and price data relating to the commodities modelled in AGMEMOD, has already been developed. The sample period covers the years 1970 to 2000 for the EU Member States before the 2004 enlargement. However, this period is restricted to the years 1991 to 2000 for the EU members of the 2004 and 2007 enlargements. The political and economic changes that many of the these countries have undergone in the last ten to fifteen years mean that it is often practical, reasonable and meaningful to constrain the data coverage period to relatively recent years. Additionally, statistics in these countries have only recently come under the aegis of Eurostat, so the lack of common definitions and reporting standards in the compilation of historical data is difficult. This is especially the case for more sophisticated statistical requirements, such as the compilation of food balances and the compilation of the Economic Accounts for Agriculture, both of which form the basis of the data for the AGMEMOD modelling approach (Erjavec and Donnellan, 2005).
2.2. Functional form models
The AGMEMOD country models are econometric, dynamic, multi-product, partial equilibrium commodity models. Their commodity coverage prior to this study comprised: markets for grains (soft and durum wheat, barley and maize), oilseeds (rapeseed, soybeans and sunflower seed), meals and oils, livestock and meat (cattle, beef, pigs, pig meat, poultry, sheep and sheep meat) and milk and dairy products (cheese, butter, whole milk powder and skimmed milk powder). The model description of the general functional forms of AGMEMOD is based on Chantreuil, Hanrahan and Levert (2005).
In the two crop sub-models (grains and oilseeds) land allocation is assumed to be determined in a two-step process. In the first stage, producers are expected to allocate their total land area to the culture groups (i ) for grains and oilseeds respectively. Then, in a second stage, the shares of the
land areas allocated to grains and oilseeds are allocated to each culture j belonging to the
corresponding culture group (i ). The total area harvested equations for grains and oilseeds can be
written as
(
p ah V)
f ah j it t i t i, = ,−1, ,−1, j=1,...,n i=1,...,2 (1)Methodology of AGMEMOD model
Report III AGMEMOD – Model Description 13
where ahi,t is the area harvested in year t for culture group i , j t i
p,−1 is the real price in year
1 −
t of culture j belonging to the culture group i , and V is a vector of exogenous variables which could have an impact on the area of culture i harvested (such variables include the set aside rate and the rate of arable aid compensation).
The equations used to determine the share of culture k belonging to culture group i ( k t i sh, ) can be noted as
(
k)
t i j t i k t i f p sh sh, = ,−1, ,−1 j,k =1,...,n (2)The yield equations of culture k in culture group i can be presented as
(
p r V)
f r k t i j t i k t i, = ,−1, ,−1, j,k =1,...,n (3) where k t ir, is the yield per hectare of culture k belonging to the culture group i , and V is a vector of variables, which could have an impact on the yield per hectare of the culture being modelled. In the specification of the AGMEMOD crops sub-models’ supply side income per hectare is not considered in the functional forms. This choice was made in order to distinguish the price and compensation variables as separate effects on the producers’ supply decisions.
On the demand side, crush and feed demand and non-feed use per capita are modelled using the following general functional forms
(
p Z)
f Fu j t i k t i, = , , j,k =1,...,n (4) where k t iFu, is the feed demand for culture k belonging to the culture group i and Z is a vector of endogenous variables, which could have an impact on the demand considered (meat production for example).
(
k)
t i j t i k t i f p NFu NFu, = , , ,−1 j,k =1,...,n (5) where k t iNFu, is the non-feed demand for culture k belonging to the culture group i . Crush
demand for oilseed culture k ( k
t i CR, ) is modelled as
(
h)
t, i l t, i h t, i k t, i f p ,p ,CR CR = −1 −1 −1 h,l =1,...,n (6) where h t ip,−1 is the real price of considered seed oil and l t i
p,−1 is the real price of the seed meal produced as a product of the crushing process.
The stock level, exports and imports equations for the grains and oilseed models, in general, have the following functional forms:
Methodology of AGMEMOD model
Report III AGMEMOD – Model Description 14
(
k)
t i k t i k t i k t i f PR DU St St, = ,, , , ,−1 (7)(
k)
t i k t i k t i k t i f PR DU Ex Ex, = , , , , ,−1 (8)(
k)
t, i k t, i k t, i k t, i f PR ,DU ,Im Im = −1 (9) where k t, i Im , k t i Ex, and k t iSt, are respectively the ending stocks, exports and imports for culture k
belonging to the culture group i in year t , k t i
PR, and k
t i
DU, are the production and the total domestic use of culture k belonging to the culture group i .
The other commodity markets considered in the crops sub-models are the oil and meal markets. The supplies of these markets are determined by oilseeds crushed and by technical coefficients. For all these markets the specification of equations for exports, imports, stocks, oil per capita consumption, industrial demand for oil and meal domestic use are similar to equations (7), (8), and (9). The estimation of these functional forms, allowed for the determination of harvested areas, yields, feed and non-feed uses, ending stocks, exports and imports for the corresponding commodity markets.
Whereas the structure of individual livestock and meat sub-models varies, its general structure is similar and is presented below. Ending numbers of breeding animals can be written as
(
cct p V)
f
ccti,t = i,t−1 i,t, i =1,...,n (10)
where ccti,t is the ending number in year t for the breeding animal type i , pi,t−1 is the real price in year t−1of the animal i considered, and V is a vector of exogenous variables which could have an impact on the ending inventory concerned (such variables are the direct payment linked to the animals concerned or specific national policy instruments).
Numbers of animals produced by the breeding herd inventory can be described as
(
it it)
t
i f cct ypa
spr, = ,−1, , i=1,...,n (11)
where spri,t is the number of animals produced from breeding herd ccti,t in year t and ypai,t is the exogenous yield per breeding animal concerned.
Within each animal culture i there may be mcategories of slaughter j . The number of animals in animal culture i that are slaughtered in slaughter category j can be regarded as
(
cct p z V)
f ktt j t i t i j t i j t i, = , , , , , , i =1,...,n j =1,...,m (12) where j t iktt, is the number of animals slaughtered in category j of animal culture i in year t , j t i
z,
is an endogenous variable that represents the share of different categories of animals slaughtered for the animal culture concerned, and V is a vector of exogenous variables.
The average slaughter weight in animal culture i can be noted as
(
slw z p V)
f slw j it t i t i t i, = ,−1, , , , , i =1,...,n j=1,...,m (13)Methodology of AGMEMOD model
Report III AGMEMOD – Model Description 15
The total meat production from animal culture i is then derived as the product of the average
slaughter weight, multiplied by the total slaughter in that culture, which is defined as
∑
= j j t i t i ktt ktt, , i=1,...,n j =1,...,m (14)The ending stocks of animals (breeding and non-breeding) and meat production are derived using identities. The total domestic use of meats is derived as the product of the per capita demand for the meat concerned, multiplied by an exogenous population variable. The per capita consumption of meat can be written as
(
upc p p gdpc V)
f
upci,t = i,t−1, i,t, k,t, t, k,i= ,...,1 n k ≠i (15) where upci,t is the per capita consumption of meat i in year t , gdpct is the exogenously determined per capita real income and V is a vector of other exogenous variables that affects the per capita meat consumption.
The functional form used to estimate the ending stocks of meats, has the same general form as that used in the estimation of the animal breeding inventories in equation (10). Similarly, the specifications of the trade equations for animals and meats, follow the same general functional form as used in the grain and oilseed models of equations (7) to (9).
Among the AGMEMOD sub-models, the dairy model is arguably the most complicated. A particular feature of the dairy model is its emphasis on the allocation of milk fat and milk protein (rather than just simply milk) to the production of the various dairy commodities modelled. These products are butter, cheese, skimmed milk powder, whole milk powder and ‘other dairy products’. For each dairy commodity modelled, the supply and use is projected as well as the wholesale price.
The AGMEMOD dairy sub-model comprises several components. The first component determines the production, import and export of milk. The second component allocates milk to feed use and to fluid milk consumption. Total milk factory use (manufacturing milk) for further processing into dairy products, is then determined as a balancing item.
The milk yield per cow can be expressed as
(
ypc p qua V)
fypct = t−1, t, t, (16)
where ypct is the yield per cow in year t , pt is the real price of milk, quat is the exogenous milk quota pertaining to the country concerned, and V is a vector of other exogenous variables that could have an impact on the milk yield per cow. Dairy cow ending numbers can be written as
(
ypc p qua V)
fdctt = t, t, t, (17)
where dctt is the ending numbers of dairy cows. The other variables are as defined above. The total milk production is then derived as the product of milk yield per cow and the total ending cow numbers.
Methodology of AGMEMOD model
Report III AGMEMOD – Model Description 16
As noted earlier, the total milk production is allocated to three uses: feed use (ufet), fluid use (uflt), and factory use (ufat). The feed use of milk can be explained as
(
ufe p V)
fufet = t−1, t, (18)
with fluid use, is derived as the product of the population and the per capita fluid milk consumption. The per capita fluid milk consumption equation has the same form as that specified for per capita meat consumption in equation (15). The factory use of milk is derived to balance the supply and use of total milk.
As noted earlier, the AGMEMOD model allocates the fat and protein components of raw milk. The amount of fat and protein in the raw milk produced and used in the manufacturing sector, is first calculated. This calculation involves a number of assumptions concerning the fat and protein content of the raw milk and the fat and protein content of the dairy commodities produced with the manufacturing of milk.
Once the available supplies of milk protein and fat have been calculated, the next step is to allocate the protein and fat components. The milk protein allocated to the dairy commodity i can be described as
(
ppc p p V)
f
ppci,t = i,t−1, i,t, k,t, i,k = ,...,1 n i≠k (19)
where ppci,t is the allocation of protein to the dairy commodity in question, in year t , pi,t is the price of dairy commodity i , and V are exogenous variables that affect the protein allocation to commodity i . The total protein available is allocated to n dairy commodities. The milk protein allocation equations are estimated for n−1 products, with the milk protein allocation to the n th
product derived as a balancing residual allocation.
The production of dairy commodities using milk protein is derived as the total milk protein allocation, divided by an exogenous technical protein content conversion factor. Given these production levels, the allocation of milk fat to these products is derived from fixed technical factors. The allocation of milk fat to butter or other dairy products is written as
(
fpc p p V)
f
fpci,t = i,t−1, i,t, k,t, i,k = ,...,1 n i≠k (20)
where fpci,t is the fat allocation to the dairy commodity i , pi,t is the price of dairy commodity i , and V are exogenous variables that affect the protein allocation to commodity i . Given the allocation of milk fat to other dairy products or to butter, the allocation of the remaining milk fat is derived from the milk fat supply and the milk fat use identity.
To complete the AGMEMOD model , it is necessary to add an equation for each commodity that describes the equilibrium situation at both country and EU level. This condition must imply that the production, plus the beginning stocks, plus the imports equals the domestic use, plus the ending stocks, plus the exports of a commodity. In a closed economy, this supply and use equilibrium condition will be sufficient to determine the equilibrium country market prices endogenously by matching supplies and demands. However, given that the AGMEMOD models do not represent closed economies, the Rest of the World might have important impacts on the
Methodology of AGMEMOD model
Report III AGMEMOD – Model Description 17
economy modelled. To account for such impacts, price linkage equations will be used to capture the relations across Member States on the one hand and on the other hand between the European Union and the Rest of the World. For each commodity, the market of a specific Member State is seen as the key market, while its respective price is considered as the EU key price. In case a commodity’s key market cannot be defined, world prices will directly influence country prices. When the national level market is not considered as the key market in the European Union, the price linkage equations used in the model, can be written as
(
Kp p ssr Kssr V)
f
pj,t = j,t, j,t−1, j,t, j,t, (21)
where pj,t is the national price of commodity j in year t , Kpj,tis the key price of commodity j in year t , ssrj,t is the self-sufficiency ratio (domestic use divided by production) for commodity
j in the country concerned, Kssrj,tis the self sufficiency rate for the same commodity in the key
price market, and V is a vector of exogenous variables which could have an impact on the
national price.
When the national price is the key price, the price linkage equations used in the model can be estimated as
(
Wp EIp Kp Essr V)
f Kpj,t = j,t, j,t, j,t−1, j,t, (22) where j tWp is the corresponding world price, j
t
EIp is the corresponding European intervention price, Essrj,t is the EU self-sufficiency rate for commodity j , and V is a vector of variables which could have an impact on the key price (exchange rates, tariff rate quota levels and subsidised export limits).
2.3. Estimation and validation
With respect to the EU Member States, two different techniques are applied to estimate the parameters of the functional model forms in section 2.2. For members before 2004, the parameters of the specified equations are econometrically estimated, taking account the use of adequate econometric methods. Also, the consistency of the estimation results is regarded with the appropriate theoretical framework and biological constraints. Most of the model equations are individually estimated using the generalized least squares estimation technique. Demand systems are estimated with the seemingly unrelated regression technique, to assure that the estimated parameters are consistent with microeconomic restrictions such as a negative own price elasticity, positive cross price elasticities and a positive income elasticity. The estimated results are validated by standard statistical tests for heteroskedasticity (white heteroskedasticity), autocorrelation (Durbin-Watson) and the goodness of fit. Also, the coincidence of estimation results is compared with, a priori, expectations and economic theory in respect to the magnitude and sign of the estimated parameters. This last mentioned validation test is regarded as superior. Calibration techniques are applied in cases of short data series, data inconsistencies and structural breaks in policy, to determine the equation parameters for many EU members of the 2004 enlargement (Erjavec and Donnellan, 2005). In general, the econometric approach is used to set the initial values for the regression coefficients. The coincidence of these coefficients, with the
Methodology of AGMEMOD model
Report III AGMEMOD – Model Description 18
economic theory, is verified and compared with results obtained from models of Member States before 2004.
Next, baseline projections for the national agricultural sectors are generated based on agreed projections for macro variables, policy variables and key prices. In addition to the standard econometric specification tests, two other validation procedures are applied when analysing the entire model response in the stand-alone mode. First, predictions ‘within-sample’ for the years 1996-2000, test the prediction quality of the entire model and its dynamic properties. As the true values of all exogenous variables for this period is known, model predictions are compared with their actual observations. The Mean Absolute Percentage Error coefficient is applied as a prediction quality measure, while the Mean Percentage Error provides an overall picture of the projection error. Second, country experts validate the model results. Econometric work is needed here by partners, to achieve better solid projections on the country level. Some model equations are re-estimated to incorporate, a priori, the restriction on their values as provided by experts and to minimize the in-sample prediction error.
2.4. Solving the EU model
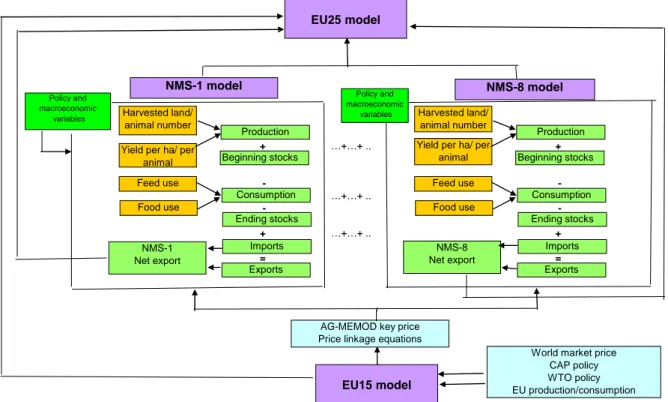
In order to bring together the country models into the EU combined model, it is necessary to convert some variables that are exogenous, at individual country level, into endogenous variables. These variables refer to the self-sufficiency rates and prices for key markets. Neither the AGMEMOD country models nor the EU combined model represent closed economies. Hence, they use key price equations to link country level models and to reflect the Rest of the World impacts on European agricultural sectors. For example, the French key price of soft wheat is exogenous in the stand-alone Irish country model. In the EU combined model, however, the Irish soft wheat price will be modelled as a function of the French key price of soft wheat. In addition, the French key price of soft wheat is endogenously determined as a function of the world market price for wheat, the EU soft wheat intervention price and the EU self-sufficiency rate for wheat.
When solving the EU combined model, just as in the individual country level models, all commodity markets modelled must close to ensure that the supply and use identity for all commodities and all time periods exactly hold. This general condition concerns all versions (EU-15 and EU-25, EU27 levels) of the combined model.
n , , 1 i ; t cct uxt udc cct smt sprti + ti + t−1i ≡ ti + ti + ti ∀ ∀ = K (23) where sprti represents the production, smtti the total import, cctti the ending stock, udctithe total domestic use and uxtti the total export.
In order to ensure this model closure in the EU combined model, it is necessary to choose a closure variable. Within the country level models, the distinction between intra and extra EU imports and exports is not maintained. Nevertheless, for all i =1 K, ,n country models the following identities implicitly hold
i t i t i t EUsmt ROWsmt smt = + (24) i t i t i t EUuxt ROWuxt uxt = + (25) Because
Methodology of AGMEMOD model
Report III AGMEMOD – Model Description 19
t EUsmt EUuxt n i ti n i ti ∀ ≡
∑
∑
= =1 1 (26) The sum of all n countries supply and use identities[
]
0 1 1 ≡ − − − + +∑
= − n i ti ti t i ti ti ti cct uxt udc cct smt spr (27)can be re-expressed as equation (28)
0 1 1 1 1 1 1 1 1 1 ≡ + + + + − − +
∑
∑
∑
∑
∑
∑
∑
∑
= = = = = = = − = n i i t n i ti n i ti n i ti n i ti n i ti n i t i n i ti ROWuxt EUuxt ROWsmt EUsmt cct udc cct spr which is equivalent to[
]
0 1 1 − − + − = +∑
= − tEUt tEU n i i t i t i t it cct udc cct ROWsmt ROWuxt
spr (29) which is equivalent to 0 1 − − − = + t− EUi tEU tEU tEU EU t cct udc cct NETuxt spr (30) where EU t n i ti ROWsmt ROWsmt =
∑
=1 and n tEU i ti ROWuxt ROWuxt =∑
=1 (31) Thus, the European net export variable is used as closure at the European level to ensure that, supply and use identity always hold.EU t EU t EU t ROWuxt ROWsmt NETuxt = − (32) Based on the set of equations in this section, this model allows for projections and simulations at both the EU-15 and the Member State levels, assuming that world prices are exogenous. On the longer term, EU-25 and EU27 combined versions will be developed according to the same approach.
2.5. Projection generation
The AGMEMOD baseline projections are conditioned on the assumed developments in macroeconomic variables, international agricultural market prices and agricultural and trade policy variables. The model provides results under the assumptions of normal weather and stable national and international agreements. The macroeconomic variables are set on the basis of available projections and analysed under these assumptions. Their outlooks come from external sources like Eurostat, DG Economics and Finance or national institutes. World market price projections are linked to the FAPRI projections. Policy assumptions include the current and future developments of instruments under the CAP and GATT-WTO, which reflect the differences in policies applied across EU member states. In this study, the AGMEMOD models of the Member States before the 2004 enlargement are solved as components of the EU-15
Methodology of AGMEMOD model
Report III AGMEMOD – Model Description 20
model. The models of Member States of the 2004 and 2007 enlargements are run in the stand-alone mode. While EU key prices - necessary to derive the national prices – are endogenously generated in the EU-15 combined framework, these remain exogenously in the stand-alone models. The theoretical basis for the last approach is the assumption that international prices are independent of the individual country markets (the 'small country' assumption).