HAL Id: hal-00659469
https://hal.inria.fr/hal-00659469
Submitted on 24 Apr 2012
HAL is a multi-disciplinary open access
archive for the deposit and dissemination of
sci-entific research documents, whether they are
pub-lished or not. The documents may come from
teaching and research institutions in France or
L’archive ouverte pluridisciplinaire HAL, est
destinée au dépôt et à la diffusion de documents
scientifiques de niveau recherche, publiés ou non,
émanant des établissements d’enseignement et de
recherche français ou étrangers, des laboratoires
Petra Isenberg, Sheelagh Carpendale, Tobias Hesselmann, Tobias Isenberg,
Bongshin Lee
To cite this version:
Petra Isenberg, Sheelagh Carpendale, Tobias Hesselmann, Tobias Isenberg, Bongshin Lee. Proceedings
of the Workshop on Data Exploration for Interactive Surfaces-DEXIS 2011. [Research Report] 2012.
�hal-00659469�
0249-6399 ISRN INRIA/RR--0421--FR+ENG
RESEARCH
REPORT
N° 0421
Workshop on Data
Exploration for
Interactive Surfaces
DEXIS 2011
Petra Isenberg, Sheelagh Carpendale, Tobias Hesselmann, Tobias
Isenberg, Bongshin Lee (editors)
RESEARCH CENTRE SACLAY – ÎLE-DE-FRANCE
Petra Isenberg
*, Sheelagh Carpendale
†, Tobias Hesselmann
‡,
Tobias Isenberg
§, Bongshin Lee
¶(editors)
Research Report n° 0421 — May 2012 — 47 pages
Abstract: By design, interactive tabletops and surfaces provide numerous opportunities for data visu-alization and analysis. In information visuvisu-alization, scientific visuvisu-alization, and visual analytics, useful insights primarily emerge from interactive data exploration. Nevertheless, interaction research in these domains has largely focused on mouse-based interactions in the past, with little research on how interac-tive data exploration can benefit from interacinterac-tive surfaces. These proceedings represent the results of the DEXIS 2011 Workshop on Data Exploration for Interactive Surfaces. It was held in conjunction with the ACM International Conference on Tabletops and Interactive Surfaces (ITS) in Kobe, Japan on November 13, 2011. The introduction summarizes the published papers of the workshop and points to results from workshop discussions. The remainder of the proceedings is made up of the position papers submitted to the workshop.
Key-words: interactive tabletops and surfaces, visualization, data exploration
*[email protected] †[email protected] ‡[email protected] §[email protected] ¶[email protected]
faces interactives. Ce rapport de recherche comprend les r´esultats du DEXIS 2011, un atelier de travail portant sur l’exploration de donn´ees avec des surfaces interactives. Il a ´et´e tenu en conjonction avec la Conf´erence Internationale de l’ACM sur Tabletops and Interactive Surfaces (ITS) `a Kobe, au Japon le 13 Novembre 2011. L’introduction r´esume les articles publi´es dans cet atelier de travail et les r´esultats de nos discussions. Le reste du rapport se compose des articles pr´esent´es `a l’atelier.
1 Preface by the Organizers 4 2 Interstitial Space in MDEs for Data Analysis (Anthony Tang and Pourang Irani) 9 3 Position Paper: Design and Evaluation of Visual Learning and Data Exploration
Applica-tions in Multiple-Surface Environments (Chia Shen) 12 4 GeoLens: Multi-User Interaction with Rich Geographic Information (Ulrich von Zadow,
Florian Daiber, Johannes Sch¨oning, and Antonio Kr¨uger) 16 5 Interactive Multitouch Surfaces for Software Visualization (Craig Anslow, Stuart Marshall,
James Noble, and Robert Biddle) 20
6 Position Paper: Touch Interaction in Scientific Visualization (Tobias Isenberg) 24 7 Mobile Interactive Displays for Medical Visualization (Steven Birr, Raimund Dachselt, and
Bernhard Preim) 28
8 Branch-Explore-Merge: Real-time Revision Control for Conflict Resolution in Collabora-tive Visual Exploration (Will McGrath, Brian Bowman, Niklas Elmqvist, and Pourang Irani) 32 9 CoSpaces: Workspaces to Support Co-located Collaborative Visual Analytics (Narges
Mah-yar, Ali Sarvghad, Tyler Weeres, and Melanie Tory) 36 10 Multitouch Magic Fisheye: Precise Interaction with Dense Data on Tabletop (Fr´ed´eric Vernier
and Chia Shen) 40
11 Towards Utilizing Novel Interactive Displays for Information Visualization (Christian Tomin-ski, Heidrun Schumann, Martin Spindler, and Raimund Dachselt) 44
By design, interactive tabletops and surfaces (ITS) provide numerous opportunities for data visualization and analysis. In information visualization, scientific visualization, and visual analytics, useful insights primarily emerge from an interactive data exploration. Nevertheless, interaction research in these domains has largely focused on mouse-based interactions in the past, with little research on how interactive data exploration can benefit from interactive surfaces. We assert five apparent benefits of interactive surfaces for visualization systems:
1. As interactive surfaces become part of our everyday environments, they provide new ubiquitous data analysis platforms in which data can be accessed and analyzed anywhere and at any time (e. g., on mobile phones and tablets, in meeting rooms, or on public surfaces);
2. Interactive surfaces offer research opportunities on novel interaction paradigms that can improve data exploration experiences or encourage alternative forms of data exploration;
3. Novel visualization designs and interactions promote the use of visualizations for a broad range of people;
4. In particular, large interactive surfaces offer the possibility of depicting and interacting with much larger visualization spaces than possible previously; and
5. As data analysis is increasingly turning into a collaborative process, interactive surfaces offer novel research possibilities on dedicated collaborative visualization platforms.
While the combination of interactive surface technology and visualization research promises rich bene-fits, much remains to be learned about the effects of supporting a visual data exploration on interactive surfaces. For instance, we need to learn more about (a) how to re-design desktop- and mouse-based sys-tems for alternative forms of input, (b) what motivates people to explore data using novel vs. traditional interfaces, and (c) how novel input modalities change the ability of people to understand data and draw in-sights from it. In addition, interactive surfaces often come in the forms of larger or screens, more screens, higher resolutions, sometimes less accurate inputs, and multiple simultaneous inputs, all of which create additional challenges for visualization designers.
At DEXIS 2011, we brought together researchers and practitioners from scientific visualization (VIS), information visualization (InfoVis), visual analytics (VAST), and human-computer-interaction (HCI) to discuss and shape the field of visualization and analysis on interactive surfaces. We discussed ongoing research, exchanged experiences about challenges and best practices, identified open research questions, and developed a research agenda. In these proceedings we collate the knowledge gathered during and after the workshop in order to contribute to the future research in the field.
1.1 Workshop Outline
We organized discussions at DEXIS along three main topics: Data Analysis Environments, Data-Specific Challenges, and Interaction Techniques. The authors of each paper were asked to set their work in relation to the topics in a brief position statement. After these presentations, we discussed the topic in break-out groups and then summarized the discussion in the plenary. We outline the topics we discussed according to the papers presented in the corresponding session.
1.2.1 Topic 1: Data Analysis Environments Chair: Tobias Isenberg
The first workshop session was dedicated to the role of the data analysis environment and its influence on the configuration of visualizations and ITS systems. In particular, we focused on the challenges that arise from the specific data analysis environments, insights on how these environments should be designed for interactive surfaces, and experiences with ITS in different types of environments (e. g., work settings and exhibitions). The following papers were discussed in this session:
1. Anthony Tang and Pourang Irani.
Interstitial Space in MDEs for Data Analysis (page 9). 2. Chia Shen.
Position Paper: Design and Evaluation of Visual Learning and Data Exploration Applications in Multiple-Surface Environments (page 12).
3. Ulrich von Zadow, Florian Daiber, Johannes Sch¨oning, and Antonio Kr¨uger. GeoLens: Multi-User Interaction with Rich Geographic Information (page 16).
In the discussions following these papers we identified a number of challenges for research at the inter-section of ITS and visualization. Social aspects characterize the first group of challenges. These include different types of users and their domain-specific tasks, interactions, and visualization requirements as well as different types of collaboration settings. These challenges had been specifically mentioned in the presented papers. Tang and Irani discussed challenges of surface connectivity and how the space be-tween surfaces could be used to help people make a transition of data and results bebe-tween collaborative and individual work (tasks) as well as between different types of devices. Shen discussed several design guidelines as well as evaluation measures for data analysis environments with a strong social focus on collaboration, engagement, and cognition. The GeoLens interaction techniques presented by von Zadow et al. were observed in use by over 150 visitors of an interactive science exhibition in Germany. The observations point to interesting challenges designing data exploration tools for walk-up-and-use scenar-ios. We further discussed hardware challenges that strongly influence data analysis. These begin with the physicality of the surface itself, its affordances, and the type of fluidity and interaction modalities it supports but also include finding the right location for an interactive surface.
Both social and hardware challenges of data analysis environments together point to the problem that one needs to design these spaces to be highly personalizable and adjustable to different needs. These needs may depend on a variety of factors and research needs to gain a better understanding of these individual needs and how they can be transformed into more generalizable design considerations for data analysis environments.
1.2.2 Topic 2: Data-Specific Challenges Chair: Tobias Hesselmann
In this session we discussed issues related to specific types of data (e. g., software structure, medical data) and their influence on the design of visualization on interactive surfaces. The session consisted of the following papers:
Interactive Multi-touch Surfaces for Software Visualization (page 20). 2. Tobias Isenberg.
Position Paper: Touch Interaction in Scientific Visualization (page 24). 3. Steven Birr, Raimund Dachselt, and Bernhard Preim.
Mobile Interactive Displays for Medical Visualization (page 28).
The three papers discussed different aspects of the session topic. Anslow et al. presented their challenges in moving from single-user desktop-based software visualizations to collaborative tabletop visualization tools for software development. These included those of synchronizing different representation types and providing dedicated tabletop navigation techniques in the data space. Isenberg discussed interaction challenges for-typically three-dimensional-scientific visualizations. He pointed to specific underexplored future research directions including the development of 3D interaction toolkits, better support for pre-cise exploration control, the interaction with stereoscopic displays, and the interaction with 3D data in collaboration. Birr et al. presented several challenges and ideas for introducing mobile surfaces in med-ical environments. The presented techniques were put in close context of the medmed-ical domain and its requirements among which the most important ones were scalability and platform independence as well as interaction and communication.
The discussions following these papers were centered on unanswered questions about designing data interactions and data representations for interactive surfaces. These included: How do we need to redesign visualizations and data exploration tools for collaboration? How specifically do we have to augment data representations for collaboration? What are data-specific interaction challenges, for example, 2D vs. 3D vs. text-data, etc.? How can solutions from a particular domain be generalized or transferred to another domain?
1.2.3 Topic 3: Interaction Techniques Chair: Bongshin Lee
The last session focused on issues related to the interaction with visualizations on interactive surfaces. We examined the role of interaction in ITS vs. Desktop PC computing, and discussed the validity of interactions across different devices and types of data. The following papers were presented:
1. Will McGrath, Brian Bowman, Niklas Elmqvist, and Pourang Irani.
Branch-Explore-Merge: Real-time Revision Control for Conflict Resolution in Collaborative Vi-sual Exploration (page 32).
2. Narges Mahyar, Ali Sarvghad, Tyler Weeres, and Melanie Tory.
CoSpaces: Workspaces to Support Co-located Collaborative Visual Analytics (page 36). 3. Fr´ed´eric Vernier and Chia Shen.
Multitouch Magic Fisheye: Precise Interaction with Dense Data on Tabletop (page 40). 4. Christian Tominski, Heidrun Schumann, Martin Spindler, and Raimund Dachselt.
Towards Utilizing Novel Interactive Displays for Information Visualization (page 44).
McGrath et al. discussed the challenge of allowing parallel and diverging interaction and revision control for collaborative data analysis tools. They also discussed social challenges of public and private views during collaboration and how they can be brought into context. Similarly, Mahyar et al. discussed interac-tion challenges in the social context of collaborainterac-tion. Their system, CoSpaces, uses tab-based portals for
cific interaction technique, the multitouch magic fisheye that showed some of the possibilities of utilizing multiple fingers for controlling data exploration interactions for interactive surfaces. Finally, Tominski et al. discussed three gaps in our current research at a higher level. These include technology, integration, and guidelines gaps and point to challenges that still need to be addressed as we develop visualization systems for interactive surfaces. In the plenary discussions we concentrated on the following questions:
• How does touch interaction fundamentally differ from mouse settings and how does the new input modality impact visualization?
• How can we encourage collaboration through interaction?
• Can we develop a general data exploration interaction vocabulary?
• What are special requirements when display space and interaction space overlap?
1.3 Future Research Directions
The workshop ended with a brainstorming session on future research directions and challenges. We identified 10 main topics which require further attention:
1. Multi-display environments: Mlti-device interaction, multi-device integration, surface ecologies for data analysis, etc.
2. Collaboration: Supporting different collaboration styles, transitioning between styles, merging group work, etc.
3. Interaction techniques: Develop a vocabulary of touch interaction for data exploration, support different touch proficiency, improve touch literacy, support touch with different data types, and develop gestures for data exploration.
4. Representations: Understand how visual encoding needs to change depending on screen size and input modality and what is the role of perception?
5. Evaluation: Develop dedicated study methodologies for understanding the role of touch for data exploration, understand how to measure efficiency and effectiveness of interaction in data explo-ration, etc.
6. Multi-modality: How can we enhance data exploration with input modalities other than touch? 7. Privacy: How can we support exploration of private data and what are privacy sensitive actions in
data exploration?
8. Role of surface type for data analysis: Understand what different types of surfaces and surface settings are most suited for and what are the most suited tasks, data types, representations, and interactions for different devices?
9. Guidelines: Can we find generalizable guidelines or design considerations for data analysis envi-ronments on interactive surfaces?
10. Promote the research direction: We need to more strongly promote the value of research on interac-tion in novel environments, we need to get a cross-disciplinary dialog started between communities on the topic, and we need to design and deploy more systems that promote and demonstrate the value of interactive surfaces for data analysis.
We would like to thank the participants of DEXIS 2011 for their excellent contributions and lively discus-sions. The exchange showed that data exploration on interactive surfaces is an exciting area of research that offers great potential.
Petra Isenberg, Sheelagh Carpendale, Tobias Hesselmann, Tobias Isenberg, Bongshin Lee DEXIS 2011 Organizers
1.5 Copyright Notice
The copyright for all of the following papers including all material presented therein is retained by the respective authors of the workshop papers.
Interstitial Space in MDEs for Data Analysis
Anthony Tang
Department of Computer Science
University of Calgary
[email protected]
Pourang Irani
Department of Computer Science
University of Manitoba
[email protected]
ABSTRACTMulti-display environments comprise large shared displays as well as personal devices. In this work, we discuss how the interstitial space—the space between displays and de-vices—can also be made into an interactive space. Such a space can support collaborative data analysis by providing a focus+context workspace; providing a means to transition between collaborative and individual work, and by provid-ing a means to transition tasks between devices.
INTRODUCTION
Multi-display environments are rich digital workrooms comprising wall-displays, tabletop displays and personal devices. These display ecologies represent great opportuni-ties for collaborative data analysis: shared displays can faci-litate group tasks, while personal devices can support inde-pendent tasks. Figure 1 illustrates an imaginary digital wor-kroom with the typical large, high-resolution, interactive displays to which the research community has devoted much of its recent efforts. It also shows two spaces, the interstitial space (the space between displays) that we argue represents an interesting design opportunity for the commu-nity. While considerable effort has gone into designing inte-raction techniques and visualizations for what we typically consider as “interactive large displays,” very little work has considered the interstitial space in these rooms, and in par-ticular, the role that the space between the displays can play. In this position paper, we consider how this space can be used to support collaborative data exploration and analy-sis, and present several design factors for interstitial spaces that we seek to explore.
For explanatory purposes only, we describe here an imagi-nary instantiation of such spaces in a digital workroom. Interstitial space is comprised of surface space between displays. In this imaginary scenario, this interstitial space is made visible through a low-resolution projection onto both the walls and the ground in this digital workroom. These projected surfaces are not touch-interactive; instead, people interact with it by using their mobile devices as a proxy. If on the floor, users can interact with such spaces with their feet or through shadows. We can already see that concep-tually, the MDE becomes a Focus+Context environment, where the interactive displays are the Focus, while the in-terstitial space provides Context. Yet, how can this space be leveraged to support the collaborative analysis process? Let us further examine the collaborative visual analysis process.
SUPPORTING COLLABORATIVE ANALYSIS
We outline three ways in which interstitial space might support collaborative analysis in MDEs. First, it may sup-port specific “tasks” or “sub-processes” in a collaborative visual analysis process. Second, it might support transitions between shared and independent work. Third, it could be used to support transitions between different device types. To begin, we focus on Isenberg and colleagues‟ work on the visual analysis process (2008). Here, the authors out-lined several processes that individuals in a group engage in when analyzing visual data together: Browse, Parse, Dis-cussion Collaboration Style, Establish Task Strategy, Clari-fy, Select, Operate, and Validate. Several of these processes intuitively map to how interstitial space could be used. Dur-ing the “Browse” process, for example, people look through the data, implicitly sorting it into several piles based on how they might expect to use the data. Interstitial space could be used here for groups of items that may not seem as important (i.e. saving valuable “interaction” space). In so doing, it can also support a faster “Select” process, as items can remain visible without having to be “piled” into groups. Another common design requirement arising out of studies of collaboration is to support fluid transitions between shared and independent tasks (i.e. collaborative work and independent work). Interstitial space can support this transi-tion by providing a visible storage or transport medium for different workspaces. Moving different workspaces across
Figure 1. (1) and (2) are typical large shared displays in an MDE. (3) the wall, and (4) the ground are interstitial spaces that can be used to support auxiliary tasks or work as a scratch-pad for collaborative data analysis.
to different displays through the interstitial space supports collaborators‟ awareness of what is happening in the work-space, and how work and tasks are being divided among individuals and sub-groups. For example, if data is to be examined by a sub-group or an individual, the interstitial space can be used as temporary “ether”, a “scratch-pad” or as a space where content is placed temporarily for these or other individuals to retrieve at a later time. We hypothesize that allowing users to off-load their internal “scratch-pads” onto interstitial space will facilitate analysis on only core components to the task.
Finally, because devices and displays in MDEs are physi-cally (and visually) detached from one another, interstitial space can actually function as a visual bridge between the devices. It can be used for visualizing the movement of content or information across devices and displays in such an ecology.
DESIGN FACTORS FOR INTERSTITIAL SPACES IN MDES
In these early stages, we have considered several factors that influence the design of interstitial space—factors that influence how it is realized, how it is interacted with, and the affordances it provides.
Conceptual model: transient vs. ambient. Prior work that
has considered this interstitial space (Xiao et al., 2011) has primarily viewed this space for transient interaction. That is, content in this space is only intended to be here for a short period of time. This relates to our concept of it as being a visual transport medium for content—something like a “clipboard” for the MDE. It can also be leveraged to support collaborator awareness of our interactions in the workspace (e.g. Shoemaker et al., 2006). Yet, we can also consider it as a low-resolution ambient space that either: (a) exposes functionality to manipulate the high-resolution in-teractive space (e.g. controls for visualizations could be placed in interstitial space to save room from the actual workspace), (b) provides low-resolutions visualizations that react to the interactions taking place on the shared displays.
Organization: semantic vs. spatial. One thing to consider is
how content is to be organized in interstitial space: will it be organized semantically, or spatially. Recently, research-ers have considered reinventing the interface to exploit us-ers‟ spatial memory, through semantic association of inter-face components with spatial layout. Interstitial space pro-vides a larger repository that can further enable more asso-ciations. However, separating the organization either se-mantically or spatially can be left to designers based on the affordances they wish to embed.
Objects: dynamic vs. static. How should content in
intersti-tial space appear?
Content: artefacts that relate to work / artefacts that relate to the people in the MDE. To this point, we have mainly
considered that artefacts in interstitial space would be data elements related to the analysis. An alternative
conceptuali-zation of this would be to place content as it relates to indi-viduals in the interstitial space in such a way that it tracks or follows individuals. This content could relate to their independent tasks, or be tools that relate to those individu-als. Having this information track and follow along with an individual would provide easy access to it.
BASIC TASKS WITH INTERSTITIAL SPACE
There are some basic tasks that people will need to accom-plish with interstitial space: placing and retrieving content from interstitial space, querying data in this space and mak-ing the results visible, decidmak-ing how to eliminate or erase content from this space. While these problems have re-ceived less consideration, several basic mobile device inte-raction techniques could be used to facilitate these tasks. For example, a mobile device could act as a peephole for shared displays (as in Boring et al., 2010). Users can simply „scan‟ interstitial space with their mobile device to make „invisible‟ content appear on it. Other mechanisms might include displaying interstial content in a minimalistic ways, using methods of world-in-minature (e.g. Biehl & Bailey, 2006), or even with mechanisms that provide accurate cues to off-screen content (e.g. Gustafson et al., 2008).
Yet, we envision that designing appropriate interaction techniques will rely on an understanding of how these spac-es will be used in domains such as collaborative analysis. One method for developing this understanding is to study how the interstitial space is organized (i.e. study how people organize content within the space); second, to de-velop methods to provide people representations of this organization and content, and then finally to use this under-standing to iteratively design interaction techniques.
A CASE FOR IMPROVED ANALYSIS
Our primary argument infers that interstitial space will augment traditional methods of analysis and data inquiry. We elaborate on this aspect by walking through a simple case.
Let‟s consider a group of two analysts (for simplicity) in-quiring into a recent case of a hit-and-run incident in a city. The police inform them that potential witnesses implied that a cab driver was involved and provide the analysts with GPS data from that cab‟s company, based on the time inter-val of the incident. The analysts now have to prod the pro-vided data to assist the police in determining the suspect.
Effect of interstitial space on on-the-fly queries. As
sug-gested earlier, instead of employing object piles, analysts can off-load immediately unnecessary content into intersti-tial space. For example, the analysts may „store‟ multiple forms of space-time views of the data and instead of having it clutter the usable space can have it placed on the „side lines.‟ A view showing all cab movements (from the GPS) can be placed into this space, while the analysts explore city wide camera recordings. On demand, the analysts may query the route data, which can then be presented onto the primary display for analysis. Based on our hypothesis that
such space can better facilitate semantic-spatial associa-tions, retrieving objects of interest on demand will be high-ly efficient. We plan on studying the effectiveness of such forms of object placement/retrieval methods in comparison to more traditional methods for analytic outcomes.
Attributing relevance. In the analysis process, some
infor-mation is more relevant than other. To avoid completely erasing that knowledge (as it may have taken the analysts some time to produce it), organization in interstitial space can attribute relevance to the derived information. For ex-ample, if the analysts have now attributed the incident on a handful of cab drivers, the history information in how these were obtained and the relevance associated to each item in history can be organized in IS space for later presentation. Such forms of history tracking typically require large trees or lists, which can be avoided if properly partitioned in this additional space.
Linking between alternative forms of analysis. Another
feature of interstitial space that we leverage for this analytic task could be for linking between various steps taken by the two analysts. Analysts may at times be working separately on the same source of data and such spaces can provide a common ground among their individual approaches. For example, both analysts may have refined their inquiry such that only one piece of the information may be left to solve the problem. Data from interstitial space could be fused, by auxiliary routines (metaphorically that run in the back-ground) to suggest a refined solution. By removing the back-and-forth comparisons away from their primary dis-plays, analysts may be able to find better solutions to their problem.
CONCLUSIONS
We are in the early days of exploring the design space of multi-display environments. Whereas most researchers have focused their efforts (rightfully so) on the main interactive shared displays in these spaces, our focus in this position paper is to consider how the low-resolution interstitial space can be used to support collaboration. We have dis-cussed how an interstitial space might be used to support analysis, as well as described a set of design factors that can guide exploration into this space.
REFERENCES
1. Biehl, J.T., and Bailey, B.P. 2006. Improving interfac-es for managing applications in multiple-device envi-ronments. In Proc AVI ’06, 35-42.
2. Boring, S., Baur, D., Butz, A., Gustafson, S., and Bau-disch, P. 2010. Touch projector: mobile interaction through video. In Proc CHI ’10, 2287-2296.
3. Gustafson, S., Baudisch, P., Gutwin, C., and Irani, P. 2008. Wedge: clutter-free visualization of off-screen locations. In Proc CHI ’08, 787-796.
4. Isenberg, P., Tang, A., and Carpendale, S. 2008. An exploratory study of visual information analysis. In
Proc CHI ’08, 1217-1226.
5. Shoemaker, G., Tang, A., and Booth, K.S. 2007. Sha-dow reaching: a new perspective on interaction for large displays. In Proc UIST ’07, 53-56.
6. Xiao, R.B., Nacenta, M.A., Mandryk, R.L., Cockburn, A., Gutwin, C. 2011. Ubiquitous Cursor: A Compari-son of Direct and Indirect Pointing Feedback in Multi-Display Environments. In Proc GI ’11, 135-142.
POSITION PAPER
Design and Evaluation of Visual Learning and Data
Explo-ration Applications in Multiple-Surface Environments
Chia Shen
School of Engineering and Applied Sciences
Harvard University
[email protected]
ABSTRACTIn this position paper, I will describe a set of interactive visual prototype systems that have been developed in an interactive environment with a multi-touch tabletop and a large display data wall. I will summarize findings from our initial pilot studies of these experimental systems, offer design guidelines, and then propose a set of evaluation criteria to the interactive tabletops and surface research community.
ACM Classification: H5.2 [Information interfaces and presentation]: User Interfaces.- Graphical user interfaces.
General terms: Design, Human Factors
Keywords: Multi-touch, Visualization
INTRODUCTION
What makes an interactive surface better suited for a par-ticular data visualization application than other form fac-tors? Another way to ask this question is “How can a par-ticular visual data exploration application benefit from the potentially higher cost of being developed on one or mul-tiple interactive surfaces?”. This cost can be in the form of the actual price of the display device, in the form of devel-opment cost as touch input and multi-user applications re-quire non-standard interfaces, or in the form of user cost such as learning to interact with non-standard UI as well as the possibility of enduring multi-user interference.
In the past few years, we have been addressing the above questions by continuously investigating the design and development of a variety of visual data exploration systems on a heterogeneous multiple interactive surface environ-ment. In this position paper, I summarize our experience, findings, and propose three measurement criteria as evalua-tion metrics for visual data exploraevalua-tions.
The types of visual data that we have studied include: Scientific data from multiple independent source Coordinated data with multiple representations Simulation data
Animation and video 2D and 3D visualization Large public scientific databases
In the following, I will briefly describe each of the multi-surface data exploration prototypes and identify the key findings that will help us to formulate design guidelines and evaluation metrics.
FOUR MULTIPLE SURFACE DATA EXPLORATION AND ANALYSIS PROTOTYPES
Cthru
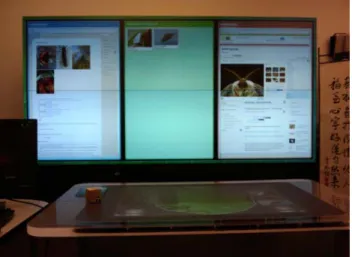
CThru [3] is a video-centered information space for self-guided learning. In CThru, core multimedia education con-tents of different formats are used to construct a cross-referenced information space running along with the main video, conveying a variety of domain specific knowledge and information. Users watching the video can freely jump to or out of the information space for in-depth knowledge, thus a sequential video playback is replaced by the expe-rience of immersing and exploring in a multi-dimensional space. CThru runs in a multi-display environment with a large display wall and an interactive tabletop (Figure 1).
Copyright is held by the author.
DEXIS 2011 Workshop on Visual Data Exploration on Interactive Surfac-es. Workshop in conjunction with ACM ITS 2011, Kobe, Japan. November 13, 2011.
Figure 1: CThru, an interactive video, 2D and 3D system for learning the inner life of a cell. (Repro-duced from Figure 1 in Jiang et al CHI2009.)
During our evaluation of CThru, one interesting issue arose during the interaction – the unequal distribution of user attention between the wall and tabletop. Our observation showed that the users' visual foci stayed on the tabletop most of time, even though the data wall provides three times as much resolution as the tabletop and is much larger. Most users only shifted their foci to the wall when reading text.
INVOLV
INVOLV [1] allows users to explore and navigate over one million species of life on earth catalogued in the Encyclo-pedia of Life (www.eol.org) database using a voronoi tree map interface on a multi-touch tabletop, in conjunction with a data wall (Figure 2). On the multi-touch table, users can use the treemap to browse and navigate to each group of species, while on the datawall, the associated webpages from www.eol.org and www.tolweb.org on the current species are opened and displayed.
Given the findings from CThru, we added a pair of ‘audio’ and animation cues to bring users’ attention to the data wall. Whenever a user’s interaction on the tabletop goes to a new family of species, a pair of animated visual “nug-gets” will flow from the table to the two webpage windows on the datawall. This multi-modal sound and animation sequence have brought users’ attention across the display space between the table and the display datawall.
Figure 2: INVOLV, a voronoi treemap based system for exploring the www.eol.org database. (Horn et al ISVD2009.)
WALDEN
The WALDEN simulation [5] shown in Figure 3 seeks to model changes in abundance of a selected group of plants found in Concord Massachusetts, as a response to climate change and human intervention in the local ecosystem. On the multi-touch table, a user is able to manipulate the aver-age and the standard deviation of annual temperatures and watch the effects of this simulated climate change on the set of flowering plants on the datawall. A user can in addi-tion select a particular plant on the tabletop to see the
geo-graphic distribution and illustrations of this plant on the datawall.
Our case study reveals that cognitive overload occurs when individuals encounter a large amount of information on separate displays, while pairs of users may benefit from collaborative learning in such a setting.
From our observations of both individual and pairs of us-ers, having a large amount of display area is a double-edged sword on a cognitive level: visualizations are not limited by space, but individuals find the amount of infor-mation overwhelming. They complained that there was “too many things to look at” or ignored a graph containing important information. Dyads, on the other hands, used the amount of information as a way to make unique contribu-tions to their conceptual understanding of a domain. They used the multiple views from the simulation as a way to propose different perspective on phylogenetics and con-front their hypotheses with the results displayed.
Figure 6 provides a more detailed view of two sessions, one individual session and the other a dyad session: every 10 seconds is coded according to the quality of the com-ments made by the users. A score of 0 means silence or off-task behavior while 5 reflects a conceptual understanding of the system. From this graph we can observe that the in-dividual abundantly commented the interface but almost never went beyond making simple observations. The dyad, on the other hand, produced richer and more varied com-ments. For instance, they made more complex hypotheses by considering branches of the phylogenetic tree. This al-lowed them to make finer distinction in terms of phyloge-netic relationships (e.g. “this common ancestor seems to be responsible for the decrease in abundance”). They also questioned the structure of the tree (e.g. "is the length of a
Figure 3: WALDEN, a dynamic simulation modelling changes in abundance of a select group of flower-ing plants found in Condord, Massachusettes in re-sponse of climate change. (Reproduced from Figure 1 in Schneider et al 2011.)
branch significant?", "are some part of the tree hidden/not displayed?", "if species are in a close spatial proximity on the radial tree, are they really more closely related?"), whe-reas the individual did not. More importantly, members of the dyad made more hypotheses and confronted their pre-dications more often than the single user.
WESPACE
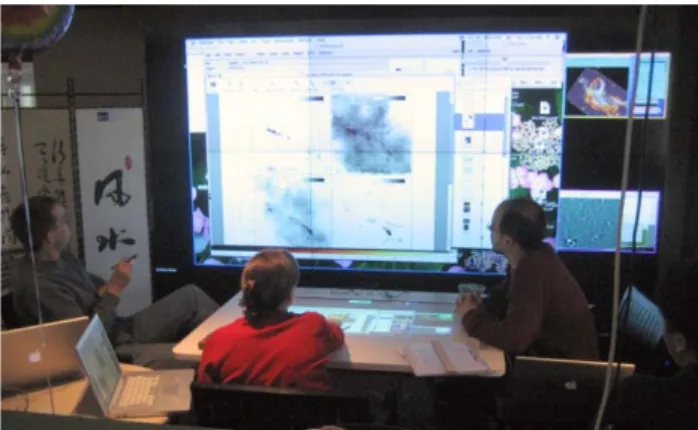
The WeSpace [8] is a multi-surface collaboration space. It is a general-use tool for workplaces in which simultaneous visual exploration rendered from multiple data sources by multiple people is a crucial part of the work-flow process. WeSpace is the outcome of close collaboration between our research team and a population of scientists – astrophy-sicists from the Harvard Smithsonian Center for Astrophys-ics (the CfA). It is designed to enable modern day-to-day spontaneous collaborative sessions that are mediated and augmented with computational display devices.
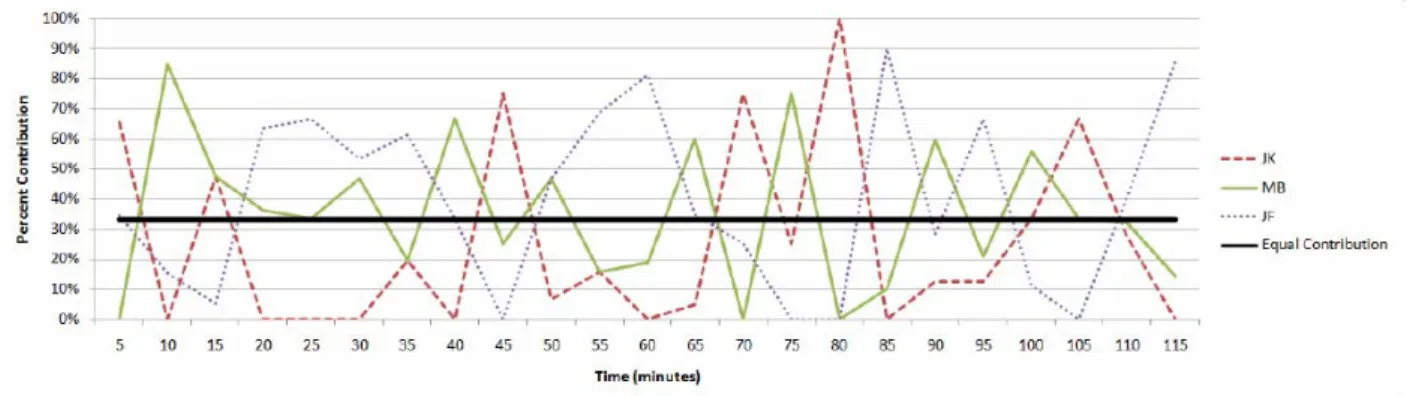
During our observation sessions in which three scientists carried out working meetings examining different types of telescopic data, we recorded inputs on the multi-touch table from all users. While the distribution of input was fairly equal when the meeting was viewed as a whole, a different story emerged when we examined input from each of the three users over time. Figure 5 shows the relative number of input events performed by each of the three users for each 5 minute time period. While the overall distribution of input was relatively even, the distribution during the 5 minute samples was not. The logs suggest that the control of the system passed from user to user at different times during the meeting as the participants took turns directing the conversation. While the majority of input was normally made by one participant, it was rare to see any one user monopolizing the table. These patterns match our observa-tions of the meeting that the scientists took turns introduc-ing new data and hypotheses, with their colleagues reactintroduc-ing to these additions.
GUIDELINES AND EVAUATION METRICS
In this section, I will summarize the findings from our own experience and evaluation outcomes from our past and cur-rent research systems into design guidelines. I will then propose a set of three measures that can be used as evalua-tion metrics for these multiple surface interactive visual data exploration applications.
Design Guidelines
1. “Let there be sound and motion”: Non speech cues and motion for visual foci shift are useful de-sign tools. It is well-known in the visual dede-sign arena that motion is a good visibility enhancement and can be used effectively for directing a view-er’s orienting response [7]. Vision (high resolution acuity but a small of area of a window) and hear-ing (3D surround but low resolution) are interde-pendent and work well together [2]. In a multiple surface environment where some display surfaces are out of the immediate visual field of the user,
utilizing a combination of sound and animation cues should be considered.
2. “Let there be collaboration”: The large visual space lends well to collaboration. Two or more people seem to gain better cognitively a multi-surface environment for learning, exploration and analysis. In choosing the types of visual data ex-ploration applications, we should take this into consideration.
3. “Let there be equal input”: In order to allow people to collaborate, we need to provide mechan-isms for each user to conveniently direct her per-sonal input. This may include inputting data, redi-recting attention, and exploring and navigating shared visualization.
4. “Engage them!”: We have also observed that in-teractive surfaces may offer higher levels of en-gagement from the users. To attract and engage the users deeply into the visual representation is an important criterion.
Evaluation Measures
Here I list three levels of evaluation measures that we have found effective and useful:
1. Cooperation metric: Can the interactive visual de-sign support two or more people work and play together? How fluid can people input, converse through visualization, and explore without interfe-rence? This can be measured using the collabora-tion profile developed by Shaer et al in [6]. 2. Engagement metric: Does the system engage its
users? This can be measure through a few differ-ent ways, such as self-reporting as in [4], or in comparison to other systems or other form factors. 3. Cognitive metric: Does the design meet the goals of the application? If the application domain is education, how well do the learners achieve the projected learning gains? If the application
do-Figure 4: WeSpace, a systems that allows astro-physicists to dynamically interactive with their own data from individuals’ laptops on a multi-touch table-top and a large datawall. (Reproduced from Figure 1 in Wigdor et al 2009.)
main is science discovery, does the system allow scientists to effectively make inferences and pre-dictions? If the application domain is visual ana-lytics, does the system enable the users to arrive at analytical insights?
CONCLUSION
As interactive surfaces become more and more prevalent, we need to develop well-studied design guidelines and have a formal set of evaluation measures that can be shared within the research and design community. In this position paper, I have described our past and ongoing work in de-signing and developing multiple-surface interactive visual data exploration systems. I have also proposed a set of ini-tial design guidelines and evaluation measures.
REFERENCES
1. Horn, M.S., Tobiasz, M., Shen, C., Visualizing Biodi-versity with Voronoi Treemaps, Proceedings of Sixth
annual International Symposium on Voronoi Diagrams in Science and Engineering, Copenhagen, Denmark.
June 23 - 26, 2009.
2. Jacko, J., The Human-Computer Interaction Handbook: fundamentals, evolving technologies, and emerging ap-plications. CRC Press, 2008. ISBN-10: 0805858709
3. Jiang, H., Viel, A., Bajaj M., Lue R.A. and Shen C., CThru: Exploration in a Video-Centered Information Space for Educational Purposes. Proceedings of CHI
2009, Boston, MA, April 4-9, 2009, 1237-1246.
4. O’Brien, H. L., Toms, E. G., Kelloway, E. K., and Kelley, E. Developing and evaluating a reliable measure of user en-gagement. Proceedings of the American Society for
Informa-tion Science and Technology 45, 1 (Jan. 2008), 1–10.
5. Schneider, B., Tobiasz, M., Willis, C., Shen, C., When Two is Too Many for One: Cognitive Overload in a Multi-Surface Multi-Touch Environment. Submission in
review.
6. Shaer, O., Strait, M., Valdes, C., Feng, T., Lintz, M., and-Wang, H. Enhancing genomic learning through tabletop inte-raction. In Proc. of CHI ’11, ACM Press (2011)
7. Ware, C., Visual Thinking for Design. Morgan Kauf-mann, First Edition (April 2008). ISBN-10: 0123708966.
8. Wigdor, D., Jiang, H., Forlines, C., Borkin, M., Shen, C. The WeSpace: The Design, Development and Deploy-ment of a Walk-Up and Share Multi-Surface Visual Collaboration System. Proceedings of CHI 2009, Bos-ton, MA, April 4-9, 2009, 1237-1246.
Figure 5: Relative input contribution from each of the three scientists. (Reproduced from Figure 4 in Wigdor et al 2009.)
Figure 6: Comparing quality of users’ verbal reflection between a dyad and an individuals. (Reproduced from Figure 3 in Schneider et al 2011.)
GeoLens: Multi-User Interaction with Rich Geographic
Information
Ulrich von Zadow Archimedes Solutions GmbH Berlin, Germany [email protected] Florian Daiber DFKI GmbH Saarbr¨ucken, Germany [email protected] Johannes Sch¨oning People Interactive GmbH K¨oln, Germany [email protected] Antonio Kr¨uger DFKI GmbH Saarbr¨ucken, Germany [email protected] ABSTRACT
Zoomable 3D map viewers have been used many times as excellent demos of the potential of multi-touch systems. While they showcase the possibilities of multi-touch very well, they are inherently not capable of supporting multi-user interaction. We present enhanced magic lenses - Geo-Lenses - as user interface concept that expands on prior magic lens work. GeoLenses are fully multi-user capable while still being intuitive to use. We built a complete end-user application based on this concept and deployed it in an exhibition. Our observations of application usage by about 150 visitors suggest that the concept is viable and easy to understand for the general public.
Author Keywords
Geographical information systems, GIS, touch, multi-user, tabletop computing, in situ, magic lens
ACM Classification Keywords
H.5.2 Information Interfaces and Presentation: User Inter-faces
INTRODUCTION
Demos of 3D multi-touch map viewers abound1. The
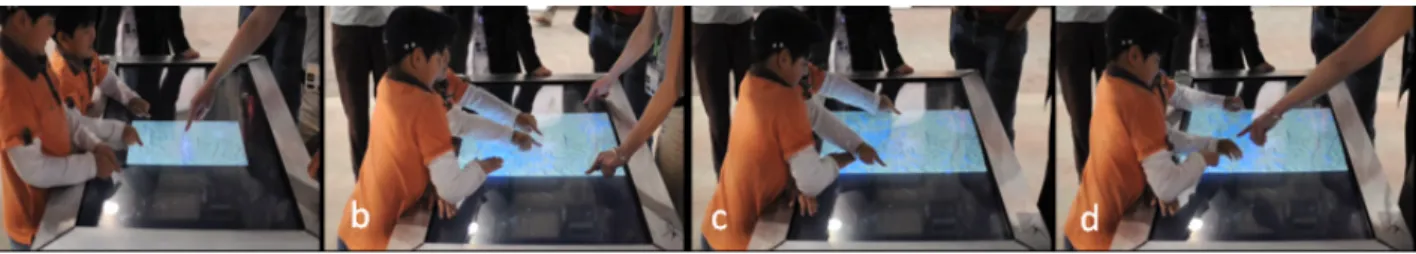
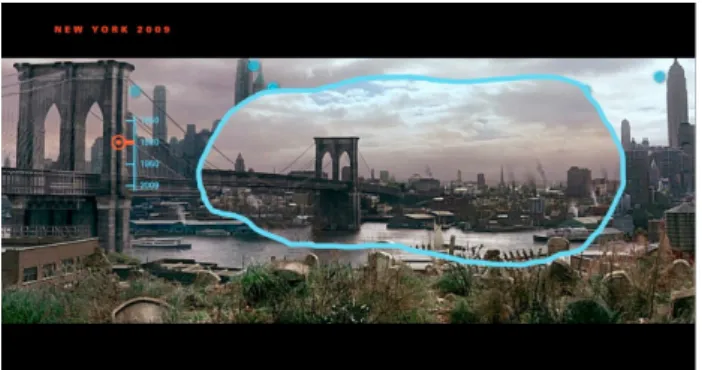
in-teraction paradigms of these demos are immediately under-standable and showcase the possibilities of multi-touch very well. However, they are inherently not multi-user capable, since the interaction of one user will always disrupt the in-teraction of all other users. A good example for this can be seen in a video2of two children trying to simultaneously
in-teract with a map application (see Figure 2): After a short while one child blocks interaction by simply touching the screen.
Magic Lenses support multi-user interaction. In the context of GIS (Geographical Information Systems), they consist of screen areas that modify what is displayed inside - for in-stance, by magnifying the map view or by displaying dif-ferent layers of data. Since several lenses can be active at one time, interaction by multiple users does not present a problem. There is a significant amount of research on this
1For examples, see http://www.youtube.com/watch?v=
3gxVjzmTnS4and http://vimeo.com/4973440.
2http://www.evl.uic.edu/cavern/tactile/kid.
mov
Figure 1. Users simultaneously interacting with the GlobalData appli-cation on our multi-touch table.
topic. However, no data on use outside of research labora-tories exists and usage in a real application context has not been demonstrated.
We are interested in the use of multi-touch, multi-user GIS systems for the general public. To this end, we have ex-panded existing Magic Lens concepts to support additional geolocated information and additional methods for configur-ing the data that is displayed inside the lens. We constructed a full end-user application, deployed it in an exhibition and report on observations of visitors using the system.
RELATED WORK
Tabletops and wall-sized interactive displays are well suited for collaborative work. Co-located collaborative work at tabletops has been an active research field for many years. In the early 90s Tang [16] did observational studies and derived requirements for collaborative work at tabletops and walls. Scott et al. [15] proposed system guidelines for collaborative work at tabletop displays. The DiamondTouch [6], with its capability to distinguish between different users, was often used to explore collaborative work at tabletops (e.g. [7, 8, 17, 19]).
Installations in museums and other public spaces present unique challenges. Hinrichs et al. [10] sum these up very well. Hornecker and Stifter [12] report that time pressure and the number of exhibits in an average exhibition result in many exhibits being abandoned quickly: ’the first ten sec-onds need to provide an incentive to continue.’ In addition, several studies of interactive surfaces in the wild (e.g. [5, 11,
Figure 2. Children blocking each others input (screenshots from video2): (a) Children interacting with the table (panning and zooming the map);
(b) - (c) The child in the foreground is accidentally blocking the interaction with the table and then consciously blocking the other’s input by pushing permantly on the screen; (d) Intervention of instructor to correct the childrens’ interaction.
14], to some extent [10]) determine that many users were interested more in the technology or visual effects than the content.
The notion of the “magic lens” was first introduced by Bier et al. in 1993 [1]. Bier et al’s original lenses are transpar-ent or semi-transpartranspar-ent user interface elemtranspar-ents which can be placed over objects to change their appearance and/or facilitate interaction. Since then, the concept has been ap-plied frequently to geographic visualization. Carpendale et al. made significant contributions, introducing virtual mag-nifying lenses in GIS applications [3, 4]. Here, they are used as a focus+context technique showing detailed information without loosing the context. The goal of the technique is to allow zooming in while retaining a sense of the global position of the zoom region. In the context of multi-user environments, these lenses allow multiple users to simulta-neously inspect details in different foci in a global context. Forlines et al. added user interface tools to the lenses [7]. Fu-ruichi et al. [8] used a magic lens concept to provide several layers of geographic information. However, beyond layers and zoom, configuration of the data set or its visualization is not possible in prior work. Beyond geographical information layers, no additional data is visualized in these approaches. All work on magic lenses described above was done in lab or demo settings; real-world data sets were seldom used, and no study with end users has been performed.
With GlobalData we present a ready-to-use end-user appli-cation with a significant quantity of real-world data that can be explored interactively.
THE GLOBALDATA MULTI-TOUCH APPLICATION
The GlobalData application was commissioned as part of the Science Express Germany Exhibition3. The Science Express
Germany was a mobile exhibition train focusing on research in Germany. It was open for six months in 2009 and was visited by more than 250.000 people. GlobalData was also presented as a demo at ITS 2010 [18].
We used an Archimedes SESSION DESK4– a 125 × 80 cm
multi-touch device based on DI – for the exhibit. A hori-zontal tabletop was a natural choice given that this shows the maps in the correct perspective and is open to collabo-ration. This was aided in part by the the narrowness of the
3http://de.expedition-zukunft.org/alias/
healthy_+_productive/994242.html
4http://www.archimedes-exhibitions.de/%23/
exhibits/in-serie/_/sessiondesk.html
train wagons: the table was only accessible from three sides. GlobalData was developed using the open-source media de-velopment platform libavg5.
Content
As content we used the National Geographic Special Edition on the Planet Earth 2008 [13], including many maps, statis-tical data, images, additional videos and documents. From this, the GeoLens concept was derived: Multi-user interac-tion is facilitated using personal “magic lenses” on a 2D map of the earth. To integrate the content into the application concept, we made an early decision to have several different map views, per-map geolocated images and videos, per-map geolocated text snippets and a legend for each map. In the end, we had 4 maps and a total of 63 geolocated info points, with most of the points containing textual as well as image or video data.
In accordance with the topic of this railcar, the map views selected were: Population (per-country population density data), Habitat (density of farm and pasture land), Overfish-ing (density of ocean fishOverfish-ing) and Water (density of irri-gated areas). The population view deserves special mention: It shows population data for the years 1950-2008 and pro-jected data for 2030. This data was not part of the National Geographic Magazine, but compiled from GapMinder6and
mapped to a world map using standard GIS software.
Interaction
In idle mode, the device shows a stylized map of the earth. No usage instructions are provided. However, users can open circular GeoLenses by simply touching the surface (see also Figure 3). These circles show the same map segment as the underlying base map and superimpose different data lay-ers on it. GeoLenses can be dragged and resized using the standard pinching motions. GeoLenses are novel enough to attract attention to the exhibit. Still, they are immediately understandable as a user interface concept and thus easy to use. All interaction takes place in the context of a lens. While the device has no concept of lens ownership, personal space issues that come into play in such a collaborative en-vironment [9] are dealt with smoothly. The initial size of a magic lens roughly corresponds to the intimate space of the
5http://www.libavg.de
6http://www.gapminder.org/data/
Figure 3. Screenshot of GeoLens showing the user interface compo-nents: (1) Geolocated point of interest; (2) Map view menu; (3) Ge-olocated text; (4) Open/close button for geGe-olocated images and videos; (5) Geolocated image; (6) Open/close button for map legend; (7) Time slider for population data; (8) Language toggle.
person interacting with it. Dragging and resizing operations allow collective ownership and ownership transfer. All addi-tional content and user interface elements specific to a lens are grouped around it. The area inside the lens is intention-ally kept clear of user interface elements and contains map data and location markers for georeferenced items. The goal was to keep the lens itself visually clean and avoid user in-terface conflicts between the elements and dragging or sizing operations.
A menu near the lens switches between different map views. Buttons on the lens perimeter open and close the map leg-end and geolocated images and videos. An additional button is used to switch between different languages. The geolo-cated text snippets are also displayed close to the lens. These change automatically without user interaction as the lens is moved around the tabletop. When the population view is ac-tive, an additional slider allows the user to choose the year that is visible in the GeoLens. Note that this represents an additional degree of freedom not present in prior work.
OBSERVATIONS
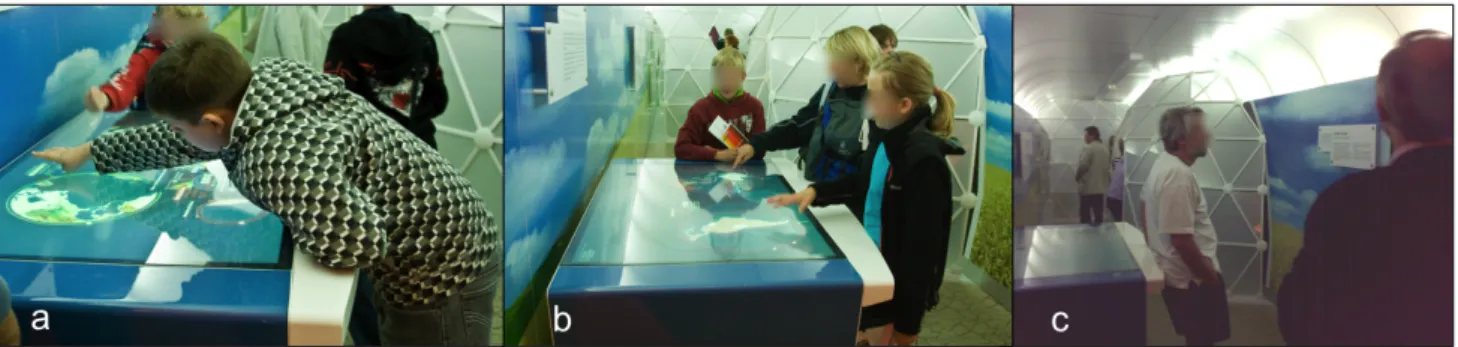
We observed about 150 exhibition visitors in early June 2009. Group size ranged from 1–5 people, with a few larger groups (school classes) and a wide age distribution, includ-ing a significant number of senior citizens. As is typical for museum exhibits, mean interaction time was about 3 min-utes. Most of the groups recognized the collaborative poten-tial of the application and interacted together on the table. As with many public displays, getting people to interact with this exhibit proved to be a critical point (see [2]). Some vis-itors passed by the GlobalData exhibit without noticing its potential at all (see Figure 5c: visitor watching world popu-lation clock instead). As soon as one person started interact-ing, others invariably followed.
As hoped and anticipated, collaboration and communica-tion between visitors was widespread. In many cases, peo-ple would open lenses by themselves but communicate with each other at the same time, teaching each other how to do things or showing each other interesting info on the map. In
Figure 4. Future work: The GeoLens concept transferred to a different domain.
contrast to prior studies [10], it was common for more than one group to interact at one time.
We observed that about one third of the people interacting used only a single finger. One simple reason was that a lot of people were carrying things (backpacks, jackets), but others simply did not expect multi-touch functionality. A signifi-cant number of visitors belonging to the second group did not attempt to drag the lenses either, but simply opened new ones as necessary. Luckily, the application supported this type of interaction as well. Age-wise, we found that older users were just as capable of interacting with the applica-tion as younger ones. As was to be expected, younger ones experimented more and were mostly interested in the visual effects, while older people were more thoughtful in their ac-tions and spent more time browsing the actual content. One of the most important observations we made was that most people were actually able to access the content after a short period of exploration. Many visitors were genuinely interested in the content and spent some time moving lenses around, reading the text and generally learning about the ac-tual subject matter. At first, this may not seem like a signifi-cant achievement. However, it is in contrast to several prior studies (e.g. [5, 11, 14]) of interactive surfaces in the wild, where the focus of the interaction was the technology and not the content.
CONCLUSIONS AND OUTLOOK
Our observations suggest the principal viability of the Geo-Lens approach for data exploration by untrained users - the principles of interaction seem to be immediately apparent to the majority, and access to a large amount of content is pos-sible in this way. However, a full in-situ user study would be necessary to verify these findings and prompt further im-provements.
The concept of GeoLenses would appear to generalize very well. Sliders, menus and buttons can be used to configure the content inside magic lenses in arbitrary ways. Geolocated data can be viewed, GIS layers selected and configured us-ing controls arranged at the perimeter of the lens. The time slider in particular could be used in very different application settings as well - see Figure 4.
Figure 5. Observations in the train: (a) - (b) Visitors interacting with the table. (c) One person ignores the interactive table, watching the world population clock instead.
Further expansion of the GeoLens concept seems possible. While we enable more fine-grained control of the visualiza-tion in this particular applicavisualiza-tion, further use cases as well as usability studies in a controlled environment would allow statements regarding the general feasibility of the approach. The combination of GeoLenses with zooming lenses is an-other promising research direction. Also, the current solu-tion simply prevents lenses from overlapping; the ability to merge lenses could aid cooperation.
REFERENCES
1. E. A. Bier, M. C. Stone, K. Pier, W. Buxton, and T. D. DeRose. Toolglass and magic lenses: the see-through interface. In Proc. of SIGGRAPH ’93, pages 73–80. ACM, 1993.
2. H. Brignull and Y. Rogers. Enticing people to interact with large public displays in public spaces. In Proc. of INTERACT ’03, pages 17–24. IOS Press, 2003. 3. M. S. T. Carpendale, D. J. Cowperthwaite, and F. D.
Fracchia. 3-dimensional pliable surfaces: for the effective presentation of visual information. In Proc. of UIST ’95, pages 217–226. ACM, 1995.
4. S. Carpendale, J. Ligh, and E. Pattison. Achieving higher magnification in context. In Proc. of UIST ’04, pages 71–80. ACM, 2004.
5. F. Daiber, J. Sch¨oning, and A. Kr¨uger. Whole body interaction with geospatial data. In Proc. of Smart Graphics ’09, pages 81–92. Springer, 2009.
6. P. Dietz and D. Leigh. DiamondTouch: A multi-user touch technology. In Proc. of UIST ’01, pages 219–226. ACM, 2001.
7. C. Forlines and C. Shen. Dtlens: Multi-user tabletop spatial data exploration. In Proc. of UIST ’05, pages 119–122. ACM, 2005.
8. M. Furuichi, Y. Mihori, F. Muraoka, A. Estenther, and K. Ryall. Dtmap demo: Interactive tabletop maps for ubiquitous computing. In UbiComp), 2005.
9. E. Hall. Distances in Man: The Hidden Dimension. Double Day, 1966.
10. U. Hinrichs, H. Schmidt, and S. Carpendale. Emdialog: Bringing information visualization into the museum. IEEE Transactions on Visualization and Computer Graphics, 14:1181–1188, November 2008. 11. E. Hornecker. “I don’t understand it either, but it is
cool” - visitor interactions with a multi-touch table in a museum. In Proc. of Tabletop, pages 113–120. IEEE, 2008.
12. E. Hornecker and M. Stifter. Learning from interactive museum installations about interaction design for public settings. In Proceedings of the 18th Australia conference on Computer-Human Interaction: Design: Activities, Artefacts and Environments, OZCHI ’06, pages 135–142, New York, NY, USA, 2006. ACM. 13. National Geographic Deutschland. NATIONAL
GEOGRAPHIC Collector’s Edition No. 9: Planet Erde 2008. 2008.
14. P. Peltonen, E. Kurvinen, A. Salovaara, G. Jacucci, T. Ilmonen, J. Evans, A. Oulasvirta, and P. Saarikko. It’s mine, don’t touch!: interactions at a large multi-touch display in a city centre. In Proc. of CHI ’08, pages 1285–1294. ACM, 2008.
15. S. D. Scott, K. D. Grant, and R. L. Mandryk. System guidelines for co-located, collaborative work on a tabletop display. In Proc. of ECSCW’03, pages 159–178. Kluwer Academic Publishers, 2003. 16. J. C. Tang. Findings from observational studies of
collaborative work. Int. J. Man-Mach. Stud., 34(2):143–160, 1991.
17. E. Tse, C. Shen, S. Greenberg, and C. Forlines. Enabling interaction with single user applications through speech and gestures on a multi-user tabletop. In Proc. of AVI ’06, pages 336–343. ACM, 2006. 18. U. von Zadow, F. Daiber, J. Sch¨oning, and A. Kr¨uger.
Globaldata: multi-user interaction with geographic information systems on interactive surfaces. In Proc. of ITS ’10, pages 318–318. ACM, 2010.
19. M. Wu and R. Balakrishnan. Multi-finger and whole hand gestural interaction techniques for multi-user tabletop displays. In Proc. of UIST ’03, pages 193–202. ACM, 2003.
Interactive Multi-touch Surfaces for Software Visualization
Craig Anslow, Stuart Marshall, James Noble
School of Engineering and Computer Science
Victoria University of Wellington
Wellington, New Zealand
{craig,stuart,kjx}@ecs.vuw.ac.nz
Robert Biddle
School of Computer Science
Carleton University
Ottawa, Canada
robert [email protected]
ABSTRACT
Most software systems are developed by teams of people. The tools used to develop and maintain these systems are pri-marily designed from a single-user perspective and are bound to Integrated Development Environments (IDEs). These de-sign decisions do not allow users to collaboratively navigate through software visualizations or to analyse software eas-ily. We are investigating whether multi-touch table interac-tion techniques are more effective for co-located collabora-tive software visualization than existing single-user desktop interaction techniques. The implications of our research will help inform developers how to design better visualization ap-plications for interactive multi-touch surfaces.
ACM Classification: H1.2 [User/Machine Systems]: Hu-man Factors; H5.2 [Information interfaces and presentation]: User Interfaces. - Multi-touch user interfaces.
General terms: Experimentation, Human Factors.
Keywords: Multi-touch, software visualization, user study.
1. INTRODUCTION
Maintaining large software systems requires understanding the underlying structure, which is a hard task. Understanding software is often a social activity and involves teams of soft-ware developers. Softsoft-ware visualization aims to help with techniques to visualize the structure, behaviour, and evolu-tion of software [4]. Visualizaevolu-tion tools designed for a sin-gle user perspective make it hard for developers to analyse software when working together in a co-located environment (within the same room) using the same interface.
Multi-touch table user interfaces are an example of a co-located collaborative tool which could be used for software analysis. We are investigating whether multi-touch table in-teraction techniques are more effective for co-located collab-orative software visualization than existing single user desk-top interaction techniques. In this paper we discuss past work, our multi-touch software visualization prototype, a qualitative user study, challenges, and future work.
2. PAST
An approach to understand how participants use interactive multi-touch surfaces follows a qualitative research method. This method has been successfully adopted to provide insight into the design of tabletop displays for information visualiza-tion [9], visual analytics [10], and collaborative design [16].
Ko et al. have explored how software development tools support collaborative software understanding [11]. Storey et al. have explored collaborative software visualization [18]. These studies and very few tools have explored collaborative interactive multi-touch surfaces for software development or software visualization.
Parnin et al. suggest the addition of peripheral interactive spaces to programming environments for supporting devel-opers in maintaining their concentration using touch based devices ranging from portable to tabletops [15]. Anslow et al. conducted a qualitative user study to find out the effective-ness of an established software visualization technique using a large visualization wall [1]. Boccuzzo et al. have made an extension to their 3D tool for software exploration with multi-touch features [2]. Hardy et al. created a visual sys-tem that uses digital pens and Wii Remotes for interaction to assist with software development processes such as what developers are working on, a summary of the architecture, and work flow activities [7]. Bott et al. created an interactive CRC card system that uses Wii Remotes for collaborative re-quirements engineering [3].
3. PRESENT
We are developing a prototype called SourceVis for large multi-touch tables to analyse the structure, evolution, and vocabulary of software systems, see Figure 1. The visual-izations adapt existing information and software visualiza-tion techniques and modify them to support multi-touch and multi-user interaction. SourceVis is built upon MT4j [13].
3.1 Interaction
We envision developers working in groups (2–3) with our prototype to explore at a high level what parts of a software system are large, problematic, and need to be refactored. Users first load a system by tapping on the menu to select a name of a system before any visualizations can be displayed. Users start a visualization by tapping on the icon of the vi-sualization. Each visualization is displayed in a rotatable and scalable window with options to display at full screen or close. Multiple visualizations can be displayed at once. Users can interact with individual elements in the visualiza-tions. To select an element users tap, drag with one finger, and rotate and resize with two fingers. Double tapping an element displays properties about that element. Multiple ele-ments can be grouped by drawing a shape around them using a lasso gesture and then subsequently move them around the