OATAO is an open access repository that collects the work of Toulouse
researchers and makes it freely available over the web where possible
Any correspondence concerning this service should be sent
to the repository administrator: [email protected]
This is an author’s version published in:
http://oatao.univ-toulouse.fr/24448
To cite this version:
Berne, Clément
and Andrieu, Eric
and Reby, Jean and Sobrino,
Jean-Michel and Blanc, Christine
Corrosion Behavior of α,β'-Brass in NaNO3
Solutions. (2015) ECS Transactions, 64 (26). 111-120. ISSN 1938-6737
Corrosion behavior of α,β’-Brass in NaNO
3Solutions
C. Berne
a, b, c, E. Andrieu
b, J. Reby
c, J-M. Sobrino
d, and C. Blanc
b aPhD candidate, joint laboratory CETIMAT, CETIM – CIRIMAT
bUniversité de Toulouse, CIRIMAT, UPS / INPT / CNRS, Equipe MEMO
ENSIACET, 4, allée Emile Monso BP 44362, 31030 Toulouse Cedex 4, France
c
CETIM, Pôle Matériaux Métalliques et Surface
74, route de la Jonelière CS 82617, 44326 Nantes Cedex 3, France
d
CETIM, Pôle Matériaux Métalliques et Surface
52, Avenue Félix Louat CS 80067, 60304 Senlis Cedex, France
The corrosion behavior of an α,β’-brass CuZn40Pb2 (CW617N)
was studied in solutions with basic pHs and various nitrate ion
concentrations. Corrosion at the open circuit potential was
observed to proceed by the galvanic coupling of α and β’ phases,
leading to a surface dezincification of the β’ phase and the
evolution of the passive layer. When the alloy was polarized in the
anodic domain, a pseudo-passive or a passive stage followed by a
passive breakdown was observed.
Introduction
In various corrosive environments, α,β’-brasses, used in components in gas distribution
networks, are believed to be susceptible to simultaneous dissolution (Cu, Zn) and/or
selective dissolution (Zn, dezincification) processes. These phenomena are expected to
play a major role during the first stages (incubation and initiation) of stress corrosion
cracking (SCC) damage, leading to rupture, that can be observed on network components
in service. In this framework, it is of interest to develop a good knowledge of α,β’-brasses
corrosion mechanisms. However, abundant literature can be found for α-brass (in nitrite
solutions, for example: (1) (2) (3) (4) (5) (6) (7) (8) (9) (10)) but not for α,β’-brasses (11)
(12) (13) (14).
Therefore, the present study aimed to contribute to a better understanding of the corrosion
processes of α,β’-brass. The target of this study was to test the influence of the
environment (pH, composition) on the corrosion behavior using electrochemical
techniques. The specimens investigated in the present work were composed of α,β’-brass
CuZn40Pb2 (CW617N) removed from stamping rods that were used to manufacture gas
transfer valves. This specific alloy, CW617N, used principally for its good machinability
and resistance to corrosion, is principally studied for the development of water taps (15)
(16) (17) (18). In the present work, corrosion tests were performed in NaNO
3solution,
selected on the basis of a literature review on α-brass (19), although in literature the
solutions that are most often used are ammonia (14) (20) (21), sulfuric acid (22) (23) (24),
and nitrite solutions (9). Results obtained over a wide range of conditions (pH, nitrate ion
concentrations) were analyzed by comparing open circuit potential (OCP) measurements,
anodic polarization curves, and surface characterizations (Optical Microscope, Scanning
Electron Microscope and X-Ray photoelectron spectrometry).
Experimental
Material
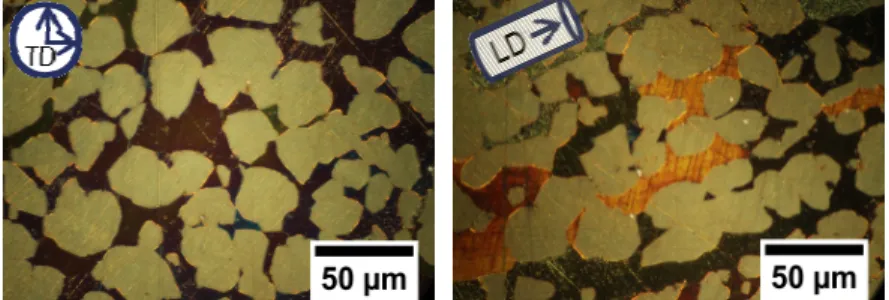
The samples of α,β’-brass CuZn40Pb2 were removed from casting rods. Their
chemical composition (Zn 38.35, Al 0.008, Ni 0.051, Fe 0.205, Mn 0.004, Sn 0.150, Pb
1.875, Si 0.001, Cu 59.35, wt. %) was similar to that from the standard composition
CW617N. Their metallurgical state was that of the heart of a 65mm diameter stamping
rod (Figure 1). The α phase (64 at% Cu, 36 at% Zn) was included in an enveloping β’
phase (55at% Cu, 45at% Zn). A transverse section of the rod was characterized by
equiaxed grains (α and β’ phase) with an average size of 24 µm in diameter for the α
phase and 20µm for the β’ phase. In the longitudinal sections of the rod, a texturation of
the β’ grains was observed: their size varied from 20µm to 120µm compared to 20µm in
the transverse direction. Moreover, the α grains distribution in the longitudinal section
was heterogeneous: α grains had preferentially germinated at the β’ grain boundaries,
leading to a specific chaining of β’ and α phases.
Figure 1.
Optical microscope observations of the α,β’-brass CuZn40Pb2 (CW617N)
Corrosion tests
Corrosion tests were performed in NaNO
3solutions (0.05M, 0.1 M, 0.5 M, 1 M -
AnalaR NORMAPUR® ACS, ISO, Reag. Ph. Eur. analytical reagent).The pH of the
different solutions was adjusted (11, 12, 13) by the addition of NaOH (AnalaR
NORMAPUR® ACS, ISO, Reag. Ph. Eur. analytical reagent).
Open Circuit Potential (OCP) measurements, anodic potentiokinetic polarization
experiments and corrosion tests at constant potential were performed with a standard
device composed of a potentiostat connected to a reference electrode (Saturated Calomel
Electrode), a counter electrode (platinum) and a working electrode composed of an
α,β’-brass sample. The surface exposed to the electrolyte corresponded to the plane
perpendicular to the extrusion direction. For the OCP measurements and the polarization
tests, the surface area was equal to approximatively 4 cm². The sample surface was
polished with 4000 grit SiC paper before the experiments. Tests were performed in a
beaker with 300 mL of the solution that was open to the air and moderately stirred with a
magnetic stirrer. During the tests, the beakers were placed in a thermostatically controlled
water-bath maintained at 23.5±2 °C. OCP values were measured for 15 minutes upon
immersion of the working electrode, and then the anodic polarization curves were plotted
from the last OCP value to a potential sufficient to observe the passivity breakdown at a
scan rate of 0.070 mV/s.
Complementary tests
Surface observations and analyses after the corrosion tests were performed through
optical microscopy (OM) (Olympus 2000) and X-ray photoelectron spectroscopy (XPS K
alpha ThermoScientific, and monochromatic excitation source A1Kα 1486.6eV).
Semi-quantification and XPS peak deconvolutions were made after selections of the peak
Binding Energy (BE) or the Kinetic Energy in common database.
Results
Corrosion behavior of α,β’-brass CuZn40Pb2 at OCP
The corrosion behavior of α,β’-brass CuZn40Pb2 during immersion in different
NaNO
3solutions is presented as OCP vs. time curves. These curves were plotted during
15 minutes upon immersion of the samples in the electrolyte for various chemical
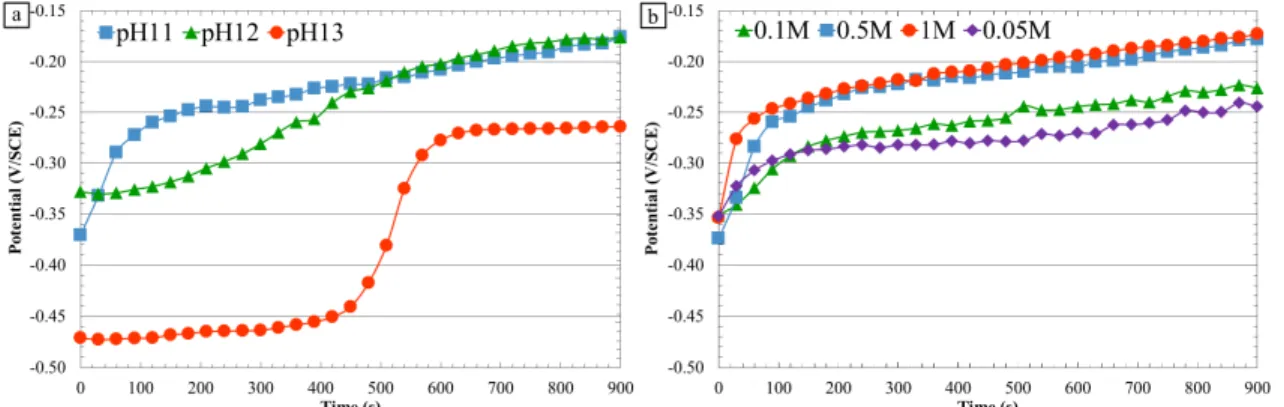
conditions (different pH values and nitrate ion concentrations) (Figure 2).
Whatever the pH and the nitrate ion concentration (Figure 2 a and b), the OCP first
increased rapidly (except for pH 13, Figure 2 a) and then tended to stabilize, which could
be associated to passivation/pseudo passivation of the exposed surface. The results
showed that the pH (Figure 2 a) significantly influenced the OCP measurements. The
evolution rates of the OCP from one curve to another were quite different: when the pH
increased, the OCP evolution slowed down during the first 400s, which was markedly
visible for pH 13. Furthermore, the OCP value was stabilized at -0.24 V/SCE for a pH of
13 whereas for a pH equal to 12 and 11, the OCP reached a value of approximately -0.17
V/SCE after 15 minutes in solution but that was not totally stabilized, as confirmed by
longer measurements. The results were probably correlated to a surface evolution that
was strongly dependent on pH. Figure 2 b shows the influence of the nitrate ion
concentration on OCP values for a pH 11 solution. The effect of the nitrate ion
concentration was less significant than that of the pH. Globally, all curves presented the
same shape with a rapid increase of the OCP in the first part of the immersion. The OCP
value reached after 15 minutes in solution increased with the nitrate ion concentration;
however longer tests showed that the OCP values were slightly dependent on the nitrate
ion concentration.
Figure 2. OCP vs. time of the α,β’ brass CuZn40Pb2 (a) at various pH, in a 0.5 M NaNO
3solution (b) at various NaNO
3concentrations, pH 11.
Figure 3. Optical microscope observations of the α,β’ brass CuZn40Pb2 sample surface
(a) before immersion (b) after 15 minutes at OCP in a 0.5 M NaNO
3solution at pH 11 (c)
after 15 minutes at OCP in a 0.5 M NaNO
3solution at pH 12.
The preliminary results presented in Figure 2, characterizing surface evolution
through potential evolution, were completed further by OM observations (Figure 3) and
XPS analyses (Figure 4 and Figure 5). Because the pH was found to be the major
parameter on OCP values, attention was paid to surface evolution depending on the pH of
the electrolyte in a 0.5M NaNO
3solution. Comparison of OM observations before
immersion (Figure 3 a) and after 15 minutes at OCP in a 0.5 M NaNO
3solution at pH 11
(Figure 3 b) showed an orange discoloring of the β’ phase after immersion. This
discoloring became more pronounced after 15 minutes at OCP in a 0.5 M NaNO
3solution
at pH 12 (Figure 3 c).
Figure 4. General XPS spectra and identification of the characteristic peaks on α,β’ brass
CuZn40Pb2. Spectra are plotted for a non-corroded sample and for a sample after a 15
minute immersion at OCP in a pH 11 solution (0.5M NaNO
3).
These evolutions were assumed to be mainly due to the formation of a
passive/pseudo-passive layer and its evolution as well as a dezincification process of the
sample surface, in particular of the β’ phase. Figure 4 shows general XPS spectra
obtained for a non-corroded sample and for a sample after a 15 minutes immersion at
OCP in a pH 11 solution. For the non-corroded sample, Zn and Cu characteristic peaks
were detected, as well as O and C peaks. Attention was paid to Cu 2p
3/2and Zn 2p
3/2peaks.
c
b
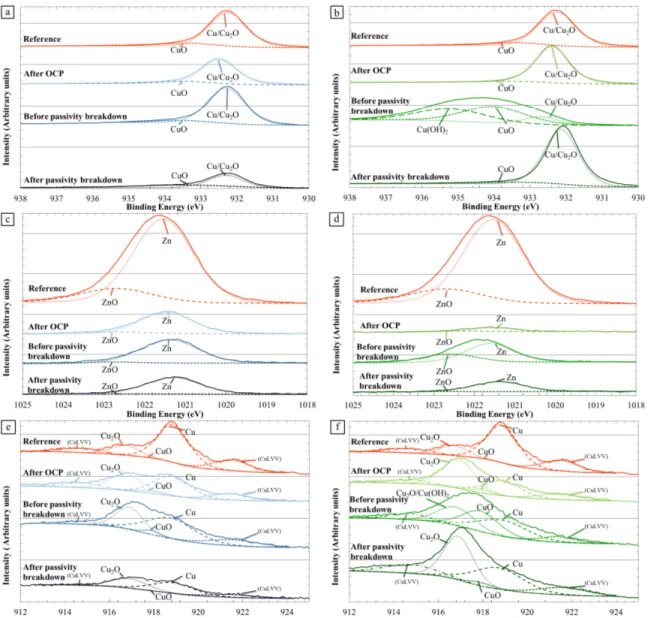
Figure 5. XPS analyses of α,β’-brass CuZn40Pb2. Focus on (a) and (b) Cu2p3/2 peaks,
(c) and (d) Zn2p3/2 peaks, and (e) and (f) Cu LMN peaks. Figures (a), (c) and (e)
correspond to a pH 11 solution. Figures (b), (d) and (f) correspond to a pH 12 solution.
All solutions contained 0.5M NaNO
3. On each figure, XPS analyses were performed for a
non-corroded sample, a sample after a 15 minute immersion at the OCP, and samples
after the polarization until the potentials before and after the passivity breakdown.
Results showed that, for the non-corroded sample, the intensity of Cu 2p
3/2(Figure 5 a
and b) and Zn 2p
3/2(Figure 5 c and d) peaks was strong. Deconvolution of these peaks, as
well as that of Auger Cu peak (Figure 5 e and f), showed that the surface was covered by
a passive film mainly composed of Cu
2O and ZnO for a lower part. However, the signals
of both metallic Zn and Cu were strong showing that this passive film was very thin.
After a 15 minutes immersion at OCP in the pH 11 solution, the general spectrum (Figure
4) evidenced a decrease of Zn 2p
3/2peak. Figure 5 c confirmed that the Zn 2p
3/2peak was
significantly reduced and its intensity was even lower for the pH 12 solution (Figure 5 d)
compared to pH 11. This was confirmed by XPS semi-quantitative analysis of the
samples (Figure 6). The results thus corroborated the dezincification hypothesis and
showed that the dezincification process was increased when the pH increased. This was
correlated with an evolution of the composition of the surface with, after immersion at
Figure 6. XPS semi-quantification for the characterization of the dezincification
phenomenon of α,β’ brass CuZn40Pb2 during immersion at the OCP and anodic
polarization in a 0.5M NaNO
3solution (a) at pH 11 (b) at pH 12. The Cu/Zn ratio of a
non-corroded sample (reference) is reported for comparison.
Figure 7. Current density vs. potential curves for the α,β’ brass CuZn40Pb2 (a) at various
pHs, 0.5 M NaNO
3(b) at various nitrate ion concentrations, pH 11
Corrosion behavior of α,β’-brass CuZn40Pb2 under anodic polarization
The anodic behavior of the material, evaluated through anodic polarization curves
plotted after 15 minutes at OCP, is shown in Figure 7. Globally, all curves presented a
similar shape with a first breakdown potential corresponding to the corrosion potential,
E
corr, then a passivity or pseudo-passivity plateau followed by a second breakdown
potential, E
bp, and finally a strong increase of the current densities corresponding to the
passivity/pseudo passivity breakdown. Figure 7a shows the influence of the pH on the
current-potential curves. The shift of the OCP towards more cathodic values when the pH
value increased, as shown in Figure 2 a, was clearly evidenced on the polarization curves
with the shift of E
corr. Furthermore, a significant influence of the pH was observed on the
current densities and on the values of the second breakdown potential, E
bp. At pH 11, a
passivity plateau was observed that was characterized by low current densities
OCP in pH 11, a passive layer mainly composed of Cu
2O with a very low amount of
ZnO; at pH 12, the passive layer seemed to be thicker and mainly composed of Cu
2O, Zn
being significantly depleted at the surface. The differences in the chemical composition
of the surface layer depending on the pH should explain the OCP results (Figure 2 a). The
slowing down of the OCP evolution rate and the decrease of the OCP values when the pH
increased should be related to a higher dezincification process leading to a more porous
structure of the brass surface.
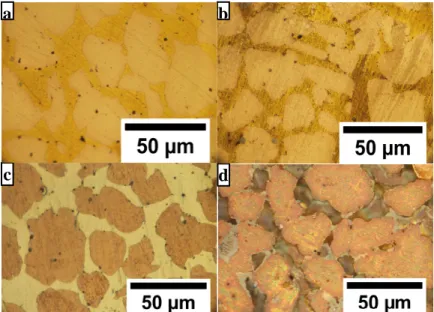
Figure 8. Optical microscope observations of the α,β’ brass CuZn40Pb2 after interrupted
anodic polarization tests in a 0.5 M NaNO
3solution (a) before breakdown potential (20
mV.SCE), pH 11 (b) after breakdown potential (50 mV.SCE), pH 11 (c) before
breakdown potential (50 mV.SCE), pH 12 (d) after breakdown potential (140 mV.SCE),
pH 12.
At pH 11, during the passivity stage, OM observations (Figure 8a) and XPS analyses
(Figure 5) did not show any significant evolution of the surface on the passivity plateau
compared to the surface analyzed after OCP. The formation of a Cu
2O layer was revealed
(Figure 5 a and e), with Cu in metallic form, demonstrating that the passive layer should
be thin. After the breakdown potential, OM observations (Figure 8 b) showed that the β’
phase started to dissolve locally while the α
phase appeared to remain stable. XPS
analyses (Figure 5) showed no significant differences concerning the major elements, i.e.,
Cu and Zn, compared to the results on the passivity plateau. This was probably because
c
d
b a