1
This is a post-peer-review, pre-copyedit version of an article published in
Population Research and Policy Review. The final authenticated version is
available online at: http://dx.doi.org/10.1007/s11113-019-09537-y
Please cite as:
Marois, G., et al. 2019. Implementing Dynamics of Immigration Integration in Labor
Force Participation Projection in EU28. Population Research and Policy Review.
2
Implementing dynamics of immigration integration in labor force participation
projection in EU28
1. Introduction
As demographic aging is transforming the working-age population of developed nations, understanding and forecasting labor force participation becomes increasingly relevant for policy makers. Indeed, as the boomers move into retirement and are replaced by smaller cohorts of young individuals entering the labor force, concerns grow about the increasing proportion of inactive people within the adult population.
Recent research has shown, however, that the situation may not be as critical as previously thought. Indeed, labor force participation differs across cohorts so that many countries are now experiencing an increase in participation rates of older workers due to delayed retirement (Hasselhorn and Apt 2015; Loichinger and Prskawetz 2017). In addition, participation rates for women have increased drastically in the past decades (Cipollone et al. 2014). Thus, the projection of economic indicators such as labor force participation may provide a better assessment of the consequences of population aging than strictly demographic measures (Loichinger et al. 2017; Sanderson and Scherbov 2015).
With declining rates of natural increase, immigration is becoming the main driver of demographic growth and is significantly remodeling the ethnocultural landscape in several countries (Coleman 2006). Up to the end of the World War II, most European countries were experienced negative net migration in result of large flows of people moving in Americas for colonial and economic reasons and little flows toward the continent (de Haas 2018). Then, while many European countries experienced a rapid economic development, migration dynamic changed drastically. Castles, de Haas and Miller (2013) described four phases of migration in Europe following the World War II. First from 1945 to 1970, large flows of low skilled workers from Mediterranean countries and Turkey moved to Europe to help for the reconstruction. In the second stage, from 1970 to mid-1990, neoliberal economic policies encouraged relocation of low-skilled jobs in developing countries, thus reducing the needs for low-skill immigrants. Migrants arrived in the previous periods settled permanently and sponsor their families, which contributes to keep immigration at relatively high level despite massive unemployment among migrants. The third phase, that ends with the economic crisis of 2008, is marked by the collapse of the Soviet Union and the establishment of the Schengen zone that facilitate migration from Central and Eastern Europe countries. During the same period, southern Europe countries become major destinations for migrants, especially from West Africa and Latin America. In the 4th, that is still ongoing,
permanent migration to Europe is raised at unexpected level despite the economic crisis and slow economic growth of Europe. This period sees the arrival of massive inflows of refugees from middle-East as well as regular and irregular migrants from Africa that can now afford the cost of migration. While experiencing a sharp aging of their population, many developed countries see high immigration inflows as an opportunity to mitigate its consequences (Termote 2011). The expectation is usually that immigration should increase the share of the working age population and, by extension, would positively affect economic dependency indicators. In this context, it becomes important to give special attention to the growing share of immigrants in the working-age population, as their market behavior can differ significantly from the market behavior of natives.
This paper examines the effects of taking immigration-related variables into account when doing labor force projections in countries of the European Union. The first section reviews recent efforts in labor force projection in the European context and highlights the relevance of including immigration characteristics in labor force projections. The second section briefly presents CEPAM-Mic, a
3 microsimulation model that projects several demographic, ethnocultural and socioeconomic dimensions of the EU28 member countries population and looks in more details to the labor force participation module of that projection model. The last section compares outputs from different projection scenarios to demonstrate that incomplete economic integration of immigrants affects the results of labor force projections in terms of size, rates and gender composition.
This research is part of the Centre of Expertise on Population and Migration (CEPAM), a joint research project of the International Institute for Applied Systems Analysis (IIASA) and the Joint Research Centre (JRC) of the European Commission. The microsimulation projection model presented in this paper is used to study the consequences of alternative migration scenarios on future population trends in Europe, one of CEPAM’s main research objectives. Such a model is very flexible and is characterized by the stochastic simulation of individual life courses based on derived parameters and individual characteristics. Microsimulation is the preferred tool for this analysis as traditional cohort-component projection models generally cannot be used when a large set of characteristics must be projected simultaneously.
2. The importance of including immigration differentials in labor force participation projections
The most common way to project the labor force is to apply predetermined participation rates by age and sex to standard demographic projection outputs. Many methods have also been developed to build assumptions concerning the future evolution of these rates, such as extrapolation models, targets scenarios and regression models based on macro-indicators (International Labour Organization 2011).Major recent attempts to project the size of the labor force in Europe include the Aging Report of the European Commission (European Commission and Economic Policy Committee 2014), projections by Elke Loichinger (2015) and OECD projections (Spielvogel and Meghnagi 2018). The Aging Report used average entry and exit rates based on recent trends and applied them to the Eurostat’s age-sex population projections for each country. It is based on the 2013 Eurostat population projections by age and sex and use a cohort simulation model to project future participation rates. It gives a particular attention to the increase in the labor force participation of women, which is mainly driven by a demographic metabolism effect of younger generations of women more attached to the labor market replacing older women with lower participation rates. It also considers how recent pension reforms implemented in many European countries can affect future participation of older workers, but in definitive does not consider changes in other characteristics of the population that can have an impact on future labor force participation rates.
Loichinger (2015) specifically addresses what could be the impact on future labor force size of European countries of one of these characteristics: the increase in educational attainment that is likely to occur (Lutz et al. 2014). As more educated population show higher participation rates than less educated, controlling for the expected increase in the average education level of the future European population should provide a more favorable picture of the expected future. Indeed, her projections results comparing scenarios that included or omitted the effect of education and suggest that the future size of the labor force might be larger than what was previously anticipated. The model used by Loichinger based on the multidimensional population projections developed by Lutz and colleagues (2014) makes a strong case for controlling for expected future changes in the composition of a population when projecting the future of the labor market supply. It had the advantage of including an important source of heterogeneity, but it is limited by its methodology when it comes to add additional sources of heterogeneity.
4 Multistate projection models can handle one or two additional dimensions with age and sex, but they are generally unable to produce more complex results, as they can only accommodate a limited number of dimensions. Indeed, as the size of the matrix increases exponentially with the number of variables included in the model, these matrices can rapidly become unmanageable as the number of included variables and modalities increases. Thus, their users have to rely on the assumption that homogeneity exists in the behaviors of population groups defined by age, sex and possibly another variable such as education. In the context of labor force participation of immigrants and natives, empirical evidences, however, suggest that such an assumption constitutes an oversimplification. In a recent OECD report, Spielvogel and Meghani (2018) evaluate the contribution of migration to future labor dynamics of EU and other OECD countries for the period 2015-2030. Like Loichinger, their results show that the labor force is less sensitive to ageing than the overall population in part because of the predictable increase in the labor force participation rates associated to the increasing education level of the population and to the reduction of the gender gap in labor force participation. They innovate however by taking into consideration another source of heterogeneity in labor force participation: the immigration status. Labor force participation of migrants differs from natives even when controlling for education level. They show that in the European context, immigrants from non-European countries have lower participation rates (Spielvogel and Meghnagi 2018). In particular, immigrant women with low education have very low participation rates.
They project labor force population by age, sex, education and three immigration statuses (natives, EU migrants and non-EU migrants) using a simple stratagem. Since there are no possible transitions over the life course between immigration statuses, the total labor force population is obtained by adding the results of three separate projections by sub-population. This approach has the main advantage of allowing the use of different participation rates between natives and immigrants, but it also has a number of limitations. First, they do not project fertility and in consequence, they can only project the labor force population over a horizon of 15 years. They also assume constant mortality rates over all the projection period and no differentials in mortality rates by education or immigration status, another important draw back. Also, net migration is estimated as a residual, which means that it includes all the measurement errors in their estimate of the migration component of their model, a source of error that can be relatively large when net migration is close to zero. Finally, they do not account for variations in labor force participation of immigrants by duration of stay in the country or by age at immigration.
In most developed countries, immigrants struggle to achieve full economic integration as they encounter more labor market obstacles than natives (Bevelander 2005; Büchel and Frick 2005; Kahn 2004; Model and Lin 2002; OECD 2010). Moreover, research has shown a deterioration of the economic integration of immigrants over the last decades, in particular for non-Whites and immigrants born in third-world countries (Dustmann et al. 2003; Kogan 2006). In general, the labor market performance of international immigrants tends to improve with the number of years passed in the host country (Alba and Nee 1997; Borjas 2008), but many immigrants are now failing to catch up to natives in terms of economic outcomes (Aydemir and Skuterud 2005; Beyer 2016; Picot and Sweetman 2011). In some immigrant communities, a double disadvantage arises from being an immigrant and a woman, resulting in much wider gender inequalities in terms of labor force participation (Adsera and Chiswick 2007; Boyd 1984; Donato et al. 2014; Dustmann et al. 2003). Projections that fail to integrate immigration-related differentials in terms of labor market outcomes can thus likely produce biased results, in particular for alternative scenarios assessing the impact of different levels of immigration on the future size of the labor force.
5 Second, international immigration to EU28 countries affects human capital stocks, which are major determinants of labor force participation rates. In countries where immigration flows come mainly from asylum seekers and family reunifications, immigrants are concentrated in low educated groups. Conversely, in countries with a selective labor migration system, immigrants are on average more educated than the natives (Eurostat 2017). In consequence, migrants are often overrepresented among the low and highly educated (Arslan et al. 2015). In addition, studies conducted in the USA and in Europe have shown that many children of immigrants from racial and linguistic minorities are disadvantaged in their educational trajectory (Hirschman 2001; Marois et al. 2017; Riphahn 2003). These differentials need to be accounted for when measuring the effect of immigration on future human capital stocks, and by extension, on future labor force participation.
Finally, immigrants and natives differ in terms of demographic behaviors, and this difference may have a significant impact on the composition and the age structure of the population. Depending on their country of origin, fertility levels of immigrants are often higher than fertility levels of natives, especially in the first years following their arrival (Bélanger and Gilbert 2007; Coleman 1994; Mayer and Riphahn 2000; Mussino and Strozza 2012; Toulemon 2004). Mortality rates of immigrants are usually lower at their arrival and then tend to slowly converge to the rates of natives (Kennedy et al. 2006; Ng 2011). Increased fertility and lower mortality early after migration is thought to occur in part because of a tempo effect (women delay pregnancy after immigration) and because of the self-selection of healthy individuals (only the healthiest have the strength to migrate). Different mobility patterns between immigrants and natives are also likely to shape the spatial distribution of the population as well as to impact hypotheses on international emigration, given the propensity of recent immigrants to realize a return migration (Dustmann and Weiss 2007).
3. The CEPAM microsimulation model and its labor force participation module
3.1 Overview of the CEPAM-Mic modelCEPAM-Mic is a microsimulation projection model developed for the CEPAM project. Its core structure and base population are exhaustively described elsewhere (Bélanger et al. 2018; Bélanger and Sabourin 2017; Marois et al. 2019). Briefly, the model aims to project the population of all EU28 member countries along several demographic, ethnocultural and socioeconomic dimensions. In addition to age, sex and education, immigration-related variables are also included in the model, such as immigrant status, place of birth, age at immigration and duration of residence in the host country. Individuals from the base population are simulated one by one and their characteristics are modified through scheduled events whose timing are stochastically (Monte-Carlo) determined using the values of their specific input parameters at any given time during the projection period. In addition to life-course changes, the model also allows for intergenerational transfers of characteristics from mother to child. The parameters used as inputs are themselves derived through various statistical methods, using available data sources. The next section provides a detailed description of the labor force participation module.
3.2 Description of the labor force participation module
CEPAM-Mic uses an approach that is similar to the approach used by Statistics Canada in DemoSim in modeling labor force participation (Bélanger and Bastien 2013; Caron-Malenfant et al. 2017). In short, the labor force participation status (Active or Inactive) is derived for the population aged 15 to 74 years old and is reassessed every time that a relevant characteristic of the actor is modified (such as age, education, duration of immigration, etc.). LFP status is assigned through a Monte-Carlo experiment where a random number is compared to the probability of being active of an actor given his/her set of characteristics. This probability is itself derived from parameters estimated from a
6 logistic regression performed. Future evolution of labor force participation rates depends also on country-specific entry and exit rates by cohort, sex and education. Global participation rates in the model further vary through compositional effects, whereas groups with higher or lower participation rates may increase their relative importance in the population.
The European Labour Force Survey (EU-LFS) is the only data source providing comprehensive and standardized questions on labor force participation for all EU28 countries as well as on education, age, sex, and some immigration-related variables. EU-LFS data from 2010 to 2015 were pooled to minimize conjectural factors and to provide a large enough sample to derive robust parameters for all countries and both sexes. Sex- and country-specific logit regressions were then performed on a binomial variable giving LFP status as defined by the International Labor Organization (ILOSTAT)1. Equation 1 below
provides a mathematical description of the regression model: logit(𝑃) = 𝛽 + 𝛽 𝐴𝐺𝐸 + 𝛽 𝐸𝐷𝑈 + 𝛽 𝑌𝐸𝐴𝑅 + 𝛽 (𝐴𝐺𝐸 ∗ 𝐸𝐷𝑈) +
𝛽 (𝐴𝐺𝐸 ∗ 𝑌𝐸𝐴𝑅) + 𝛽 (𝐸𝐷𝑈 ∗ 𝑌𝐸𝐴𝑅) + 𝛽 (𝐴𝐺𝐸 ∗ 𝐸𝐷𝑈 ∗ 𝑌𝐸𝐴𝑅) +
𝛽 𝐼𝑀𝑀𝐼𝐺 + 𝛽 (𝐼𝑀15 ∗ 𝐸𝐷𝑈) (Eq.1)
Where
β0 + β1+ β2+ β4 capture the joint effect of age and education on labor force participation
rates2. Education is divided into 3 categories:
1. Low (L): Completed lower secondary education or less (ISCED 0, 1 ,and 2); 2. Medium (M): Completed upper secondary (ISCED 3);
3. High (H): Postsecondary education (ISCED 97: 4, 5A, 5B and 6; ISCED 2011: 4, 5, 6, 7, 8);
β3+ β5+ β6+ β7 capture the age and education specific trends in labor force participation;
β8 is a set of parameters for an immigration variable (IMMIG) combining place of birth3, age
at arrival and duration of stay. The variable is divided in five categories: 1. Born in EU28;
2. Generation 1.54 born outside EU28;
3. Generation 15 born outside EU28, duration of stay <5;
4. Generation 1 born outside EU28, 5<=duration of stay <10; 5. Generation 1 born outside EU28, 10<=duration of stay;
β9 is a set of parameters estimating the labor force returns on education for migrants born
outside the European Union and who arrived at the age of 15 or above (IM15).
A model including parameters β0 to β7 would provide gross participation rates by age, sex, and
education. Implementing β8 and β9 further provides participation rates that are net from
immigration-related characteristics.
It should be noted that immigration variables do not distinguish natives from intra-European migrants. A person born in Germany and living in France, for instance, would have the same parameters as a French native. This assumption, although not ideal, aims at minimizing inconsistencies arising from the fact that intra-European mobility in the projection model does not account for LFP status. Since
1 Individuals in compulsory military service are considered part of the active population.
2 The LFS does not provide information on labor force participation rates in the UK for the age group 70-74. It
was therefore assumed to be half of the value observed for the age group 65-69 for each education level.
3 For Germany, the question on the country of birth is not asked in the LFS. We use the nationality as a proxy
to distinguish EU28 migrants from international immigrants.
4 Generation 1.5: immigrants admitted before the age of 15
7 preliminary models distinguishing intra-European migrants and natives suggested that labor force participation rates of natives and intraEuropean migrants are very similar (average parameter of -0.015), this assumption is unlikely to significantly skew results.
3.3 Analysis of regression results
Figure 1 below shows the average derived probability of being active obtained from the parameters β0 + β1+ β2+ β4 for all EU28 countries, by age, sex, and education for EU-born individuals (the reference
8 Figure 1 – Probability of being active6 for EU-born individuals by age, sex, and highest level of
educational attainment, EU28, 2015
Source: Pooled data of LFS 2010-2015, authors’ calculation
Expectedly, Figure 1 shows that people with higher education levels are much more likely to be active than people with the lowest level of education. This holds true for most age groups and for both sexes, but the education differential is stronger for women. After the age of 60, the gap in the probability of being active between education levels increases: people with high education are more likely to be active than others, and they are active for a longer time. The education gradient is also steeper for women: for middle age adults, the difference in the probability of being active between low and high education is in general less than 15 percentage points for men, while it sometimes exceeds 25 percentage points for women. Similar differences by education level were also found by Loichinger (2015) and by Spielvogel and Meghnagi (2018). Overall, these results stress the importance of integrating the education dimension in projections of labor force participation, especially for countries experiencing population aging and variations across cohorts in terms of human capital.
6 Converted from the average of country specific parameters.
0% 10% 20% 30% 40% 50% 60% 70% 80% 90% 100% 15-19 20-24 25-29 30-34 35-39 40-44 45-49 50-54 55-59 60-64 65-69 70-74
Men
Low Medium High
0% 10% 20% 30% 40% 50% 60% 70% 80% 90% 100% 15-19 20-24 25-29 30-34 35-39 40-44 45-49 50-54 55-59 60-64 65-69 70-74
Women
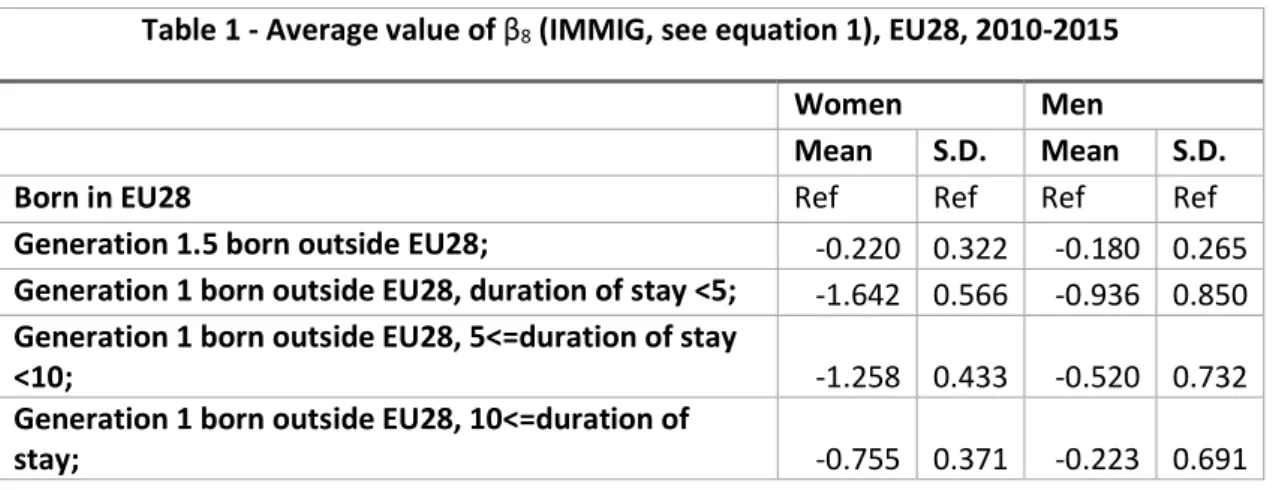
9 Table 1 below shows the average value of β8 (the parameter for the immigration variable, see equation
1) for all EU countries, while Figure 2 shows the sex- and country-specific values of this parameter. Note that thanks to the relatively large sample size, almost all sex- and country-specific parameters are statistically significant at the 0.05 level. Turning to Table 1, we see that the results go in the expected direction. For men, labor force participation for immigrants born outside the EU is much lower than for EU-born individuals (β8=-0.936 for recent immigrants), although it improves with the
number of years spent in the host country. After 10 years, the labor force participation rates of immigrants are close to the rates of EU-born individuals (β8= -0.223), and this holds true in many high
immigration countries (β8=0.063 for Spain, -0.185 for France, -0.040 for Italy and -0.256 for UK; see
Figure 2). However, an important gap remains for immigrants established for a decade or more in some countries, such as Germany (β8=-0.752), Belgium (β8=-0.917) and the Netherland (β8=-1.183). In
Denmark, where immigration inflows are dominated by refugees and family reunification (Liebig 2007), the situation even appears to deteriorate with time. Indeed, β8 drops from -1.078 for recent
immigrants to -1.692 for immigrants admitted more than ten years ago. Conversely, among males, labor force participation rates in Greece and in Luxemburg are higher for immigrants than for natives and are higher for more recent immigrants than for established immigrants. Spain emerges as a special case, no clear differences appear between male immigrants and natives. In any case, it should be kept in mind that only formal immigration is considered, as illegal immigrants are not explicitly surveyed in the EU-LFS.
Table 1 - Average value of β8 (IMMIG, see equation 1), EU28, 2010-2015
Women Men
Mean S.D. Mean S.D.
Born in EU28 Ref Ref Ref Ref
Generation 1.5 born outside EU28; -0.220 0.322 -0.180 0.265 Generation 1 born outside EU28, duration of stay <5; -1.642 0.566 -0.936 0.850 Generation 1 born outside EU28, 5<=duration of stay
<10; -1.258 0.433 -0.520 0.732
Generation 1 born outside EU28, 10<=duration of
stay; -0.755 0.371 -0.223 0.691
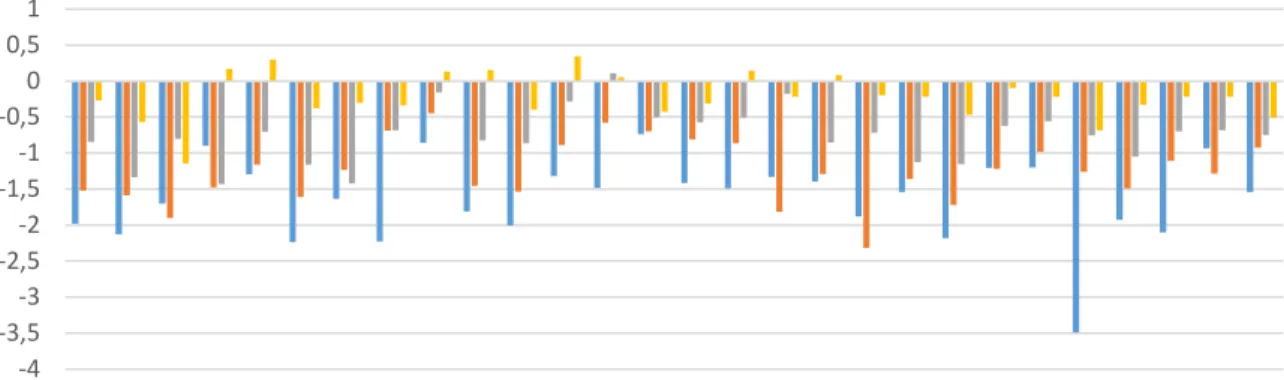
Figure 2 – Value of β8 (IMMIG, ref=Born in EU28; see equation 1), by sex and country of residence,
2010-2015 -2,5 -2 -1,5 -1 -0,5 0 0,5 1 1,5 2 AT BE BG CY CZ DE DK EE ES FI FR GR HR HU IE IT LT LU LV MT NL PL PT RO SE SI SK UK
Men
Generation 1 born outside EU28, duration of stay <5; Generation 1 born outside EU28, 5<=duration of stay <10; Generation 1 born outside EU28, 10<=duration of stay; Generation 1.5 born outside EU28;
10 Participation rates of immigrant women follow similar patterns as for immigrant men, although the gap compared to natives is wider. For recent immigrants born outside the European Union, the average value of β8 for women is more than fifty percent lower than it is for men (β8=-1.642, see Table
1). Even after 10 years, their participation rates are far below the rates of natives (β8=-0.755). In fact,
labor force participation rates of immigrant women do not reach the level of natives in any of the high immigration countries. Gender inequity in terms of labor force participation appears to be an issue affecting immigrant women more strongly than natives, which supports the double disadvantage theory (Ballarino and Panichella 2017; Boyd 1984). These results are also consistent with evidences gathered in the U.S.by Antecol (2000) and in Europe by Pessin & Arpino (2018) concerning the role of cultural background in labor force integration: for some source regions, persistent gender gaps resist explanation based on socio-economic or institutional factors alone.
Immigrants who established themselves before the age of 15 (generation 1.5) have participation rates that are closer to natives for both sexes, although still a bit lower (β8=-0.220 for women and β8=-0.180
for men, see Table 1). This shows some evidence of integration, as their labor force participation rates are much closer to the rates of natives than to the rates of immigrants arrived at an older age. In some countries, however, immigrants from generation 1.5 encounter larger difficulties in the labor force, such as in the Netherland (β8=-0.469 for women and β8=-0.496 for men), in the UK (β8=-0.506 for
women and β8=-0.434 for men) and in Belgium (β8=-0.568 for women and β8=-0.466 for men).
Interestingly, no notable gender gaps remain for generation 1.5 immigrants.
Table 2 shows the average values of parameters for education alone (β2) and for the interaction of
education with a dichotomous variable for generation 1 migrants born outside the EU (β9).
Unsurprisingly, as was already highlighted in Figure 1, education is a major driver of labor force participation and has similar effects for both males and females (see Table 2). However, the effect of education is smaller for immigrants, especially for women. The positive effect on participation rate of having a high education level is about 50% lower for immigrant women when compared to native women. The impact of education on labor force participation is also reduced for male immigrants but less (by about a quarter, see Table 2). These lower returns on education could be partly explained by lower quality degrees in source countries, as well as by cultural differences in the definition of gender roles (Antecol 2000; Inglehart and Norris 2003). Note that although this pattern is observed in most countries, some exceptions still remain. The most notable one is the case of females in the UK, where the parameter for β9 is not statistically significant, suggesting that in this country, the return on
education for natives and immigrants is similar, at least in terms of labor force participation.
-4 -3,5 -3 -2,5 -2 -1,5 -1 -0,5 0 0,5 1 AT BE BG CY CZ DE DK EE ES FI FR GR HR HU IE IT LT LU LV MT NL PL PT RO SE SI SK UK
Women
11 Table 2 – Average value of parameters for education and its
interaction with immigration
Women Men
Level EDU (β2) EDU*IM15 (β9) EDU (β2) EDU*IM15 (β9)
Low -1.753 0.817 -2.005 0.590
Medium -0.753 0.467 -0.751 0.153
3.4 Future labor force participation scenarios7
Equation 1 presented above provides estimates for the 2010-2015 period. For projection purposes, explicit assumptions on future trends in labor force participation are necessary. Assuming constant rates would mean stopping abruptly the current trend in increasing labor force participation of women and of older workers. Cohort developments can be used to project participation rates by calculating entry and exit rates (Carone 2005; Loichinger 2015; Productivity Commission 2005). Increases in participation rates between time t-5 and t between age-group (x,x+4) and (x+5,x+9) mean that cohort participation increases, and entry rates are calculated by dividing positive change in the participation rate by the population at risk, being those of the same cohort that were not working at time t-5:
Entryrate
,=
, ,,
(Eq.2)
where
𝑃𝑅
, is the education- (j) and sex-specific (i) participation rate of age groups8 x to x+4.Similarly, decreases in participation between time t-5 and t between age-group (x,x+4) and (x+5,x+9) signify that cohort participation decreased, and exit rates are calculated by dividing the change in the participation rate by those that were working at time t-5:
Exitrate
,=
, ,,
(Eq.3)
Entry and exit rates by age, sex and education level are calculated for each country, based on participation rates of the years 2010 and 2015 (calculated with β0 to β7 from equation 1). In order to
obtain future participation rate, we used these entry and exit rates to build a labor force participation table for a synthetic cohort with the following equations, using eq.4 below when the entry rate is positive and eq.5 when the exit rate is negative.
PR
,= Entryrate
,∗ PR
− PR
,+ PR
,(Eq.4)
PR
,= 1 − Exitrate
,∗ PR
,(Eq.5)
Entry and exit rates are kept constant between 2020 and 2060, and the participation rate of 2015 is used for the age group 15-19. Participation rates that would be projected to decrease after 2015 are kept at their 2015 values to avoid unrealistically low rates in the future.
7 The authors would like to acknowledge Elke Loichinger for her help in the estimation method of future labor
force participation.
12 In order to assess the effect of immigration on the projected labor force, four scenarios are built.
1- EDU
In this scenario, only labor force participation by age, sex, and education levels are taken into account. A logit regression including β0 to β7 is first performed and the cohort development
method is then applied in order to determine future labor force participation rates. Hence, the projection will not account for immigration-related variables in determining the future labor force. 2- EDU_IMM
In this scenario, immigration-related parameters are added to the model (corresponding to parameters β8 and β9). Entry and exit rates calculated from β0 to β7 are adjusted in consequence
to get future rates by age, sex, and education, net from immigration variables. In other words, we used the complete regression model presented in equation 1 and we used the cohort development method to make evolve the cohort-education labor force participation rates. 3- EDU+
This scenario uses the same parameters as the EDU scenario for the labor force participation, but the inflow of international immigrants (born outside the European Union) is doubled.
4- EDU_IMM+
This scenario uses the same parameters as the EDU_IMM scenario for the labor force participation, but the inflow of international immigrants (born outside the European Union) is doubled. It is assumed that an increase in immigration will not affect labor force participation, an hypothesis consistent with the scientific consensus on the marginal economic impact of immigration (Longhi et al. 2008).
Comparison of the EDU and EDU_IMM scenarios will show the impact of immigration-related differentials in labor force participation in scenario situation where the size and composition of future cohorts of immigrants remain stable. Comparison of the EDU+ and EDU_IMM+ scenarios will further show the extent to which projected labor force participation is sensitive to immigration levels, as immigration-related differentials are taken into account.
The main objective of this paper is to propose a new method in projecting the impact of immigration-related variables on labor force participation. Accordingly, projection assumptions for other components are the same in all four scenarios. The base population is itself built from the 2014-2015 EU-LFS, all rounds of the ESS and Eurostat census data, and includes immigration-related variables such as place of birth (Sabourin et al. 2017). Fertility rates are estimated from logit regressions taking into account, age, education, region of birth, age at immigration, duration of stay, and country of residence and calibrated on future trends estimated in Lutz et al. (2018). The fertility module explicitly takes into account higher fertility for immigrants from some regions such as Sub-Saharan countries and Near and Middle East. The fertility is also higher for recent immigrants, but tends to converge with natives with duration of stay. For immigrants arrived during childhood, fertility levels fall between that of their parents and of the natives. According so, assumptions on the size and composition of international immigration impact indirectly the total fertility rates. Mortality rates by age, sex and educational attainment are taken from Lutz et al. (2018). Assumptions on future educational attainment also take social capital and ethno-cultural characteristics into account (see Marois et al. (2017, 2019) for more details).
To get out-migration rates by sex and country of residence, the average number of out-migrants from 2014 to 2016 (Eurostat table: migr_emi2) was divided by the average population aged 20-34 during the same period. Age-specific out-migration rates are then derived within the microsimulation model as follows. First, the Eurostat derided out-migration rates are applied to the 20-34 population to get the expected number of out-migrants on a given year. The number of out-migrants are then
13 distributed according to age using a Rogers-Castro schedule (Rogers and Castro 1981). Finally, age-specific out-migration rates are obtained by taking the ratio of out-migrants to the population, by age, sex and country of residence. Although it would have been preferable to use country- and type of migration-specific schedule, this option was discarded given the lack of consistent and comparable data provided by Eurostat on migrations. Despite dating from the 80’s, the Rogers-Castro’s multiexponential function estimating the migration schedule is still widely used and provided a good fit (Raymer and Willekens 2008; Rogers 2008). Moreover, since our projection uses 5-years age groups, results are not very sensitive to small variations in the migration schedule.
Out-migration rates in the simulation are recalculated every five years. During the simulation, out-migrants may either move within the EU, and are assigned a new country of residence, or they can leave the EU, in which case their simulation is terminated. The proportion of out-migrants leaving the EU are derived from Eurostat tables on emigration according to region of destination (table: migr_emi3nxt). Origin-destination matrix for intra-European mobility were derived using an update for the period 2009-2016 of Raymer et al.’s (2013) Bayesian estimates of European migration9.
In scenarios EDU and EDU_IMM, the number of international immigrants is assumed to remain constant to average observed during the period 2013-2016 (Eurostat 2018)10. Scenarios EDU+ and
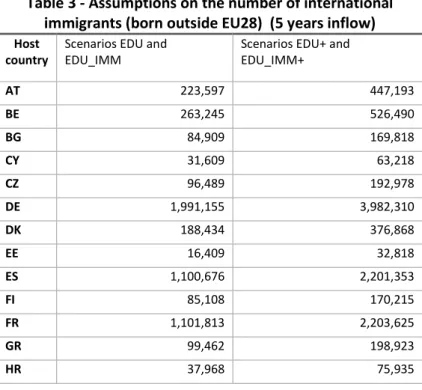
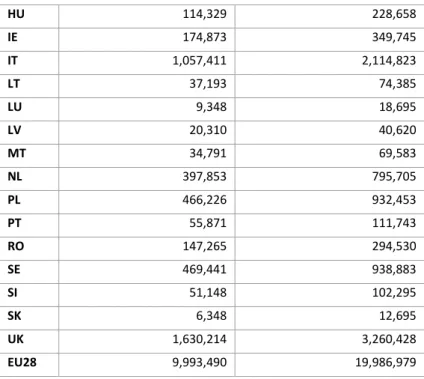
EDU_IMM+ double this number. Furthermore, future cohorts of immigrants have the same characteristics in terms of age, sex education, region of birth, etc. as recent immigrants, which have been estimated from the EU-LFS, the EU-ESS and Eurostat census data. Table 3 presents the number of immigrants assumed in the high and constant immigration scenarios of these projections. These schematic scenarios remain plausible even if EDU+ and EDU_IMM+ doubled the number of immigrants from non-EU countries, since even the high immigration scenarios assume lower immigration rates than what has been observed for several decades in some other developed countries such as Canada and Australia.
Table 3 - Assumptions on the number of international immigrants (born outside EU28) (5 years inflow)
Host
country Scenarios EDU and EDU_IMM Scenarios EDU+ and EDU_IMM+
AT 223,597 447,193 BE 263,245 526,490 BG 84,909 169,818 CY 31,609 63,218 CZ 96,489 192,978 DE 1,991,155 3,982,310 DK 188,434 376,868 EE 16,409 32,818 ES 1,100,676 2,201,353 FI 85,108 170,215 FR 1,101,813 2,203,625 GR 99,462 198,923 HR 37,968 75,935
9 The authors would like to acknowledge Erofili Grapsa for the update of Bayesian estimates of migration
flows.
10 In order to remove from the average the abnormal high immigration inflows resulting from the refugee
14 HU 114,329 228,658 IE 174,873 349,745 IT 1,057,411 2,114,823 LT 37,193 74,385 LU 9,348 18,695 LV 20,310 40,620 MT 34,791 69,583 NL 397,853 795,705 PL 466,226 932,453 PT 55,871 111,743 RO 147,265 294,530 SE 469,441 938,883 SI 51,148 102,295 SK 6,348 12,695 UK 1,630,214 3,260,428 EU28 9,993,490 19,986,979
4. Results
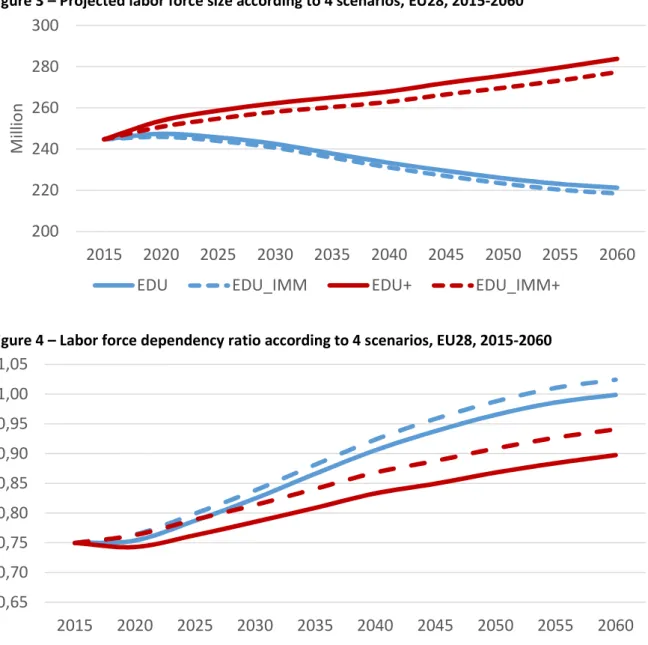
Figure 3 illustrates the projected European labor force for the period 2015- 2060 and Figure 4 shows labor force dependency ratios (LFDR) for the population aged 15 and over for the same period. The LFDR corresponds to the population aged 15 and over out of the labor force divided by the population in the labor force. A ratio of 1 indicates that there is one inactive for each active person in the adult population.
At the EU level, results for EDU (excluding the effect of immigration variables) and EDU_IMM (including the effect of immigration variables) turn out to be approximately the same, with labor force size and participation rates only slightly higher in the EDU scenario. In both scenarios, the size of the labor force decreases. The decline is of about 23.5 million individuals in the scenario EDU (from 244.8 million in 2015 to 221.3 million in 2060) and of 26.3 million for EDU_IMM (218.5 million in 2060). The labor force size in the EDU scenario is larger than in EDU_IMM by 2.8 million, but this represents only 1.3% of the total. The mean percent difference between the projected labor force size of the two scenarios in 2060 for the 28 countries is 1.2%, although it is a bit higher for high immigration countries such as Germany (3.1%). Similar trends are also observed in the projected labor force dependency ratios of the two scenarios. Initially at 0.75 in 2015 the LFDR would go up to 1.00 under the EDU scenario and to 1.02 under the EDU_IMM scenario in 2060. These results support the hypothesis that labor force projections that are omitting immigration variables would slightly overestimate the total labor force size and LFDR. The impact can be considered marginal overall, although it can be more important for high immigration countries.
Given differences in labor force participation by immigrant status, the modest impact of immigration-related variables on the projection results may appear surprising at first, several factors can explain it. First, in the reference scenario immigration levels are relatively low. In the EU as a whole, as mentioned before, international immigration levels are well below what they are in other immigration countries. Second, the negative impact of being an immigrant is strongest during the first decade after arrival in the host country, and the pool of recent immigrants does not grow significantly during the projection. Finally, results at the EU level mask important variations across member states: international immigration is mostly concentrated in a handful of countries.
15 Figure 3 – Projected labor force size according to 4 scenarios, EU28, 2015-2060
Figure 4 – Labor force dependency ratio according to 4 scenarios, EU28, 2015-2060
When assuming higher immigration levels, the impact of immigration-related parameters becomes more apparent. Although both high immigration scenarios reverse the decline of the active population, EDU_IMM+ generates about 6.4 million fewer active individuals than EDU+ at the horizon of the projection, a difference of about 2.3% (Figure 3). In high immigration countries such as Germany, or in countries where the economic integration of immigrants is problematic, such as in Denmark the difference between the two scenarios can be more important with 5.2% differences in Germany and 7.8% in Denmark.
Increasing immigration levels has a direct impact on the size of the labor force, Figure 3 shows that doubling international immigration could prevent a labor force decline. Increasing immigration levels, however, has a much smaller effect on labor force dependency ratios, an indicator more related to the age structure of the population. Indeed, compared to EDU, EDU+ improves the LFDR projected for 2060, but increasing migration does not reverse the strong expected increase in the LFDR. This is in line with demographic literature showing that immigration can only have a marginal and temporary effect on the age structure of the host region, and, as a consequence, can only have a small impact on participation rates (Bijak et al. 2008; Coleman 1992, 2008; Marois 2008).
200 220 240 260 280 300 2015 2020 2025 2030 2035 2040 2045 2050 2055 2060 M ill io n
EDU EDU_IMM EDU+ EDU_IMM+
0,65 0,70 0,75 0,80 0,85 0,90 0,95 1,00 1,05 2015 2020 2025 2030 2035 2040 2045 2050 2055 2060
16 In addition, the gain in the LFDR arising from doubling immigration levels is reduced when introducing immigration-related parameters in the projection. While the difference between EDU to EDU+ is of 0.10 point in 2060, this difference drops to 0.08 point when comparing EDU_IMM to EDU_IMM+. Increasing immigration levels increases the size of the active population, but it also increases the inactive population at a similar pace because labor force participation rates of immigrants are lower, especially for women.
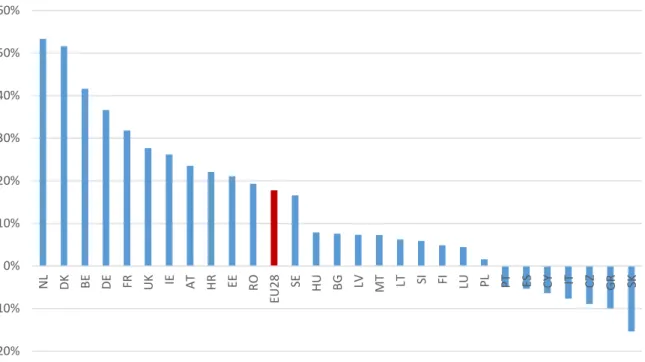
For the EU28 as a whole, about 18% of the reduction in the LFDR from doubling immigration is canceled by factoring in immigration parameters in the projection model. However, this impact varies rather strongly across countries (Figure 5). The impact of doubling international immigration is significantly reduced in most Western European countries. This percentage exceeds 30% in France (32%), Germany (37%), Belgium (42%), Denmark (52%), and Netherland (53%) revealing that in these countries, the younger age structure of new immigrants barely compensate for much lower labor force participation rates. In contrast, when differentials between immigrants and natives in labor force activity are factored in, projected labor force dependency ratios improve in Spain (-5%), Italy (-8%) and Greece (-10%), because in these countries international migrants show higher labor force participation rates than natives.
Figure 5 – Proportion of the reduction in LFDR from doubling immigration canceled by implementing immigration differentials in labor force participation, 2060
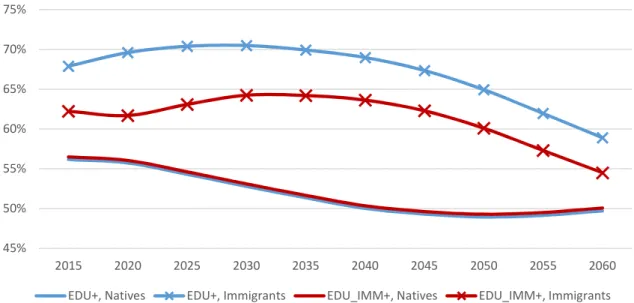
Figure 6 further disaggregates the projections of labor force participation rate by immigrant status (either born inside or outside the European Union) for the two high-immigration scenarios (EDU+ and EDU_IMM+)11. Omitting immigration-related differentials (EDU+, blue lines), immigrant participation
rate exceeds the corresponding rate for natives by 12 to 19 percentage points. Both immigrants and natives see a decline in participation rates due to aging and to the retirement of older cohorts. The higher participation rate of immigrants is mainly the result of a younger age structure associated with the sustained and substantial inflows of new cohorts of young migrants. This advantage could even be higher if the educational attainment of migrants was not inferior to the educational attainment of natives. However, when differentials in participation rates of immigrants and natives are taken is not
11 The reference scenario would give similar results.
-20% -10% 0% 10% 20% 30% 40% 50% 60% N L D K BE DE FR U K IE AT H R EE RO EU 28 SE HU BG LV MT LT SI FI LU PL PT ES CY IT CZ GR SK
17 account, the advantage provided by this younger age structure is reduced by about 30%. From around 12 to 19 percentage points in EDU+ (compare blue lines), the advantage of immigrants decreases to 5 to 13 points in EDU_IMM+ (compare red lines). In other words, a projection that does not take into account for immigrant lower labor force participation would over-estimate the labor force participation rate of immigrants by 5 to 8 percent points (compare dashed lines).
Figure 6 – Projected labor force participation rates (age 15+) for immigrants and natives, EU28, 2015-2060
As we saw earlier for the immigration parameter (β8, see equation 1 above), differences between
immigrants and natives are more important for females than they are for males. Thus, adding immigration differentials to the projection model does not only affect the size of the labor force, but also its composition in terms of immigration status and sex.
We assess the impact of adding the immigration parameters on the sex composition of the immigrant labor force by computing the ratio of the active population projected under the scenarios EDU+ and EDU_IMM+. This is illustrated on Figure 7, for both sexes and all countries12. For the EU as a whole,
the EDU+/EDU_IMM+ ratio for male immigrants is equal to 1.03, meaning that the projected number is overestimated by only 3% when immigration differentials in labor force participation is not accounted for. The ratios for male immigrants are close to one in most Western Europe countries, with the exception of Denmark (1.19) and the Netherland (1.15) where differences in labor force participation are the largest.
For females for the EU as a whole, the ratio reaches 1.15, meaning that a projection that does not account for differentials in labor force participation would overestimate the number of active female immigrants by about 15%. In absolute size, this represents an overestimation of about 6.3 million individuals for EDU+ and 3.3 million individuals for EDU. The impact of immigration differentials on the number of active female immigrants is observable in most countries, and is particularly strong in Netherland (1.32), Belgium (1.31), Germany (1.30), and Denmark (1.26). In Western Europe, only Spain, Italy, Greece, and Portugal do not follow this trend.
12 Again, results for EDU_IMM/EDU are similar to EDU_IMM+/EDU+ and are not presented.
45% 50% 55% 60% 65% 70% 75% 2015 2020 2025 2030 2035 2040 2045 2050 2055 2060
18 Figure 7 – Ratio of the projected number of active immigrants between scenario EDU+ and scenario EDU_IMM+ in 2060, by sex and country
In order to estimate the global impact of immigration parameters on the projected labor force, Mincer-Zarnowitz regressions are performed on the 2060 active population, broken down by age (15-74), sex, and country (Mincer and Zarnowitz 1969). This procedure can be used to compare two sets of data describing the same variable, such as observed and projected values of population counts. In this case, EDU_IMM and EDU (or EDU_IMM+ and EDU+) are compared, such that:
"𝐸𝐷𝑈"(𝑜𝑟 "𝐸𝐷𝑈 + ") =∝ +𝛽 ∗ "𝐸𝐷𝑈_𝐼𝑀𝑀"(𝑜𝑟 "𝐸𝐷𝑈_𝐼𝑀𝑀 + ") (Eq.6)
A parameter β that is statistically different from 1 thus indicates a systematic relative difference between the two scenarios, affecting all countries and all age groups. Table 3 shows the parameter β for different sub-populations. Note that a value of α different from zero would indicate a systematic difference in absolute value between the two scenarios, which would be unexpected (different rates are not expected to yield absolute biases). Indeed, α is not statistically different from zero in any of our comparisons. 0,8 0,9 1 1,1 1,2 1,3 1,4 DK NL RO BE IE SE MT DE CY HR AT LT UK EE EU 28 FR LV HU BG PL LU PT SI FI ES IT CZ SK GR
Males
0,8 0,9 1 1,1 1,2 1,3 1,4 N L BE DE DK FR UK IE RO AT BG EU 28 EE LV HR FI SE HU SK TM LT SI PL LU PT IT CZ GR ES CYFemales
19 Table 3 – Value of β parameters from Mincer-Zarnowitz
regressions
EDU= β *EDU_IMM EDU+= β *EDU_IMM+
Total 1.014*** 1.026*** Females 1.024*** 1.046*** Males 1.003*** 1.006*** Immigrants 1.071*** 1.072*** Females 1.135*** 1.138*** Males 1.014*** 1.014***
Test if β is different from 1. *** p<0.0001
When comparing EDU to EDU_IMM, the value of β for the total active population (1.014) indicates a relatively strong concordance between the two scenarios (a difference of only about 1.4%). Looking at sub-groups, however, reveals more substantial discrepancies. At 1.071, the parameter for the immigrant active population is much larger than one, indicating an average overestimate of 7.1% for EDU compared to EDU_IMM. This systematic overestimation of the immigrant active population is mostly due to female immigrants, for which the active population in EDU exceeds EDU_IMM by 13.5% (β=1.135). The parameters for male immigrants are also statistically significant, but much lower. These patterns hold in the high immigration scenarios (EDU_IMM+ and EDU+).
The above analysis has shown that adding immigration differentials in labor force population projections has a significant negative impact on the number of active female immigrants, while having a modest effect for active male immigrants. This shows that projections yielding similar results at the global level (such as EDU and EDU_IMM, for instance) may still generate significant differences in terms of labor force composition. The analysis of the active population by gender and immigrant status, for instance, could provide relevant insights for the study of intersectional inequalities. In that respect, the case of Greece is particularly informative, as including immigration differentials in the projection has a strong positive impact on the active population of male immigrants, while also having a strong negative impact on the number of active female immigrants.
5. Discussion and conclusion
Issues related to population aging are a matter of population structure rather than population size, as a larger share of the elderly leads to increased public expenditures, especially in terms of health care and pension, and to a proportional decrease in potential workers contributing to the system (United Nations 2015). The labor force participation rate is therefore one of the key indicators for issues related to population aging (European Commission 2015).
In this paper, we analyzed the effect of age, sex, education, generation status and duration of stay in the host country on labor force participation of the European Union population using regression analysis. The results from this regression analysis were then used as inputs to the labor force participation module of CEPAM-Mic, a microsimulation projection model for all EU28 member states. As microsimulation simulates individual life courses, labor force status in the model is stochastically attributed based on the actor’s characteristics and corresponding regression parameters.
By including immigration-related differentials, CEPAM-Mic significantly improves on traditional macro models based on age, sex and education alone. First, CEPAM-Mic can account for different levels of immigrant integration to the labor force. Indeed, patterns of economic integration vary by sex and
20 between EU28 member states, as previously shown in (Kogan 2006) and confirmed in our regression analysis. Second, the model explicitly accounts for different effect of education for natives and immigrants through an interaction variable between educational attainment and immigration status (generation 1 born outside de EU). This takes into account the fact that degrees obtained outside the EU might have a lower value on the labor market. Finally, the model accounts for the impact of immigration on educational attainment, as education is imputed based on immigrant status, education of the mother, religion and language. This is important as education is a major determinant of labor force participation.
Overall, immigration is an important source of population heterogeneity when it comes to the projection of labor force participation. Participation rates are lower for immigrants, especially for recent immigrants and for immigrant women, but tend to improve with increasing duration of stay in the host country. The impact of immigration-related characteristics on labor force participation is often comparable to the impact of education, sometimes even surpassing it. The implementation of immigration-related variables and parameters in a microsimulation model also provides more flexibility in building alternative migration and integration scenarios that may prove relevant and useful to European policy makers.
Analysis of projection outputs confirms that increasing international immigration level can hardly mitigate the expected decline of the general labor force participation rate caused by population aging (Bijak et al. 2008). Although the age structure of immigrants is favorable in the short term, benefits to the labor force are offset by their lower participation rates, especially for women. In line with the analysis provided by Termote (2011), our findings suggest that any policy seeking to use immigration as a tool to fix economic issues arising from population aging must imperatively be accompanied by strong and efficient measures to promote the economic integration of immigrants. When labor force participation rates of immigrants get too low, the effect of increasing immigration can even become negative.
Our results also point to potentially rising gender inequalities in labor force participation. In most EU countries, the gender gap in labor force participation is larger in the immigrant population, even after controlling for education. This provides additional empirical evidences for what Boyd (1984) calls the “double disadvantage”, that of being a woman as well as an immigrant. This double disadvantage leads to an increase in gender imbalance for the projected labor force, even when the impact of immigration on the total labor force is modest. So increasing immigration levels, while obviously increasing the labor force size, may also widen gender inequalities, a trend that goes against the goals set by the European Commission in terms of gender equality (European Commission 2017). Further investigations are needed on this issue, especially considering that the composition of immigration in terms of origin varies greatly from country to country, and that the economic integration of immigrants also varies according to their origin (Gorodzeisky and Semyonov 2017). Policies related to the economic integration of immigrants should therefore put a special focus on the labor force participation of female immigrants.
This paper has focused on a single aspect of the economic integration of immigrants, namely on labor force participation. The issues related to population aging and to the economic integration of immigrants, however, are numerous and are covered by a wide array of indicators. Employment rates and earnings, for instance, are major factors in determining the economic and fiscal impact of immigration, and also intersect with many other issues such as discrimination, over-qualification and international transferability of human capital (Aydemir and Skuterud 2005; Reyneri and Fullin 2011a). These aspects are particularly central to the topic of the economic integration of immigrants. Although Southern European countries yield similar outcomes for immigrants and natives in terms of labor force participation rates, these countries still face several issues in the economic integration of immigrants
21 regarding income, quality of jobs, or overqualification (Fullin and Reyneri 2010; Reyneri and Fullin 2011b). On the other hand, some studies have found that a generous welfare state and strong labor market regulations are likely to decrease participation rates of low-skilled immigrants (such as in Denmark), probably because their incentive to work is reduced, while immigrants and natives yield similar outcomes in terms of labor force participation and employment in more liberal countries such as the USA (Blume et al. 2007; Hansen and Lofstrom 2003; OECD 2016). However, considerable differences remain when looking at poverty rates or earnings. In other words, though the labor force participation rate is obviously an important facet of the economic integration of immigrants, there is no doubt that public policies attempting to address economic integration should also consider indicators related to employment earnings. Demographic projections can however hardly deal with those issues. Indeed, demographic projections provide outcomes on individuals and their characteristics, while employment and earning depend not only several other contextual factors that cannot be project on the long run (economic cycles, international trades, etc.), but also on the actual composition of the population, considering the competition on the labor market.
Finally, we would like to underline the fact that the EU-LFS lacks a certain number of variables that could prove very useful in the assessment of immigrant economic integration. It is not possible in the EU-LFS, for instance, to distinguish natives from second-generation immigrants, thus preventing a thorough analysis of integration across generations. Including the second generation in the study of economic impact of immigration might give different insights, since researches suggested that their economic outcomes vary a lot among countries (Algan et al. 2010). Despite including this information, the European Social Survey is on not usable for the modeling of the labour force giving its small sample size, while microdata of Censuses are not accessible for most countries. Other important information on human capital, beyond educational attainment, are also missing, such as language proficiency and literacy, place of graduation and reasons for immigration. Giving the growing importance of the second generation in the labor force, we argue that including this dimension in further waves of the survey may become a necessity for researchers as well as for policy makers.
Bibliography
Adsera, A., & Chiswick, B. R. (2007). Are there gender and country of origin differences in immigrant labor market outcomes across European destinations? Journal of Population Economics, 20(3), 495. doi:10.1007/s00148-006-0082-y
Alba, R., & Nee, V. (1997). Rethinking Assimilation Theory for a New Era of Immigration. The International Migration Review, 31(4), 826–874. doi:10.2307/2547416
Algan, Y., Dustmann, C., Glitz, A., & Manning, A. (2010). The Economic Situation of First and Second‐ Generation Immigrants in France, Germany and the United Kingdom. The Economic Journal, 120(542), F4–F30. doi:10.1111/j.1468-0297.2009.02338.x
Antecol, H. (2000). An examination of cross-country differences in the gender gap in labor force participation rates. Labour Economics, 7(4), 409–426. doi:10.1016/S0927-5371(00)00007-5
22 Arslan, C., Dumont, J.-C., Kone, Z., Moulan, Y., Ozden, C., Parsons, C., & Xenogiani, T. (2015). A New
Profile of Migrants in teh Aftermath of the Recent Economic Crisis (No. 160). Paris: OECD Publishing.
Aydemir, A., & Skuterud, M. (2005). Explaining the deteriorating entry earnings of Canada’s immigrant cohorts, 1966 - 2000. Canadian Journal of Economics/Revue canadienne d’économique, 38(2), 641–671. doi:10.2307/3696051
Ballarino, G., & Panichella, N. (2017). The occupational integration of migrant women in Western European labour markets. Acta Sociologica, 000169931772344.
doi:10.1177/0001699317723441
Bélanger, A., & Bastien, N. (2013). The future composition of the Canadian labor force: A microsimulation projection. Population and Development Review, 39(3), 509–525. doi:10.1111/j.1728-4457.2013.00614.x
Bélanger, A., & Gilbert, S. (2007). The fertility of immigrant women and their Canadian-born
daughters. In R. Beaujot & D. Kerr (Eds.), The Changing Face of Canada: Essential Readings in Population (pp. 71–86). Toronto: Canadian Scholars’ Press.
Bélanger, A., & Sabourin, P. (2017). Microsimulation and Population Dynamics. An Introduction to Modgen 12 (Vol. 43 2017). Springer International Publishing.
Bélanger, A., Sabourin, P., Marois, G., Vézina, S., Van Hook, J., & Lutz, W. (2018). A microsimulation framework to project ethnocultural diversity and labor force of developed countries. Laxenburg, Austria: IIASA Working Paper.
Bevelander, P. (2005). The Employment Status of Immigrant Women: The Case of Sweden. International Migration Review, 39(1), 173–202. doi:10.1111/j.1747-7379.2005.tb00259.x Beyer, R. C. M. (2016). The Labor Market Performance of Immigrants in Germany. International
Monetary Fund Working Paper.
Bijak, J., Kupiszewska, D., & Kupiszewski, M. (2008). Replacement Migration Revisited: Simulations of the Effects of Selected Population and Labor Market Strategies for the Aging Europe, 2002–
23 2052. Population Research and Policy Review, 27(3), 321–342. doi:10.1007/s11113-007-9065-2
Blume, K., Gustafsson, B., Pedersen, P. J., & Verner, M. (2007). At the Lower End of the Table: Determinants of Poverty among Immigrants to Denmark and Sweden. Journal of Ethnic and Migration Studies, 33(3), 373–396. doi:10.1080/13691830701234517
Borjas, G. J. (2008). Issues in the Economics of Immigration. University of Chicago Press.
Boyd, M. (1984). At a disadvantage: the occupational attainments of foreign born women in Canada. The International Migration Review, 18(4 Special Issue), 1091–1119.
Büchel, F., & Frick, J. R. (2005). Immigrants’ economic performance across Europe - does immigration policy matter? Population Research and Policy Review, 24(2), 175–212.
Carone, G. (2005). Long-term labour force projections for the 25 EU Member States: A set of data for assessing the economic impact of ageing (No. 235). Brussels: European Commission.
http://ec.europa.eu/economy_finance/publications/publication576_en.pdf
Caron-Malenfant, É., Coulombe, S., & Grenier, D. (2017). Demosim: An Overview of Methods and Data Sources. Statistics Canada.
Castles, S., De Haas, H., & Miller, M. J. (2013). The Age of Migration: International Population Movements in the Modern World. Houndmills, Basingstoke, Hampshire: Macmillan International Higher Education.
Cipollone, A., Patacchini, E., & Vallanti, G. (2014). Female labour market participation in Europe: novel evidence on trends and shaping factors. IZA Journal of European Labor Studies, 3(1), 18. doi:10.1186/2193-9012-3-18
Coleman, D. A. (1992). Does Europe Need Immigrants? Population and Work Force Projections. International Migration Review, 26(98), 413–461. doi:doi:10.2307/2547066
Coleman, D. A. (1994). Trends in fertility and intermarriage among immigrant populations in Western Europe as measures of integration. Journal of Biosocial Science, 26(01). doi:10.1017/S0021932000021106
24 Coleman, D. A. (2006). Immigration and ethnic change in low-fertility countries: A third demographic
transition. Population and Development Review, 32(3), 401–446. doi:10.2307/20058898 Coleman, D. A. (2008). The demographic effects of international migration in Europe. Oxford Review
of Economic Policy, 24(3), 452–476. doi:10.1093/oxrep/grn027
de Haas, H. (2018). European migrations: Dynamics, drivers and the role of policies (No. EUR 29060 EN). Luxemburg: Publications Office of the European Union.
http://publications.jrc.ec.europa.eu/repository/bitstream/JRC109783/kjna29060enn.pdf Donato, K. M., Piya, B., & Jacobs, A. (2014). The Double Disadvantage Reconsidered: Gender,
Immigration, Marital Status, and Global Labor Force Participation in the 21st Century. International Migration Review, 48, S335–S376. doi:10.1111/imre.12142
Dustmann, C., Fabbri, F., Preston, I., & Wadsworth, J. (2003). Labour market performance of
immigrants in the UK labour market (Report No. 05/03). London, UK: Research Development and Statistics Directorate, Home Office.
http://www.homeoffice.gov.uk/rds/onlinepubs1.html. Accessed 17 August 2017
Dustmann, C., & Weiss, Y. (2007). Return Migration: Theory and Empirical Evidence from the UK. British Journal of Industrial Relations, 45(2), 236–256. doi:10.1111/j.1467-8543.2007.00613.x European Commission. (2015). The 2015 Ageing Report. Underlying Assumptions and Projection
Methodologies. European Commission, Directorate-General for Economic and Financial Affairs.
European Commission. (2017). 2017 Report on equality between women and men in the EU. European Union.
European Commission, & Economic Policy Committee. (2014). The 2015 Ageing Report: Underlying Assumptions and Projection Methodologies (European Economy No. 8). Brussels: European Commission.
Eurostat. (2017). Migrant integration statistics - education. http://ec.europa.eu/eurostat/statistics-explained/index.php/Migrant_integration_statistics_-_education
25 Eurostat. (2018). Data on demography and migration (Eurostat Statistics Database). Luxembourg:
Eurostat. http://epp.eurostat.ec.europa.eu
Fullin, G., & Reyneri, E. (2010). Low Unemployment and Bad Jobs for New Immigrants in Italy. International Migration, 49(1), 118–147. doi:10.1111/j.1468-2435.2009.00594.x
Gorodzeisky, A., & Semyonov, M. (2017). Labor force participation, unemployment and occupational attainment among immigrants in West European countries. PLOS ONE, 12(5), e0176856. doi:10.1371/journal.pone.0176856
Hansen, J., & Lofstrom, M. (2003). Immigrant Assimilation and Welfare Participation: Do Immigrants Assimilate into or out of Welfare? The Journal of Human Resources, 38(1), 74–98.
doi:10.2307/1558756
Hasselhorn, H. M., & Apt, W. (2015). Understanding Employment Participation of Older Workers : Creating a Knowledge Base for Future Labour Market Challenges (p. 118). Federal Ministry of Labour and Social Affairs.
Hirschman, C. (2001). The educational enrollment of immigrant youth: A test of the segmented-assimilation hypothesis. Demography, 38(3), 317–336.
Inglehart, R., & Norris, P. (2003). Rising Tide: Gender Equality and Cultural Change Around the World. Cambridge: Cambridge University Press.
International Labour Organization. (2011). ILO Estimates and Projections of the Economically Active Population: 1990-2020. Methodological Description. Geneva: Department of Statistics, International Labour Organization.
Kahn, L. M. (2004). Immigration, skills and the labor market: International evidence. Journal of Population Economics, 17(3), 501–534. doi:10.1007/s00148-003-0151-4
Kennedy, S., McDonald, J., & Biddle, N. (2006). The Healthy Immigrant Effect and Immigrant Selection: Evidence from Four Countries (Social and Economic Dimensions of an Aging Population Research Paper). McMaster University.
26 Kogan, I. (2006). Labor Markets and Economic Incorporation among Recent Immigrants in Europe.
Social Forces, 85(2), 697–721. doi:10.2307/4494936
Liebig, T. (2007). The Labour Market Integration of Immigrants in Denmark (OECD Social,
Employment and Migration Working Papers No. 50). Paris: Organisation for Economic Co-operation and Development. doi:10.1787/233783261534
Loichinger, E. (2015). Labor force projections up to 2053 for 26 EU countries, by age, sex, and highest level of educational attainment. Demographic Research, 32(15), 443–486.
doi:10.4054/DemRes.2015.32.15
Loichinger, E., Hammer, B., Prskawetz, A., Freiberger, M., & Sambt, J. (2017). Quantifying economic dependency. European Journal of Population, 33(3), 1–30. doi:10.1007/s10680-016-9405-1 Loichinger, E., & Prskawetz, A. (2017). Changes in economic activity: The role of age and education.
Demographic Research, 36, 1185–1208. doi:10.4054/DemRes.2017.36.40
Longhi, S., Nijkamp, P., & Poot, J. (2008). Meta-Analysis of Empirical Evidence on the Labour Market Impacts of Immigration (SSRN Scholarly Paper No. ID 1136223). Rochester, NY: Social Science Research Network. https://papers.ssrn.com/abstract=1136223. Accessed 4 September 2017 Lutz, W., Butz, W. P., & KC, S. (Eds.). (2014). World Population and Human Capital in the Twenty-First
Century. Oxford, UK: Oxford University Press.
http://ukcatalogue.oup.com/product/9780198703167.do
Lutz, W., Goujon, A. V., KC, S., Stonawski, M., & Stilianakis, N. (2018). Demographic and human capital scenarios for the 21st century: 2018 assessment for 201 countries. Luxembourg: Publications Office of the European Union. doi:10.2760/41776
Marois, G. (2008). La « migration de remplacement » : un exercice méthodologique en rapport aux enjeux démographiques du Québec. Cahiers québécois de démographie, 37(2), 237. doi:10.7202/038132ar
Marois, G., Sabourin, P., & Bélanger, A. (2017). A Microsimulation Approach for Modelling the Future Human Capital of EU28 Member Countries. IIASA Working Paper, WP-17-017.