En vue de l'obtention du
DOCTORAT DE L'UNIVERSITÉ DE TOULOUSE
Délivré par :Institut National Polytechnique de Toulouse (INP Toulouse) Discipline ou spécialité :
Science et Génie des Matériaux
Présentée et soutenue par :
Mme CAITLIN MAE HURLEY
le jeudi 3 septembre 2015
Titre :
Unité de recherche : Ecole doctorale :
ROLE DE L'HYDROGENE DANS LA CORROSION DES ALLIAGES BASE
NICKEL EN MILIEU PRIMAIRE DES REP: ETUDE CINETIQUE DES
MECANISMES D'ABSORPTION ET DE PIEGEAGE
Sciences de la Matière (SDM)
Centre Interuniversitaire de Recherche et d'Ingénierie des Matériaux (C.I.R.I.M.A.T.) Directeur(s) de Thèse :
M. ERIC ANDRIEU MME CHRISTINE BLANC
Rapporteurs :
M. ALAN TURNBULL, NATIONAL PHYSICAL LABORATORY M. XAVIER FEAUGAS, UNIVERSITE DE LA ROCHELLE
Membre(s) du jury :
1 M. DAVID DELAFOSSE, ECOLE NLE SUP DES MINES SAINT ETIENNE, Président
2 M. DANIEL CAILLARD, CEMES TOULOUSE, Membre
2 M. ERIC ANDRIEU, INP TOULOUSE, Membre
Membres du jury invit´es :
Pr. Christine BLANC (ENSCIACET-CIRIMAT) and
Thanks - Remerciments
I would like to first thank all of the defense committee members, Pr. Xavier Feau-gas, Dr. Alan Turnbull, Pr. Hannu H¨anninen, Pr. David Delafosse and D.R. Daniel Caillard, who have graciously accepted to be a part of this committee and to have read, judged and provided feedback on this manuscript.
Dans un premier temps, je tiens `a remercier tous les membres de jury: Pr. Xavier Feaugas, Dr. Alan Turnbull, Pr. Hannu H¨anninen, Pr. David Delafosse et D.R. Daniel Caillard, d’avoir accept´e gracieusement de participer `a ce jury de th`ese et d’avoir lu, jug´e et donn´e leur avis sur le manuscrit.
Je vais ´ecrire le reste en fran¸cais car si j’´ecris
en anglais il va falloir qu’un “native English speaker” le relis...
Je remercier particuli`erement Dr. Frantz Martin et Dr. Lo¨ıc Marchetti, co-encadrants de cette th`ese et chercheurs respectivement au CEA de Saclay et de Marcoule, pour leur encadrement impeccable, leur conseils, leur gentillesse et bonne humeur mais surtout pour leur confiance en moi. J’aimerais aussi remercier D.R. Jacques Chˆene, ´egalement co-encadrant de cette th`ese, pour son aide, ces conseils et les discussions. Vous m’avez tout appris sur l’hydrog`ene et sur les ac-teurs et films am´ericains (i.e. le great Robert Redford). Je ne sais pas o`u je serais sans vous trois. Vous avez form´e vraiment la meilleur ´equipe, la “Dream Team” des encadrants.
Je remercie Pr. Christine Blanc et Pr. Eric Andrieu, co-directeurs de cette th`ese et professeurs `a l’INP de Toulouse (ENSIACET-CIRIMAT), pour tous leurs conseils et leur aide durant ces trois ans. Malgr´e la distance j’ai beaucoup appr´eci´e travailler avec vous.
Je tiens `a remercier toute la fine ´equipe du Laboratoire d’Etude de la Corrosion Aqueuse et les ex-membres de l’´equipe du CEA de Saclay avec qui j’ai eu vraiment la chance de partager ces trois ans. Je vous suis reconnaissante pour votre accueil chaleureux le 2 octobre 2012. Merci de m’avoir inclue toute de suite dans la vie du laboratoire. Je n’oublierai jamais le labyrinthe du bˆatiment 458, les heures pass´ees dans la salle caf´e en train de rigoler et parler de tout et n’importe quoi, les sorties du labo comme l’accrobranche et la randonn´ee des vingt-cinq bosses (“coureur!”), l’´equipe du LECADORS/LECA D’OR pour la course de la fˆete de la musique et du sport du CEA et nos midis sportifs dans les bois autour du centre. C’est grˆace `a vous tous que ces trois derni`eres ann´ees ´etaient si bien pass´ees...je n’ai pas les mots en fran¸cais ni en anglais pour vous exprimer toute ma reconnaissance et ma joie d’avoir ´et´e avec vous. Un petit mot, en plus, pour ma coll`egue et proche amie, Elizabeth (Chaumun) Deneuvillers, pour son soutien et son amabilit´e (et les cˆalins quand la journ´ee ´etait difficile et stressante).
´
Egalement, je souhaite remercier toutes les personnes en dehors du laboratoire avec qui j’ai eu la chance de travailler au cours des trois ans : Dr. Clara Desgranges (LM2T, pour ses conseilles et l’aide avec la num´erique), Mme. Marie Christine Lafont (CIRIMAT-ENSIACET, pour les observations MET), M. Bruno Coltrinari (pour les ampoules en quartz), M. Daniel Nunes (pour son aide avec les traitements thermiques), l’´equipe d’OCAS NV `a Gand (pour leur aide, t´enacit´e et patience sur nos essais), toutes personnes avec qui j’ai travaill´e pendant la semaine `a Toulouse ansi que les personnes avec qui j’ai pu discuter durant cette p´eriode, vous ˆetes trop nombreux pour ˆetre tous nomm´es, mais sachez que votre aide a ´et´e inestimable.
Ces trois ans n’auraient pas ´et´e possible sans mes amis parisiens et surtout “les tards”: Sara, Michelle, Mich`ele, Fernando, Paolo et Guillaume...les amis qui sont devenus ma famille au cours des derni`eres ann´ees. Mˆeme de loin je resterais toujours votre petite Cutelin. Je n’ai aucun souvenir partag´e avec vous qui n’est pas rempli de bonheur, de sourires et de rire. Aussi, un petit mot et thank you pour mon copain, je te remercie mille fois pour ton soutien, ta s´er´enit´e, de m’avoir support´e et d’avoir partag´e cette exp´erience (mˆeme parfois de loin) avec moi...and now `a le prochain chapitre.
Finally, I would like to thank my family and friends back home for all they have done, even from a far. You have always pushed me to be my best and it is thanks to all your support over the past twenty-six years that this was all possible.
P.S. pour tous qui se demandent...Nabilla n’est pas morte.
R´esum´e
Dans les r´eacteurs nucl´eaires `a eau pressuris´ee (REP) encore en service dans le parc nucl´eaire civil fran¸cais, certaines pi`eces en contact avec le milieu du circuit primaire, comme les ´el´ements constitutifs des tubes de g´en´erateurs de vapeur (en alliage base nickel A600) ou les internes de cuve (en acier inoxydable 316L), sont sujettes `a des ph´enom`enes de corrosion sous contrainte (CSC). La mise en ´evidence exp´erimentale de la fissuration par CSC de l’alliage A600, r´eput´e r´esistant, a con-duit `a de nombreuses ´etudes consacr´ees `a la description et `a la compr´ehension de ce ph´enom`ene de CSC en milieu primaire des REP. Dans l’optique d’un allonge-ment de la dur´ee de vie des r´eacteurs en service, il est rapideallonge-ment devenu critique et strat´egique de pouvoir mod´eliser ces ph´enom`enes de CSC, afin d’optimiser les mat´eriaux, conditions de fonctionnement etc. et d’appr´ehender les param`etres critiques pour limiter la CSC des composants.
Cette ´etude s’int´eresse au rˆole de l’hydrog`ene dans le ph´enom`ene de CSC et plus particuli`erement aux interactions H-mat´eriau. En effet, l’hydrog`ene, venant du milieu primaire (H dissous ou H de l’eau), peut ˆetre absorb´e par l’alliage pen-dant le processus d’oxydation au cours du fonctionnement du r´eacteur. Une fois absorb´e, H peut ˆetre transport´e `a travers le mat´eriau, interagissant `a la fois avec les sites interstitiels du r´eseau cristallin et des d´efauts locaux, comme les dislo-cations, les pr´ecipit´es, les lacunes, etc. La pr´esence de ces sites peut ralentir le transport de l’hydrog`ene et provoquer une accumulation locale d’hydrog`ene dans l’alliage. Cette accumulation pouvant modifier les propri´et´es m´ecaniques locales du mat´eriau et favoriser sa rupture pr´ematur´ee, il est essentiel d’identifier la nature de ces interactions H-mat´eriau, et plus particuli`erement la vitesse de diffusion et les cin´etiques de pi´egeage de l’hydrog`ene sur ces d´efauts.
Concernant ces interactions H-pi`ege, la litt´erature propose tr`es peu de donn´ees cin´etiques compl`etes ; il est donc n´ecessaire d’´etudier et caract´eriser ces interac-tions finement. Ce travail est compos´ee de deux parties interd´ependantes : (i) le d´eveloppement d’un code de calcul capable de g´erer les interactions H-mat´eriau et (ii) l’extraction les donn´ees cin´etiques de pi´egeage et de d´epi´egeage `a partir de r´esultats exp´erimentaux afin d’alimenter le code de calcul et cr´eer une base de donn´ees fiable.
Du fait de la complexit´e des mat´eriaux industriels (A600 et 316L), des “mat´eriaux mod`eles” ont ´et´e ´elabor´es en utilisant une s´erie de traitements thermom´ecaniques permettent d’´etudier des syst`emes simples et de d´ecorr´eler les diff´erentes contribu-tions possibles entre hydrog`ene interstitiel et pi´eg´e. Ces ´echantillons ont ´et´e charg´es en deut´erium (traceur isotopique de l’hydrog`ene) par polarisation cathodique. Apr`es chargement, les ´echantillons ont ´et´e soumis `a un essai de spectroscopie de
d´esorption thermique (TDS) o`u le flux de d´esorption de deut´erium est enregistr´e pendant une rampe de temp´erature et/ou un isotherme. L’extraction des donn´ees de diffusion interstitielle et des constantes cin´etiques de pi´egeage se fait par une d´emarche d’ajustement des spectres exp´erimentaux obtenus par TDS acquis sur les “mat´eriaux mod`eles” en utilisant un code de calcul bas´e sur la r´esolution num´erique des ´equations de McNabb et Foster.
Grˆace `a cette ´etude, les coefficients de diffusion de l’hydrog`ene ont pu ˆetre d´etermin´es dans deux alliages (A600 et 316L) sur une grande gamme de temp´eratures. Les constantes cin´etiques relatives au pi´egeage et au d´epi´egeage sur deux types de pi`eges (d´efauts), les carbures de chrome et les dislocations, ont ´et´e d´etermin´ees. Ces constantes constituent une base de donn´ees qui sera int´egr´ee dans un mod`ele num´erique plus large visant `a simuler les ph´enom`enes de CSC dans les REP.
Mots cl´es : alliage base nickel, alliage inoxydable, corrosion sous contrainte, diffu-sion, hydrog`ene, pi´egeage, spectroscopie de d´esorption thermique
Summary
In France all of the nuclear power plant facilities in service today are pressur-ized water reactors (PWR). Some parts of the PWR in contact with the primary circuit medium, such as the steam generator tubes (fabricated in nickel base al-loy A600) and some reactor core internal components (fabricated in stainless steel 316L), can fall victim to environmental degradation phenomena such as stress cor-rosion cracking (SCC). In the late 1950’s, H. Coriou observed experimentally and predicted this type of cracking in alloys traditionally renowned for their SCC re-sistance (A600). Just some 20 to 30 years later his predictions became a reality. Since then, numerous studies have focused on the description and comprehension of the SCC phenomenon in primary water under reactor operating conditions. In view of reactor lifetime extension, it has become both critical and strategic to be capable of simulating SCC phenomenon in order to optimize construction materi-als, operating conditions, etc. and to understand the critical parameters in order to limit the damage done by SCC.
This study focuses on the role hydrogen plays in SCC phenomenon and in particular H-material interactions. Hydrogen, from primary medium in the form of dissolved H gas or H from the water, can be absorbed by the alloy during the oxidation process taking place under reactor operating conditions. Once absorbed, hydrogen may be transported across the material, diffusing in the interstitial sites of the crystallographic structure and interacting with local defects, such as dislo-cations, precipitates, vacancies, etc. The presence of these [local defect] sites can slow the hydrogen transport and may provoke local H accumulation in the alloy. This accumulation could modify the local mechanical properties of the material and favor premature rupture. It is therefore essential to identify the nature of these H-material interactions, specifically the rate of H diffusion and hydrogen trapping kinetics at these defects. Concerning these H-trap site interactions, lit-erature presents very few complete sets of kinetic data; it is therefore necessary to study and characterize these interactions in-depth. This work is composed of two interdependent parts: (i) the development of a calculation code capable to manage these H-material interactions and (ii) to extract the kinetic constants for trapping and detrapping from experimental results in order to fuel the simulation code and create a solid database.
Due to the complexity of industrial materials (A600 and SS316L), “model ma-terials” were elaborated using a series of thermomechanical treatments allowing for the study of simplified systems and the deconvolution of the different possible trapped and interstitial hydrogen contributions. These “model” specimens were charged with deuterium (an isotopic hydrogen tracer) by cathodic polarization.
Af-ter charging, specimens were subjected to thermal desorption mass spectroscopy (TDS) analysis where the deuterium desorption flux is monitored during a tem-perature ramp or at an isotherm. Interstitial diffusion and kinetic trapping and detrapping constants were extracted from experimental TDS spectra using a nu-merical fitting routine based upon the nunu-merical resolution of the McNabb and Foster equations.
This study allowed for the determination of the hydrogen diffusion coefficient in two alloys, Ni base alloy 600 and stainless steel 316L, and the kinetic trapping and detrapping constants at two trap site types, chromium carbides and dislocations. These constants will be used to construct a kinetic database which will serve as input parameters for a numerical model for the prediction and simulation of SCC in PWRs.
Key words: diffusion, hydrogen, nickel base alloy, stainless steel, stress corrosion cracking, thermal desorption mass spectroscopy, trapping
Contents
1 Introduction 41
1.1 Context and objectives . . . 43
1.2 PWR operation . . . 44
1.3 Hydrogen and Stress Corrosion Cracking . . . 45
1.4 Manuscript objectives and organization . . . 46
2 Literature Review 47 2.1 Stress Corrosion Cracking in NPPs . . . 49
2.2 Role of hydrogen in SCC . . . 51
2.3 Hydrogen absorption mechanisms . . . 52
2.3.1 Hydrogen absorption in gaseous environments . . . 53
2.3.2 Hydrogen absorption in aqueous environments: cathodic charg-ing . . . 53
2.3.3 Hydrogen absorption mechanisms in primary water . . . 54
2.4 Hydrogen diffusion and trapping in metals . . . 55
2.4.1 Diffusion interactions . . . 56
2.4.2 Trapping interactions . . . 63
2.4.3 Models describing hydrogen - trap site interactions . . . 74
2.5 Experimental analysis of H-material interactions . . . 81
2.5.1 A brief review of common methods . . . 81
2.5.2 Thermal desorption mass spectroscopy . . . 85
2.5.3 TDS spectral analysis . . . 85
2.6 Conclusions . . . 92
3 Materials and Method 95 3.1 Model material fabrication & characterization . . . 97
3.1.1 Material characterization techniques . . . 99
3.1.2 As-received material characterizations . . . 101
3.1.3 Pure diffusion system (PDS) . . . 103
3.1.4 Diffusion and trapping system - Dislocations . . . 110
3.1.6 Material overview . . . 116
3.2 Experimental method: TDS . . . 119
3.2.1 Sample preparation: mechanical polishing . . . 119
3.2.2 Sample preparation: deuterium (2H) charging . . . 120
3.2.3 TDS testing . . . 123
3.2.4 TDS calibration . . . 125
3.3 Numerical simulation method . . . 128
3.3.1 Mathematical model and simulation approach . . . 130
3.3.2 Experimental parameters . . . 131
3.3.3 Trapping parameters . . . 138
3.3.4 Simulation advancements . . . 146
3.3.5 Conclusions on numerical simulation method . . . 147
3.4 Chapter summary . . . 148
4 Results 149 4.1 Deuterium charging of Model Materials . . . 151
4.2 Experimental TDS observations . . . 153
4.2.1 TDS spectra immediately after 2H charging . . . 153
4.2.2 TDS spectra after aging . . . 160
4.3 Numerical simulation . . . 178
4.3.1 Diffusion coefficient derivation . . . 179
4.3.2 Deriving kinetic trapping and detrapping constants . . . 195
4.4 Brief conclusions . . . 208
5 Discussion and Perspectives 211 5.1 2H Diffusion in A600 and SS316L . . . 213
5.2 2H Trapping in A600 . . . 216
5.2.1 Comments on derived activation energies (Ek, Ep) and their relation to the activation energy of interstitial diffusion (ED) 216 5.2.2 Trapping at chromium carbides . . . 219
5.2.3 Trapping at dislocations . . . 223
5.2.4 General comments on k′ 0/p0 relationship . . . 223
5.2.5 Trap site density . . . 224
5.3 Technical perspectives . . . 226
5.3.1 Effect of charging solution . . . 226
5.3.2 TDS system improvements . . . 227
5.4 Scientific perspectives . . . 228
5.4.1 Model materials . . . 228
6 Conclusions 235
6.1 General overview of the study . . . 237
6.2 Final conclusions . . . 238
7 R´esum´e en fran¸cais 243 7.1 Contexte et objectifs . . . 245
7.1.1 Principe de fonctionnement d’un REP . . . 245
7.1.2 Hydrog`ene et corrosion sous contrainte . . . 247
7.1.3 Plan et objectifs du manuscrit . . . 249
7.2 Etat de l’art : r´esum´e . . . 249
7.3 Mat´eriaux et M´ethodes: r´esum´e . . . 251
7.3.1 Mat´eriaux . . . 251
7.3.2 Technique exp´erimentale et m´ethode num´erique . . . 252
7.4 R´esultats : r´esum´e . . . 255
7.4.1 Observations exp´erimentales issues des spectres TDS . . . . 256
7.4.2 Simulation de la diffusion de2H dans l’A600 et le SS316L . . 258
7.4.3 Simulation du pi´egeage de 2H dans l’alliage 600 . . . 262
7.5 Conclusions . . . 266
7.5.1 Vue d’ensemble des r´esultats obtenus dans le cadre de cette ´etude . . . 267
List of variables
Variable units name
α – near neighbor factor
αs – segregation factor pre-exponential factor
αc TS.cm−2 interface trap sites per interface surface area αd TS.cm−1 dislocation trap sites per dislocation length
γ – hydrogen atom jump probability
δ nm grain boundary width
ǫ % deformation percent
˙ε s−1 deformation rate
θ – fraction of occupied traps
θL – fraction of occupied lattice sites
θx – fraction of occupied trap sites
λ nm lattice spacing in the matrix µ mol H.mol A600−1 interstitial hydrogen concentration ¯
µ GPa shear modulus
µ0 mol H.mol A600−1 hydrogen surface concentration
π – Pi
ρdislocations cm−2 dislocation density
τ s relative time of H transfer from one site to another
φ K.min−1 temperature ramp rate
ψ – trap capture probability
A – trap site “activity”
b nm Burger’s vector
c0 mol.cm−3 hydrogen surface concentration cf mol.cm−3 interstitial hydrogen concentration
cL mol.cm−3 local interstitial hydrogen concentration
ct0 TS.cm−3 concentration of all trap sites cT mol.cm−3 total local hydrogen concentration
cx mol.cm−3 local trapped hydrogen concentration ¯
C kJ.mol−1 hydrogen chemical potential
d µm average grain size
¯
d cm average diameter
D cm2.s−1 diffusion coefficient
Dapp cm2.s−1 apparent diffusion coefficient Deff cm2.s−1 effective diffusion coefficient
DGB cm2.s−1 grain boundary diffusion coefficient DH cm2.s−1 diffusion coefficient of hydrogen
Disotope cm2.s−1 diffusion coefficient of a hydrogen isotope D0 cm2.s−1 diffusion pre-exponential constant
E V potential
EB kJ.mol−1 trap site binding energy
E′
B kJ.mol−1 novel trap site binding energy
ED kJ.mol−1 diffusion activation energy
Ek kJ.mol−1 trapping activation energy
Ep kJ.mol−1 detrapping activation energy
Es kJ.mol−1 chemical potential difference between an octahedral site and a site in the grain boundary
f – volume fraction of grain boundaries ¯
f C.mol−1 Faraday constant
˜
f cm2 “permeablity”
F mol.s−1 flux
¯
G kJ trap site enthalpy
i A ionic current
j mA.cm−2 current density
k s−1 trapping kinetic constant
k0 s−1 trapping pre-exponential constant k′
0 cm3.s−1 trapping pre-exponential constant kB m2.kg.s−2.K−1 Boltzmann constant
K – equilibrium constant for trapped and interstitial hydrogen populations
Kd – factor which considers dislocations which lie parallel to thin foil normal
¯l – mean linear intercept of grains
L cm specimen thickness
Ldislocatoin cm dislocation length
m/z – mass to charge ratio (MS)
mH mass of hydrogen
misotope mass of hydrogen isotope
¯
n mol.cm−3 total hydrogen concentration N mol TS.mol material trap site density
N′
c mol TS.cm−3 chromium carbide trap site density N′
d mol TS.cm−3 dislocation trap site density NL sites.cm−3 density of intersitital sites
p s−1 detrapping kinetic constant ¯
p – volumic proportion of a site around a point in matrix
p0 s−1 trapping pre-exponential constant
Qtotal mol TDS spectrum integral
R kJ.K−1.mol−1 ideal gas constant
s – segregation factor
S mol.cm−3 solubility of hydrogen in a matrix
t s time
tcharging s charging time
taging s aging time
td s time before testing (aging time)
tf s final time
ts s charging time
ttransfer s transfer time
T K temperature
T0 K temperature at start of TDS testing
Taging K aging temperature
Tcharging K charging temperature
Td K temperature before testing (aging temperature)
Tf K final temperature
Tiso-HT K temperature f high temperature isotherm
Tiso-RT K temperature of room temperature isotherm
Tm K temperature of maximum desorption flux (TDS)
Ts K charging temperature
Ttransfer K transfer temperature
Vimage cm3 (microscope) image volume
Vm cm3.mol−1 molar volume
x (cm) for position coordinates
XC cm location of “trapping front” in material
y (cm) for coordinates
yt (cm.s−1) “unknown” trapping parameter
yt0 (cm.s−1) “unknown” trapping parameter prefactor z (cm) for position coordinates
List of abbreviations
Abbreviation full name2H deuterium
3H tritium
A600 Nickel base Alloy 600
AR As-Received
bcc body centered cubic BWR Boiling Water Reactor CE Counter Electrode
CEA Atomic Energy Commission (France) CEPM Corrosion Enhanced Plasticity Model CrxCy Chromium carbides
DFT Density Functional Theory
DSC Differential Scanning Calorimetry DTS Diffusion and Trapping System
EDM Electrical Discharge Machining (spark erosion) EDS Energy Dispersion X-ray Spectroscopy
ENS Elastic Neutron Scattering EP Electrochemical Permeation fcc face centered cubic
FEG Field Emission Gun GB Grain Boundary
GBC Grain Boundary Carbides
GND Geometrically Necessary Dislocations Habs absorbed hydrogen
Hads adsorbed hydrogen Hco H in commercial SS316L HHT H in heat treated SS316L HE Hydrogen Embrittlement
HEDE Hydrogen Enhanced DEcohesion
HELP Hydrogen Enhanced Localized Plasticity
HESV Hydrogen Enhanced Stress Induced Vacancy (mechanism) HSLA High Strength Low Alloyed (steel)
IASCC Irradiation Assisted Stress Corrosion Cracking IIC Inter- Intragranular Chromium carbides HP High Pressure
LAC Low-Alloy Carbon (steel)
LECA Aqueous Corrosion Laboratory (CEA-Saclay) LECNA Non-Aqueous Corrosion Laboratory (CEA-Saclay) LEM Local Equilibrium Model
LWR Light Water Reactor
M Metal
MM Model Material n.s. non-specified
NEM Non-Equilibrium Model NPP Nuclear Power
NUS Non-Uniform Solubility (model) OM Optical Microscope
PAS Positron Annihilation Spectroscopy PDS Pure Diffusion System
PWR Pressurized Water Reactor
Py PythonTM
RE Reference Electrode RSW Resistive Spot Welding s.c. single crystal
SEM Scanning Electrom Microscope SG Steam Generator (tubes) SCC Stress Corrosion Cracking SS316L Stainless Steel 316L
TDS Thermal Desorption mass Spectroscopy TEM Transmission Electron Microscopy TiCN Titanium Carbo-Nitrides
TPD Temperature Programed Desorption
TS Trap Site
TT Thermal Treatment WE Working Electrode WM WolframMathematica¥c XRD X-Ray Diffraction
List of Model Materials
Notation Complete descriptionA600-AR As Received nickel base Alloy 600
A600-PDS nickel base Alloy 600 Pure Diffusion System
A600-DTS-D-20T nickel base Alloy 600 Diffusion and Trapping System with Dislocations created by a 20 % deformation by interrupted Tensile testing as the major trap sites A600-DTS-D-40T nickel base Alloy 600 Diffusion and Trapping System
with Dislocations created by a 40 % deformation by interrupted Tensile testing as the major trap sites A600-DTS-GBC nickel base Alloy 600 Diffusion and Trapping System
with chromium carbides inter- and intragranularly A600-DTS-IIC nickel base Alloy 600 Diffusion and Trapping System
with chromium carbides inter- and intragranularly A600-like s.c. model nickel base Alloy 600 Single Crystal
SS316L-AR As Received Stainless Steel 316L
SS316L-PDS Stainless Steel 316L Pure Diffusion System
SS316L-DTS-D-20T Stainless Steel 316L Diffusion and Trapping System with Dislocations created by a 20 % deformation by interrupted Tensile testing as the major trap sites SS316L-DTS-D-40T Stainless Steel 316L Diffusion and Trapping System
with Dislocations created by a 40 % deformation by interrupted Tensile testing as the major trap sites
List of Figures
1.1 Map of localization of nuclear reactors in France (www.world-nuclear.org) 43 1.2 Typical Pressurized Water Reactor design (www.world-nuclear.org). 44 1.3 Diagram of potential hydrogen diffusion and trapping sites in a
crys-talline material: (a) interstitial site, (b) surface and (c) subsurface sites, (d) grain boundaries, (e) dislocations and stress fields and (f) vacancies [1]. . . 46 2.1 Stress corrosion crack in Ni base alloy 600 after exposure in high
temperature water [2]. . . 50 2.2 Fracture surfaces of Ni-base alloy X-750 specimens tested in (a)
hydrogenated gas at 611 K and (b) hydrogenated water at 633 K [8]. 51 2.3 Schematic energy diagram for interstitial diffusion in a fcc material. 57 2.4 Room temperature (a) permeation and (b) degassing data in (i)
single crystal (ii) small (25 µm) grain, (iii) large (150 µm) grain and (iv) in (b) cold worked pure Ni specimen showing the influence of microstructure (specifically grain size) on diffusivity and hydrogen flux [54]. The simulated Fick’s diffusion profiles for constant H concentration and constant H flux can also be seen in (b) [54]. . . . 58 2.5 Audioradiographs of a polycrystalline pure nickel specimen exposed
46 h at 253 K to tritium (a) after 24 h of aging and (b) after 10 days of aging [53] at 253 K. The light areas highlight the location of tritium in the specimen. . . 59 2.6 High temperature (373 K) permeation in (i) small (25 µm) grain,
(ii) large (150 µm) grain and (iii) in (b) cold worked pure Ni spec-imen as compared to Fick’s diffusion profile showing the influence of microstructure (specifically grain size) on diffusivity. . . 60 2.7 Effective diffusion coefficient (Deff) of H in high purity (99.99%)
polycrystalline Ni (grain size 10 nm - 168 µm) at 298 K with regards to grain size as reported by Oudriss et al. [57]. . . 61 2.8 Arrhenius plot of [corrected (Eq. (2.8) [65])]diffusion data for H and
its isotopes in Ni-base alloy 600 [40, 41, 42, 43] and (b) in stainless steel 316L [44, 45, 46, 47, 48]. . . 63
2.9 Schematic diagram of diffusion and trapping at (a) one TS or (b) at two TS. E1
k and Ek2 and Ep1 and Ep2 are the respective trapping and detrapping activation energies associated with the trap site types. . 64 2.10 Trap model energy schematic diagram as presented by Oriani [69].
In this diagram λ refers to the lattice spacing in the matrix. . . 65 2.11 (a) Electrochemical permeation curves for recrystalized, single
crys-tal and 98 % cold worked pure Ni specimen and (b) decreased dif-fusivity of H in a HSLA steel in function of cold working percent [73] at 293 K. . . 66 2.12 (a) Early-stage tritium desorption from small grained, large grained
and 98 % predeformed pure Ni specimen measured by β counting at 298 K and (b)3H desorption from a pre-charged (in tritiated molten salts) γ-Ni base alloy single crystal during tensile testing measured by liquid scintillation counting [73]. . . 67 2.13 Thermal desorption mass spectroscopy analysis results for
hydrogen-vacancy clusters in Ni. The first desorption peak was associated with interstitial diffusion and the two higher temperature peaks were attributed to H binding with vacancies [79]. . . 68 2.14 Schematic diagram for diffusion and “physical” trapping in the
lat-tice. Two types of “physical” TS are represented (Type 2 and Type 3) along with normal lattice sites (Type 1). All sites have the same potential energy barrier (dotted line), and therefore the H has the same capture probability (ψ) for all sites [112]. . . 78 2.15 Electrochemical permeation cell diagram. The set-up is split into
two electrochemical cells exposing the specimen, the working elec-trode (WE) to a cathodic environment on the ”entry side” and an-odic environment on the ”exit side” (CE = counter electrode, RE = reference electrode, Hads = adsorbed H, Habs = absorbed H, and
diff
−→ = Habs diffusion across the membrane). . . 83 2.16 Example desorption spectra for a (a) TPD spectrum acquired by M.
Mendelsohn et al. on hydrogenated zirconium alloy specimen where system pressure evolution was measured in function of time during a temperature ramp [133] and (b) TDS spectrum acquired by E. Tal-Gutelmacher et al. on hydrogenated titanium alloy specimen [139] . . . 86
2.17 Example of (a) spectral acquisitions1 for “Choo-Lee plot” construc-tion and analysis and (b) Gaussian decomposiconstruc-tion of an experimen-tal spectrum [141]. . . 88 2.18 “Choo-Lee” plot analysis for the “TDS” spectra presented in Fig. 2.17
[141]. . . 88 3.1 Schematic diagram of the NanoTest pendulum. [Original design-[146]]101 3.2 OM image of A600 heat WL344 (Imphy) in its as received material
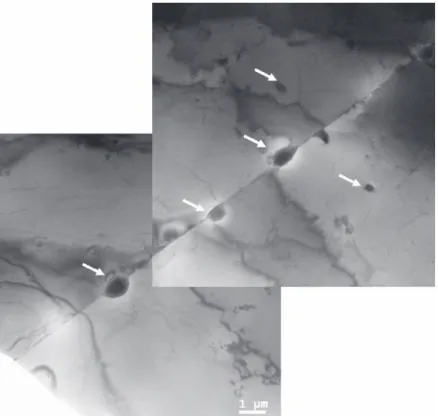
state. The small black spots seen in the image are chromium carbide (CrxCy) precipitates and the larger more angular black structures have been identified as TiCN by SEM-EDS analysis. . . 102 3.3 SEM image of the as-received commercial grade SS316L (CEA). The
white arrows indicate some of the isolated retained ferrite phases present in the slab. . . 103 3.4 Diagram of quartz tube encasing used for the TT under vacuum.
Two material plaques where encased in each tube and separated by quartz points so as not to touch during the TT. . . 104 3.5 Diagram detailing the series of thermal and if desired mechanical
treatments used to create the studied model materials (MM). * elimination of residual cold working, chromium carbides (if A600) and recrystallization, ** elimination of [thermal] vacancies, *** and **** precipitation of new chromium carbides (A600 only). . . 105 3.6 (a) SEM and (b) TEM micrograph of A600-PDS MM. In Fig. 3.6b
some isolated dislocations can be observed. The white arrows in Fig. 3.6a indicate the TiCN present in the material. . . 107 3.7 OM image of a SS316L-PDS model material. . . 108 3.8 Photo of tensile test specimen with extensometer before tensile
test-ing. The grip, extensometer, and test specimen are indicated by the labeled red arrows in the figure. . . 110 3.9 Experimental stress-deformation curves for tensile tests interrupted
at ǫ=20% and ǫ=40% and continued until rupture (only for (b)) for (a) A600 and (b) SS316L. . . 111 3.10 OM images of A600-DTS-D MM (a) ǫ = 20% and (b) ǫ = 40% after
polishing and electrochemical etching. . . 112 3.11 TEM thin foil observation of A600-DTS-D (ǫ = 40%) MM. . . 113 3.12 Optical microscope observations of the SS316L-DTS-D MM (ǫ=40%).114
1
It should be noted that these spectra were acquired using a Jobin Yvon Horiba EMGA-621W gas analyzer system and not a traditional TDS technique. These figures were choosen just for demonstrative purposes.
3.13 OM image of (a) A600-DTS-GBC and (b) A600-DTS-IIC. Micro-graph (a) shows the preferential localization of CrxCy along the GBs, whereas (b) a relatively homogeneous reprecipitation along GBs and in volume. . . 117 3.14 TEM image of A600-DTS-IIC. The white arrows indicate some of
the observed chromium carbide precipitates. . . 118 3.15 TEM image of A600-DTS-IIC and electron diffraction pattern
al-lowing for their identification as Cr7C3 type chromium cabrides. . . 118 3.16 Hardness (GPa) in function of depth (nm) measured using
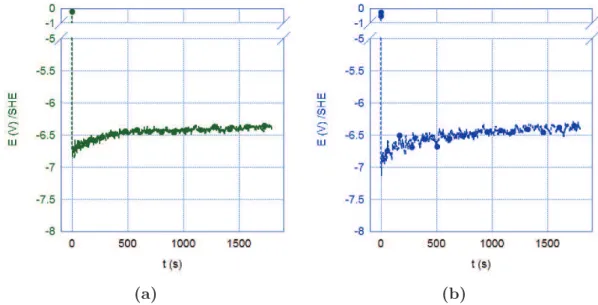
nanoin-dentation (innanoin-dentation depth ≤ 2000 nm) or microinnanoin-dentation (depth > 2000 nm) methods for an A600 PDS (circles) and A600 DTS-D ǫ = 40 % (squares) model materials. . . 120 3.17 Diagram of cathodic charging cell used for 2H charging. . . 121 3.18 Chronopotentiometry results for charging conditions A, see Table 3.6,
for (a) SS316L and (b) A600 materials. . . 122 3.19 Photo of thermal desorption mass spectrometry experimental
sys-tem at the Laboratoire d’Etude de la Corrosion Aqueuse (LECA) at the CEA Saclay. . . 123 3.20 Schematic diagram for the thermal desorption mass spectrometry
experimental system at the Laboratoire d’Etude de la Corrosion Aqueuse (LECA) at the CEA Saclay. In this diagram V = valve, P = vacuum pump and M.S. = mass spectrometer. . . 124 3.21 Calibrated LACO Inc. CALMASTERTM deuterium (2H2) leak
stan-dards attached to TDS system by in V2 Fig. 3.20. . . 125 3.22 TDS calibration spectrum: (a) raw calibration data for all four
cal-ibrated leaks, the corresponding leak rate in mol.s−1 for each leak is shown on the graph, (b) the mesured flux for calibrated leak 5.02 10−11 mol.s−1 during a temperature ramp (φ = 10 K.min−1) repeated twice, and (c) the final calibration curve showing the cor-relation between the measured ionic current at m/z = 4 (A) and the real molecular flux (mol 2H2.s−1). . . 127 3.23 Logic diagram for the numerical approach used to derive diffusion
and trapping parameters [90]. . . 129 3.24 Simulated normalized interstitial and trapped hydrogen
concentra-tion profiles after charging. Profiles are normalized to the maximum total H concentration (interstitial + trapped) for each type. . . 132 3.25 Simulated normalized TDS spectrum immediately after hydrogen
charging for Type A and Type B charging. . . 133 3.26 Simulated normalized concentration profiles for charging Type A
3.27 Simulated normalized TDS spectra for Type A and Type B charging subjected to 30 min of aging at 298 K between charging and TDS (φ = 2 K.min−1). All desorption flux (x = 0 and x = L) are shown. 135 3.28 Simulated theoretical desorption spectra for φ ranging from 2 - 15
K.min−1 for charging (a) Type A and (b) Type B. Simulations in-corporated a 30 min aging period between charging and TDS analysis.135 3.29 Choo-Lee plots for all observed peaks in simulated TDS spectra
for pure Fe charged Type A and Type B seen in Fig. 3.28 and the corresponding Tm and derived Ep values. . . 136 3.30 Effect of sample thickness on final desorption spectra (φ = 2 K.min−1)
for a charging of Type B aged 30 min at room temperature between charging and TDS. The graphic insert presents the concentration profiles (after aging) before TDS with normalized L (y-axis: con-centration (mol) and x-axis: normalized sample thickness (x/L)) . . 137 3.31 Simulated TDS spectrum for a linear theoretical T ramp (φ = 2
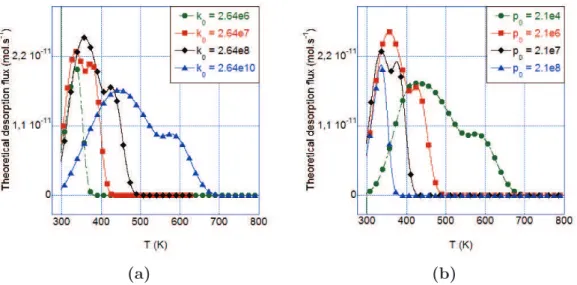
K.min−1) as compared to an experimental T ramp (φ = 2 K.min−1). The graphic insert shows the linear T ramp as compared to an experimental acquired T ramp: y-axis: T (K), x-axis: t (s). . . 138 3.32 Effect of pre-exponential factor: (a) k0 and (b) p0, on simulated
TDS spectra (φ= 2 K.min−1) for aged (30 min at 298 K) samples of charging Type B . . . 140 3.33 Influence of k0/p0 with a constant ratio (k0/p0 = 1.25) on a
simu-lated TDS spectrum (φ = 2 K.min−1), see Table 3.10 for the cor-responding k0 and p0 simulation values (A−F). The samples were Type B charged (Table 3.9) and aged 30 min at 298 K. . . 141 3.34 Effect of activation energy: (a) Ek and (b) Ep, on simulated TDS
spectra (φ= 2 K.min−1) for aged samples of charging Type B. . . . 142 3.35 Influence of Ek and Ep when Eb is held constant at 48 kJ.mol−1 on
simulated TDS spectra, see Table 3.11 for the corresponding Ekand
Ep simulation values (A−F). The samples were supposed charged using Type B conditions (Table 3.9) and aged 30 min at 298 K. . . 144 3.36 Influence of trap site density, N , on simulated TDS spectra, see
Table 3.12 for the corresponding imposed trap site densitites in simulations (A−G). The samples were supposed charged using Type B conditions (Table 3.9) and aged 30 min at 298 K. . . 145
4.1 Graphical representation of deuterium amount (mol) desorbed dur-ing TDS testdur-ing for A600 model materials: Pure Diffusion System (PDS),A600-like single crystal (s.c.), Diffusion and Trapping
System-Inter Intra-granular Carbides (DTS-IIC), Diffusion and Trapping System-Grain Boundary Carbides (DTS-GBC),Diffusion and Trapping
System-Dislocations-ǫ=40 % (DTS-D-40T)andDiffusion and Trapping
System-Dislocations-ǫ=20 % (DTS-D-20T). . . 152
4.2 Two TDS desorption spectra (a) before normalization (i.e. quan-tified spectra) and (b) after normalization by total amount of des-orbed deuterium. . . 153 4.3 Quantified (mol2H.cm−2.s−1) TDS desorption spectra for A600 MM
immediately after deuterium charging. All specimen were charged under Charging conditions A (Table 3.6) and analyzed in TDS using the conditions in Table 4.1 . . . 154 4.4 “Normalized” (with regards to total amount of desorbed deuterium)
TDS desorption spectra for A600 model materials immediately after deuterium charging. See Fig. 4.3 for quantified spectra. . . 155 4.5 “Normalized” desorption flux evolution for A600-PDS and A600-like
s.c. MMs immediately after 2H charging (Table 3.6, Table 4.1). . . . 156 4.6 “Normalized” desorption flux evolution for A600-PDS and
600-DTS-GBC model materials immediately after 2H charging (Table 3.6, Table 4.1). . . 157 4.7 “Normalized” desorption flux evolution for PDS and
A600-DTS-IIC immediately after 2H charging (Table 3.6, Table 4.1). . . . 158 4.8 “Normalized” desorption flux evolution for PDS and
A600-DTS-D-40T model materials immediately after 2H charging (Ta-ble 3.6, Ta(Ta-ble 4.1) . . . 159 4.9 “Normalized” desorption flux evolution of a pre-charged (Conditions
A, Table 3.6) A600-PDS MM specimen subjected to 6 hr of room temperature aging followed by TDS analysis (φ = 10 K.min−1) ( nor-malized desorption flux evolution,experimentally measured temper-ature). . . 161 4.10 Percentage (%) of total amount of 2H desorbed during the TDS
part of the “hybrid” spectra as compared to the total amount of2H desorbed from the material. . . 162 4.11 “Normalized” isothermal room temperature (294 ± 2 K) desorption
flux spectra for pre-charged (Conditions A, Table 3.6) A600 MMs. The temperature during the isotherm is indicated by the red dotted line. . . 163
4.12 “Normalized” experimental “hybrid” desorption spectra for 6 h of room temperature aging followed by TDS analysis (φ = 10 K.min−1) for pre-charged (Conditions A, Table 3.6) A600-PDS and A600-like s.c. MM. The temperature is shown in red. The axes of these two plots are not the same, on the left a “double-ordinate axis” plot can be seen with normalized desorption flux on the left-hand ordinate-axis and temperature (K) on the right-hand ordinate-ordinate-axis, both presented with regards to time on the abscissa-axis, whereas in the “zoomed” plot of only TDS analysis the ordinate-axis is normalized desorption flux and the abscissa-axis is temperature. . . 164 4.13 Compilatoin of “normalized” TDS spectra performed on
A600-DTS-IIC MMimmediately after charging,after 1 h,after 3 h,after 6 handafter 12 hof room temperature aging. A small desorption shoulder is highlighted by the black arrow. . . 166 4.14 “Normalized” experimental “hybrid” desorption spectra for 6 h of
room temperature aging followed by TDS analysis (φ = 10 K.min−1) for pre-charged (Conditions A, Table 3.6) PDS and A600-DTS-IIC MM. The temperature ramp is shown inred. . . 167 4.15 Compilation of “normalized” TDS spectra after room temperature
aging of a pre-charged for A600-DTS-D40T MM for aging durations ranging from 0 h, 6 h, 12 h and 48 h. A small desorption shoulder is highlighted by the black arrows. . . 169 4.16 “Normalized” experimental “hybrid” desorption spectra for 6 h of
room temperature aging followed by TDS analysis (φ = 10 K.min−1) for pre-charged (Conditions A, Table 3.6) PDS and A600-DTS-D-40T MM. The temperature ramp is shown in red. . . 170 4.17 (a) “Normalized” experimental aging (48 h at RT) and TDS
des-orption spectra (φ = 10 K.min−1) for pre-charged (Conditions A, Table 3.6) A600-PDS and A600-DTS-D-40T MM and the temper-ature ramp is shown in red and (b) zoom on the TDS spectra after 48 h of room temperature aging. . . 171 4.18 “Normalized” high temperature “isothermal” desorption flux
spec-tra (a) for first 2 104s and (b) focused on the desorption peak during the isotherm for pre-charged (Conditions A, Table 3.6) A600 model materials. The temperature is shown in red for the aging period. In (b) the maximum desorption temperature range in t is indicated by the black vertical lines and the corresponding Tm range is written below. . . 173
4.19 “Normalized” experimental desorption spectra for A600-PDS and A600-like s.c. for (a) aging at 409 K (first 1 104 s) and (b) TDS analysis (φ = 10 K.min−1). . . 174 4.20 “Normalized” TDS spectra (φ = 10 K.min−1) for A600-PDS and
A600-DTS-IIC (inter- and intragranular chromium carbides) after aging 3 h, 6 h or 9 h at 409 K. . . 176 4.21 “Normalized” TDS spectra (φ = 10 K.min−1) for PDS,
A600-DTS-GBC and A600-DTS-IIC after aging 6 h at 409 K. . . 176 4.22 “Normalized” TDS spectra (φ = 10 K.min−1) for PDS,
A600-DTS-D-40T and A600-DTS-D-20T (diffusion and trapping systems with dislocations) after aging 6 h or 9 h at 409 K. . . 177 4.23 “Normalized” experimental A600 pure diffusion system
experimen-tal desorption flux and simulated TDS spectra calculated using diffusion coefficients for H and its isotopes in A600 from litera-ture [40, 41] in function of time (abscissa-axis) and temperalitera-ture (ordinate-axis right). . . 180 4.24 “Normalized” experimental desorption flux acquired on an
A600-PDS, simulated TDS spectra calculated using diffusion coefficients for H and its isotopes in A600 [40, 41] and the best-fit calculated using the numerical fitting routine (Table 4.3) in function of time (abscissa-axis) and temperature (ordinate-axis right) . . . 181 4.25 Tolerated calculation error on derived diffusion coefficient.
Sim-ulation parameters associated with “A” and “B” can be seen in Table 4.4. Desorption spectra were “normalized” with regards to total desorbed deuterium. . . 182 4.26 “Normalized” experimental A600 pure diffusion system desorption
flux and simulated TDS spectra (6 h isothermal aging at RT, fol-lowed by TDS testing with a φ = 10 K.min−1 temperature ramp rate) calculated using the diffusion coefficients for H and its iso-topes found in literature [40, 41] and that derived in this study from a TDS spectrum immediately after 2H charging (Table 4.3). . 183 4.27 Zooms of the pure diffusion experimental and simulated (Table 4.3,[40,
41]) spectra seen in Fig. 4.26: (a) focusing on the beginning of the isothermal (RT) desorption spectra (b) focusing on the isotherm (6 h at RT) and TDS desorption spectra (φ = 10 K.min−1). . . 184 4.28 “Normalized” PDS experimental and simulated (Table 4.3,[40, 41])
desorption spectra for 6 h aging at 409 K followed by TDS analyses (φ = 10 K.min−1): (a) shows the total analysis (aging and TDS) and (b) is a zoom of the TDS analysis part showing experimental and simulated spectra. . . 186
4.29 “Normalized-TP” (i.e. with regards to “TDS part”) spectral inte-grals A600-PDS experimental and simulated TDS desorption spec-tra using derived2H (Table 4.3, “This study”) and literature [40, 41] diffusion data. . . 187 4.30 (a) “Normalized-TP” PDS experimental and simulated TDS
des-orption spectra using the derived2H diffusion coefficient (Table 4.2, “This study”) or “A” (Table 4.4) and (b) simulated spectral contri-butions with these diffusion coefficients. In (b) -0 and -L refers to the origin of the spectral contribution, respectively either the x = 0 face (charged face) or the x = L face (non-charged) face. . . 188 4.31 “Normalized” A600-like single crystal experimental TDS spectrum
immediately after deuterium charging as compared to simulated TDS spectra (a) using the derived diffusion coefficient parameters determined for A600-PDS (Table 4.3) and (b) using the maximum tolerated error parameters associated with “A” and “B” from Ta-ble 4.4. . . 189 4.32 “Normalized” experimental “hybrid” desorption spectrum acquired
for an A600-like single crystal aged 6 h in TDS at room temperature (≈ 295 K) followed by TDS analysis (φ = 10 K.min−1) as compared to its simulated TDS spectrum using the derived diffusion coefficient parameters (Table 4.3) determined for A600-PDS model materials. . 190 4.33 “Normalized” isothermal spectrum acquired on desorption A600-like
single crystal aged 6 h in TDS at high temperature (≈ 409 K) as compared to its simulated TDS spectrum using the derived diffusion coefficient parameters (Table 4.3) determined for A600-PDS model materials. Only the first 5000 s of the experimental and simulated desorption spectra are shown in this figure to provide a better view of the reproduction of the first desorption peak. . . 191 4.34 “Normalized” experimental, literature simulated [45, 46] and
“best-fit” TDS spectra (φ = 10 K.min−1) for SS316L pure diffusion system model material immediately after 2H charging (Table 3.6). . . 192 4.35 Normalized experimental and simulated [45, 46] desorption spectra
for SS316L-PDS model materials for 6 h of aging at room temper-ature (294 K) followed by TDS analysis (φ = 10 K.min−1). . . 193 4.36 “Normalized-TP” experimental and “best-fit” TDS spectra for
trap-ping at chromium carbides (Cr7C3, according to TEM diffraction patterns, see Chapter 3) in A600 after aging 6 h at 409 K. . . 196 4.37 Experimental and simulated “normalized-TP” TDS spectra (φ = 10
K.min−1) after (a) 3 h of aging at 409 K and (b) 9 h of aging at 409 K, used for validation of the derived trapping/detrapping parameters.197
4.38 (a) “Normalized-TP” experimental and simulated TDS spectrum (aged 6 h at 409 K, φ = 10 K.min−1) for a trap site densities (n) ranging from 0.01 10−5 mol TS.mol A600−1 to 100.0 10−5 mol TS.mol A600−1. . . 198 4.39 Quantified experimental and simulated TDS spectrum (aged 6 h at
409 K, φ = 10 K.min−1) for a trap site densities (N ) ranging from 0.01 10−5 to 100.0 10−5 mol TS.mol A600−1. Figure (a) shows all simulations, and (b) shows a zoom of the experimental spectrum. . 199 4.40 Quantified experimental, fitted and simulated TDS spectra for high
temperature agings (409 K) of (a) 6 h, (b) 3 h and (c) 9 h using the derived diffusion and trapping/detrapping at chromium carbides parameters (Table 4.3 and Table 4.7) and a trap site density (n) of 1.0 10−5 mol TS.mol A600−1. . . 201 4.41 “Normalized-TP” experimental TDS spectra for A600-DTS-GBC
and a simulated (Simulated-IIC) desorption spectra for a sample aged 6 h at 409 K using the kinetic constants seen in Table 4.7. . . 202 4.42 “Normalized-TP” experimental and “best-fit” TDS spectra for
dif-fusion and trapping in A600 with chromium carbides located along the grain boundaries after 6 h of agin at 409 K. A trap site density of 2.5 10−6 mol TS.mol A600−1 was determined from simulation. . . 203 4.43 Quantified experimental and “best-fit” TDS spectra for diffusion
and trapping in A600 with chromium carbides located along the grain boundaries after aging 6 h at 409 K. A trap site density of 2.5 10−6 mol TS.mol A600−1 was imposed for this simulation. . . 203 4.44 “Normalized-TP” experimental and “best-fit” TDS spectra (Table 4.9)
for trapping at dislocations in A600 after aging 9 h at 409 K. . . 204 4.45 Experimental and simulated “normalized-TP” desorption spectra
for trapping at dislocations in A600 after aging 6 h at 409 K. Simu-lation was done using the constants seen in Table 4.9. These values are coupled with the diffusion constant presented in Table 4.3. . . . 205 5.1 Arrhenius plots of H diffusion data from literature in (a) A600
[40, 41, 43, 42] and (b) SS316L [44, 45, 46, 47, 48] as compared to the derived D (“This study”) from A600 and SS316L pure dif-fusion system model materials. The error for D is indicated by the dotted gray lines. In (b) Hco and HHT refer to the derived hydrogen diffusion coefficient in a commercial or heat treated 316L stainless steel respectively. . . 214
5.2 Energy diagram for trapping when the trapping activation energy (Ek) is greater than that of interstitial diffusion (ED), as would be suggested by the derived activation energies for H trapping at chromium carbides (Table 5.2). . . 217 5.3 Energy diagram for trapping when the trapping activation energy
(Ek) is less than that of interstitial diffusion (ED), as would be suggested by the derived activation energies for H trapping at dis-locations (Table 5.2). . . 217 5.4 Experimental TDS spectra as acquired by Young et al. [82] for
trapping at chromium carbides. . . 220 5.5 Simulated (pure diffusion) normalized2H concentration profiles
recre-ated using the charging conditions and diffusivity in the publica-tions: (a) Symons et al. [22] and (b) Young et al. [82] after various aging periods.. . . 221 5.6 Simulated normalized3 TDS desorption spectra, to attempt
recre-ation of experimental TDS spectra by Young et al. [82] with (a) variation in (linear) temperature ramp and (b) variation in trap site density N . The text located on the figures is to remind the reader of peak identification as stated in the publication [82]. . . 222 5.7 Some examples of exotic isothermal and ramp desorption testing
which may be interesting for trap site isolation: (a) demonstrates an instantaneous temperature jump, isotherm, freeze, TDS combina-tion (b) consecutive instantaneous temperature jumps and isotherms and (c) a mixture of the two previous. . . 228 5.8 Simulated (a) non-aged and (b) aged 6 h at 409 K TDS spectra (φ
= 10 K.min−1) for a model A600 material with two trap sites: (i) dislocations (TS1) and (ii) chromium carbides (TS2). . . 229 5.9 Simulated non-aged TDS spectra (φ = 10 K.min−1) for a material
with two trap sites (TS1 and TS2) and simulated TDS spectra for each type of isolated trap site TS1 (dislocations) or TS2 (Cr7C3). . 230 5.10 Simulated high temperature aged (409 K for 6 h) TDS spectra (φ =
10 K.min−1) for a material with two trap sites (TS1 and TS2) and simulated TDS spectra each type of isolated trap site TS1 (disloca-tions) or TS2 (Cr7C3). . . 231 7.1 Sch´ema de principe d’un r´eacteur `a eau pressuris´ee
(www.world-nuclear.org). . . 246
2with regards to total amout of H in the specimen immediately after charging 3with respect to total mol H desorbed
7.2 Sch´ema des diff´erents types de sites avec lesquels l’hydrog`ene est susceptible d’interagir dans un mat´eriau cristallin : site interstitiel (a), sites de surface (b) et de subsurface (c), joint de grains (d), dislocation et champ de contrainte associ´e (e), et lacune (f) [1]. . . . 248 7.3 Observations microscopique( par microscope ´electronique `a balayage
(a) ou microscope optique (b)) du mat´eriau mod`ele PDS (a) A600 et (b) SS316L. Les fl`eches blanches indiquent les TiCN qui restent pr´esents dans le mat´eriau mˆeme apr`es le traitement thermique. . . . 251 7.4 Observations en microscopie optiques des ´echantillons DTS-D en
(a) A600 et (b) SS316L. . . 252 7.5 Observations en microscopie optique des ´echantillons (a) DTS-GBC
et (b) DTS-IIC. . . 253 7.6 Diagramme d´etaillant la s´erie de traitements thermom´ecaniques mis
en oeuvre afin d’´elaborer les mat´eriaux mod`eles (MM) ´etudi´es. * recristallisation et ´elimination de l’´ecrouissage r´esiduel et des car-bures de chrome ´eventuellement (cas de l’A600), ** ´elimination des lacunes, *** et **** repr´ecipitation de carbures de chrome (seule-ment dans le cas de l’A600). . . 253 7.7 Diagramme logique de la m´ethode num´erique utilis´ee pour d´eriver
les param`etres de diffusion et de pi´egeage/d´epi´egeage [90]. . . 256 7.8 Evolution du flux de d´esorption “normalis´e” obtenu sur ´echantillon
de type A600-PDS directement apr`es chargement (Table 3.6) en fonction du temps et de la temp´erature (φ = 10 K.min−1) ; com-paraison (i) aux spectres TDS simul´es `a l’aide des coefficients de dif-fusion de H et de ses isotopes dans l’A600 publi´es dans la litt´erature [40, 41] et (ii) ajustement du spectre exp´erimental `a l’aide du code num´erique (Table 4.3) d´evelopp´e dans ces travaux. . . 259 7.9 Evolution du flux de d´esorption “normalis´e” obtenu sur ´echantillon
de type SS316l-PDS directement apr`es chargement (Table 3.6) en fonction du temps et de la temp´erature (φ = 10 K.min−1) ; com-paraison (i) aux spectres TDS simul´es `a l’aide des coefficients de diffusion de H dans le SS316L publi´es dans la litt´erature [45, 46] et (ii) ajustement du spectre exp´erimental `a l’aide du code num´erique (Table 4.3) d´evelopp´e dans ces travaux. . . 260 7.10 Spectres TDS normalis´es, obtenus exp´erimentalement ou simul´es `a
partir des donn´ees publi´ees [40, 41] et collect´ees dans le cadre de ces travaux, dans le cas d’un ´echantillon de type A600-PDS vieilli 6h `a temp´erature ambiante puis soumis `a une exp´erience de TDS (φ = 10 K.min−1). . . 261
7.11 Spectres TDS normalis´es, obtenus exp´erimentalement ou simul´es `a partir des donn´ees publi´ees [45, 46] et collect´ees dans le cadre de ces travaux, dans le cas d’un ´echantillon de type SS316L-PDS vieilli 6h `a temp´erature ambiante puis soumis `a une exp´erience de TDS (φ = 10 K.min−1). . . 262 7.12 Spectres TDS exp´erimentaux quantifi´es obtenus sur des ´echantillons
d’alliage 600 de type DTS-IIC apr`es des vieillissements `a haute temp´erature (409 K) de 6 h, 3 h and 9 h ; comparaison avec l’ajustement (pour un vieillissement de 6 h) et les simulations (pour des vieillissements de 3 h et de 9 h) r´ealis´es. Ces simulations s’appuient sur les donn´ees de diffusion et les constantes cin´etiques de pi´egeage/d´epi´egeage d´etermin´ees pr´ec´edemment (Table 4.3 and Table 4.7) ainsi que sur une densit´e de site de pi´egeage (n) de 1,0 10−5 mol TS.mol A600−1. . . 264
List of Tables
1.1 Characteristic PWR primary water conditions. . . 45 2.1 Characteristic PWR primary water conditions. . . 49 2.2 Literature review of hydrogen trapping constants at various TS. . . 70 2.2 continued. . . 71 2.2 continued. . . 72 2.2 continued. . . 73 3.1 Chemical composition (wt.%) of studied alloys: an industrial
Ni-base alloy 600 (A600 heat WL344, Imphy), an A600-like single crys-tal (s.c.) (Ecole Nationale Sup´erieur des Mines de Saint-Etienne), and a commercial grade stainless steel of type 316L (SS316L) . . . . 98 3.2 Dilute electrochemical etching solutions used to reveal the
microstruc-ture of austenitic materials. . . 99 3.3 Dislocation density for A600-DTS-D (ǫ=20% and ǫ=40%) estimated
using the Bailey equation [154], Eq. (3.4), and an average value for a non-deformed PDS material estimated from TEM micrographs using the numerical method presented in Eq. (3.1). . . 114 3.4 Dislocation density calculated for SS316L-DTS-D MM (ǫ=20% and
ǫ=40%) using the Bailey equation [154], Eq. (3.4). A typical dis-location density for heat treated (1.5 h at 1373 - water quench) non-tempered SS316L [159] is given for a comparative purpose. . . . 115 3.5 Table of materials to be studied experimentally (s.c. = single
crys-tal, x = to be studied, – = non-fabricated) . . . 119 3.6 Typical experimental cathodic [deuterium] charging conditions:
so-lution, time (t), temperature (T ), and current density (j) used in this work. . . 121 3.7 Boundary conditions used in simulation where L = sample
thick-ness, tcharging =final charging time, and ttransfer=final transfer time. 130 3.8 Diffusion and trapping simulation parameters (1 trap site) in pure
3.9 Charging conditions for simulating Type A (homogeneous) and Type B (partial) charging; µF e
0 is taken to be the solubility of H in pure Fe [129] . . . 132 3.10 Simulation constants used when holding the k0/p0 ratio constant at
1.25. The resulting spectra can be seen in Fig. 3.33 and are labeled using an alphabetic key. . . 140 3.11 Trapping (Ek) and detrapping (Ep) activation energies used when
holding the binding energy constant (Eb) at 48.00 kJ.mol−1. . . 143 3.12 Imposed trap site densities (N ) used to simulate the TDS spectra
shown in Fig. 3.36. . . 145 4.1 Experimental TDS conditions. Tiso-RTrefers to a room temperature
isothermal aging period and Tiso-HT refers to an elevated tempera-ture aging period. . . 154 4.2 Diffusion coefficients of H (and its isotopes) in A600 reported in
literature. . . 180 4.3 Derived diffusion coefficients for a A600 pure diffusion system (PDS)
model material. . . 181 4.4 Error on diffusion coefficient values, demonstrating the “fastest”
(A) and “slowest” (B) tolerated D values. Simulations using these parameter can be seen in Fig. 4.25. . . 182 4.5 Derived diffusion coefficients for a SS316L pure diffusion system
(PDS) model material. . . 193 4.6 Derived diffusion coefficients for A600 and SS316L pure diffusion
system (PDS) model materials. . . 194 4.7 Derived “best-fit” trapping (k) and detrapping (p) kinetic constants
for trapping at chromium carbides located both inter- and intragran-ularly in A600. These values are coupled with the diffusion constant presented in Table 4.3. . . 196 4.8 Derived “best-fit” trapping (k) and detrapping (p) kinetic constants
for trapping at chromium carbides (Cr7C3, according to TEM diffrac-tion patterns, see Chapter 3) along grain boundaries in A600. These values are coupled with the diffusion constant derived parameters presented in Table 4.3. . . 204 4.9 Derived “best-fit” trapping (k) and detrapping (p) kinetic constants
for trapping at dislocations in A600. These values are coupled with the diffusion constant derived parameters presented in Table 4.3. . . 205
4.10 Derived “best-fit” trapping (k) and detrapping (p) kinetic constants for trapping at chromium carbides (Cr7C3, according to TEM diffrac-tion patterns, see Chapter 3) located both inter- and intragranularly (IIC) and at primarily grain boundaries (GBC) and dislocations in A600. These values are coupled with the diffusion constant pre-sented in Table 4.3. . . 207 5.1 Derived diffusion coefficients for A600 and SS316L pure diffusion
system (PDS) model materials. . . 213 5.2 Derived trapping (k) and detrapping (p) kinetic constants for
trap-ping at chromium carbides (Cr7C3) and dislocations in A600. . . 216 5.3 Calculated binding energies for trapping at chromium carbides (Cr7C3)
and dislocations in A600 using the derived trapping parameters (Ta-ble 5.2). Eb refers to the traditional definition of binding energy (Eb = Ep−ED) and Eb′ refers to the proposed definition of binding energy (E′
b = Ep−Ek). . . 218 5.4 Collection of activation energies for diffusion and trapping in A600
as presented by Young et al. [82] and Symons et al. [22]. The ac-tivation energies (ED and Ep) were determined by “Choo-Lee plot” analysis [91] and binding energy (Eb) was calculated by Eq. (5.1). . 219 5.5 Dislocation densities (ρdislocations) imposed trap site density in
simu-lations (N ) and calculated TS densities (N′
d) and αd associated with dislocations, these parameters were determined experimentally, de-rived from numerical simulations, or calculated using Eq. (5.4) or Eq. (5.5). . . 225 5.6 Average surface area of a chromium carbide in the A600 matrix
(Sa), imposed trap site density in simulations (N ) and calculated TS densities (N′
c) and αcassociated with chromium carbides. These parameters were determined by microscope observations and image analysis, derived from numerical simulations, or calculated using Eq. (5.4) or Eq. (5.6). . . 225 6.1 Derived diffusion coefficients for a A600 and SS316L pure diffusion
system model materials . . . 238 6.2 Derived “best-fit” trapping (k) and detrapping (p) kinetic constant
parameters for trapping at chromium carbides (Cr7C3, according to TEM diffraction patterns, see Chapter 3) located both inter- and intragranular (IIC) or uniquely along grain boundaries (GBC) and dislocations in A600. . . 239 7.1 Conditions du milieu primaire des REP. . . 247
7.2 Synth`ese des coefficients de diffusion de H obtenus `a partir des donn´ees exp´erimentales collect´ees sur des mat´eriaux mod`eles dans lesquels la diffusion est pr´epond´erante (PDS), pour l’A600 et le SS316L. . . 258 7.3 Constantes cin´etiques de pi´egeage (k) et de d´epi´egeage (p) du deut´erium
pour diff´erents types de sites pr´esents dans l’alliage 600 : des car-bures de chrome (de type Cr7C3 d’apr`es les analyses de diffraction ´electronique pr´esent´ees au chapitre 3) inter- et intragranulaire (IIC) ou localis´es principalement aux joints de grains (GBC) et des dislo-cations (D). Ces valeurs sont associ´ees aux constantes de diffusion pr´esent´ees dans le tableau Table 4.3. . . 265
Chapter 1
Introduction
1.1
Context and objectives
Of the almost 440 existing nuclear reactors in the world today, nearly 350 are
Light Water Reactors (LWR). This class of nuclear reactor is often separated into
two subdivisions: (i) Pressurized Water Reactors (PWR) and (ii) Boiling Water
Reactors (BWR). In France all of the 58 nuclear reactors (Fig. 1.1) are PWRs
and produce nearly 75 % of the country’s electricity. Many of these reactors were designed for operation between 30 and 40 years, but with the necessary maintenance and additional investments it may be possible to extend their lifetime to up to 80 years.
Fig. 1.1 Map of localization of nuclear reactors
in France (www.world-nuclear.org) As a large part of these
nuclear reactors in France ap-proach near the end of their forecasted lifetime, the ques-tion of lifetime extension has been brought to the table. One key factor in extending their operation is safety. Over the past forty years, on top of sup-plementary maintenance and security measures (i.e. com-ponent replacement and re-pairs, upgrading control sys-tems, etc.), a great deal of research has been conducted with the goal of better under-standing the degradation phe-nomena taking place in reac-tors. Reactor degradation is often due to component cor-rosion and cracking which has furthermore been linked to the extreme environmental
condi-tions the components are subjected to during reactor operation (i.e. high tem-perature, high pressure, irradiation, internal stresses, elevated hydrogen partial pressures, etc.).
One of these degradation mechanisms is Stress Corrosion Cracking (SCC). This corrosion mechanism comes into play when extreme environmental conditions are coupled with internal stresses in the material. Furthermore, some researchers have linked this corrosion mechanism to the presence of hydrogen, which in PWR pri-mary water at 598 K is at an overpressure of about 0.3 bar. The goal of this study
is to better understand the role of hydrogen in these degradation mechanisms, with specific focus on interactions between hydrogen and the material in terms of (i) diffusion and (ii) trapping at microstructural defects and impurities intrinsically present in an industrial material.
1.2
PWR operation
Pressurized water reactors can be split respectively into three circuits, Fig. 1.2, the (i) primary circuit, (ii) secondary circuit, and a (iii) cooling circuit which may be the ocean, a river, or a closed circuit (not shown in figure).
At the heart of the nuclear core is the fuel, source of both heat and energy in the reactor. The PWR reactor fuel is often fabricated in the form of ceramic pellets of pressed and sintered uranium oxide (UO2). These pellets are then encased in metal fuel rods, often fabricated in a zirconium base alloy. After assembly, the fuel rods are placed in the reactor core where they will be in contact with the primary circuit medium.
Fig. 1.2 Typical Pressurized Water Reactor design (www.world-nuclear.org).
The heat produced by the fission process in the reactor core is transfered to the water in the primary circuit, the composition and conditions of this medium can
be seen in Table 1.1. The heat of the primary circuit medium is then transfered to the secondary circuit medium via the steam generator tubes (i.e. heat exchanger) which serve as the physical barrier between the two circuits as well as a barrier to the radioactive core products from the environment.
Table 1.1 Characteristic PWR primary water
conditions. Temperature 558 - 598 K Pressure 155 bar Boron (H3BO3) 10 - 1200 ppm Lithium (LiOH) 0.7 - 2.2 ppm Hydrogen (H2) 25 - 50 cm3.kg−1(NPT) pH573K ≈ 7
The heat transfer from the primary to secondary cir-cuit results in the vaporiza-tion of the secondary circuit medium. The water vapor is then transported across a turbine which produces elec-tricity. After this passage, the steam is condensed by the cooling circuit and recon-densed water is repumped to-wards the heat exchanger where the cycle will continue.
1.3
Hydrogen and Stress Corrosion Cracking
Stress corrosion cracking is an environmental degradation mechanism combines both internal material factors and external environmental factors and affects pri-marily materials reputed for their good corrosion resistant properties. These types of cracks have been observed in PWR reactor components, in particular in the steam generator tubes fabricated in nickel base alloys and in reactor internal com-ponents fabricated in an austenitic stainless steel alloy.
Some researchers, over the past 60 years, have suggested that the presence of hydrogen may play a role in SCC phenomenon. Hydrogen is present in both the reactor primary and secondary circuit media in the form of (i) water (H2O) present in both the primary and secondary circuits and (ii) dissolved hydrogen gas (25 - 50 cm3.kg−1 (NPT)) present in the primary circuit medium (Table 1.1). Moreover, hydrogen can have multiple influences in corrosion processes including, (i) a kinetic effect on the formation of protective oxide scales on both the primary and secondary circuit sides (ii) a thermodynamic influence on the structure and stability of the oxide scale formed on the alloy, (iii) a kinetic influence on crack ini-tiation, formation and propagation and (iv) an influence on the alloy’s mechanical properties after it has been absorbed.
Once absorbed by the alloy, the hydrogen can be transported across the mate-rial, where it will interact with interstitial lattice sites along with the different crys-tallographic defects or heterogeneities present in the material (Fig. 1.3). Hydrogen atoms may interact differently with these sites, which may present a “trapping”
![Fig. 1.3 Diagram of potential hydrogen diffusion and trapping sites in a crys- crys-talline material: (a) interstitial site, (b) surface and (c) subsurface sites, (d) grain boundaries, (e) dislocations and stress fields and (f) vacancies [1].](https://thumb-eu.123doks.com/thumbv2/123doknet/3212828.91867/46.892.223.726.271.494/potential-hydrogen-diffusion-interstitial-subsurface-boundaries-dislocations-vacancies.webp)
![Fig. 2.18 “Choo-Lee” plot analysis for the “TDS” spectra presented in Fig. 2.17 [141].](https://thumb-eu.123doks.com/thumbv2/123doknet/3212828.91867/88.892.239.711.605.953/fig-choo-lee-plot-analysis-tds-spectra-presented.webp)


![Fig. 3.23 Logic diagram for the numerical approach used to derive diffusion and trapping parameters [90].](https://thumb-eu.123doks.com/thumbv2/123doknet/3212828.91867/129.892.202.639.407.703/logic-diagram-numerical-approach-derive-diffusion-trapping-parameters.webp)