Open Archive TOULOUSE Archive Ouverte (OATAO)
OATAO is an open access repository that collects the work of Toulouse researchers and makes it freely available over the web where possible.This is an author-deposited version published in : http://oatao.univ-toulouse.fr/ Eprints ID : 14294
To cite this version : Clavier, Rémi and Chikki, Nourdine and Fichot, Florian and Quintard, Michel Experimental study of pressure drops in coarse particle beds. (2015) In: NURETH-16 Conference, 30 August 2015 - 4 September 2015 (Chicago, United States).
Any correspondance concerning this service should be sent to the repository administrator: [email protected]
Experimental study of single-phase pressure drops in coarse particle beds
R. Clavier∗∗∗∗, N. Chikhi, F. Fichot IRSN Cadarache
Saint Paul-lez-Durance, FRANCE
[email protected] ; [email protected] ; [email protected] M. Quintard
Université de Toulouse; INPT, UPS; IMFT (Institut de Mécanique des Fluides de Toulouse); Allée Camille Soula, F-31400 Toulouse, France;
CNRS; IMFT; F-31400 Toulouse, France [email protected]
ABSTRACT
Motivated by uncertainty reduction in nuclear debris beds coolability, experiments have been conducted on the CALIDE facility in order to investigate single-phase pressure losses in representative debris beds, i.e., high sphericity (> 80 %) particle beds with small size dispersion (from 1 mm to 10 mm), for which no validated model exists. In this paper, experimental results are presented and analyzed in order to identify a simple correlation for single-phase flow pressure losses generated in this kind of porous media in reflooding flowing conditions, which cover Darcy to Weakly Turbulent regimes. In the literature, it has been observed that their behaviour can be accurately described by a Darcy-Forchheimer law, involving the sum of a linear term and a quadratic non-linear deviation, with respect to the filtration velocity. Expressions for the coefficients of the linear and quadratic terms are determined by assessing the possibility to evaluate equivalent diameters, i.e., characteristic lengths allowing correct predictions of the linear and quadratic terms by the Ergun equation. It has been observed that the Sauter diameter of particles allows a very precise prediction of the linear term, while the quadratic term can be predicted using the product of the Sauter diameter and a sphericity coefficient as an equivalent diameter.
KEYWORDS
Single-phase, Porous media, Debris bed, Experimental
1 INTRODUCTION
In the course of a severe nuclear accident, the heat up of the core after complete or partial dry-out can lead to a collapse of fuel assemblies and to the formation of a debris bed. This phenomenon has been observed in the TMI-2 highly damaged core [1], and reproduced in many experimental programs: LOFT [2], PHEBUS [3], PBF [4].
Removal of the decay heat from the debris bed by reflooding is essential for mitigation and termination of the accident. However, the success of this operation can be compromised by many factors, such as decay
∗Presenting author
heat power, exothermic oxidation of Zirconium by steam, or a too weak permeability of the bed, and can not be predicted on the basis of current knowledge and understanding. This implies to study how water penetrates this degraded geometry, which can be described as a hot porous medium.
The CALIDE experimental facility has been built at IRSN (Cadarache, France) in order to study pressure losses generated in representative debris beds in reflooding conditions. The relevance of this study lies in the fact that pressure losses constitute a key parameter governing water penetration in a hot debris bed, for which no validated models exist [5]. Establishment of accurate correlations for pressure losses in porous media are therefore necessary for interpretation of reflooding experiments [6,7,8,9] and their numerical simulation with severe accident codes. Both single and two-phase flow correlations are needed, since both these configurations occur in a hot particle bed during reflooding (Figure 1): two-phase flows occur near the quenching front, while single-phase flows, steam or liquid water, occur in upstream and downstream parts.
Figure 1: Schematic representation of flow structure in debris beds during reflooding
In this paper, experimental results obtained with single-phase flows in the CALIDE facility will be analyzed in order to derive a simple macro-scale correlation for single-phase pressure losses validated for porous media representative of nuclear debris beds, and for flowing conditions representative of a reflooding, which basically correspond to Reynolds numbers ranging from Re = 15 to Re = 100 in liquid areas, and to Re ≈ 1000 in gas areas [8], the Reynolds number being defined by:
(
ε
)
µ
ρ
− = 1 Re dStU , (1)where U is the filtration velocity, ρ and µ are the density and dynamic viscosity of the fluid, respectively, and ε is the porosity of the medium. The characteristic dimension dSt is the Sauter diameter of the
particles, defined by:
part part St S V d =6 , (2)
where Vpart and Spart are the total volume and surface of the particles, respectively.
Flowing conditions during reflooding are beyond the validity domain of the Darcy’s law, which only holds in the creeping regime, up to Reynolds numbers of a few units to a dozen, depending on the medium [10,11]. Beyond the Darcy domain, pore-scale inertial effects appear, and, for Reynolds number of the order of several hundreds, pore-scale turbulence [12]. At the large scale level, these phenomenon
result in non-linear deviations to Darcy’s law. For disordered particle beds, such as nuclear debris beds, this behavior is often approximated, at least within the inertial regime, by a Darcy-Forchheimer law, involving the sum of a linear and a quadratic terms, with respect to the filtration velocity [7,13,14,15,16]:
2 U U K g z P
η
ρ
µ
ρ
= + + ∂ ∂ − , (3)where ∂P/∂z is the vertical pressure gradient, g the gravitational constant and K and η are two macroscopic characteristics of the medium called “permeability” and “passability”, respectively.
Quantitative prediction of pressure losses necessitates expressions for permeability and passability. In the case of monodisperse beds, a validated model is the Ergun’s law [14], widely used in chemical and petroleum engineering [17,18]:
(
)
2 2 3 1ε
ε
− = K h d K (4)(
ε
)
ε
η
η − = 1 3 h d , (5)where d is the diameter of the particles and hK and hη are the Ergun constants.
In this work, the applicability of empirical equations (4) and (5) to debris-bed-like media will be investigated, by assessing the possibility to define equivalent diameters, i.e., characteristic dimensions allowing correct predictions of permeability and passability terms when injected in equations (4) or (5). This kind of approach has been found to be relevant, from an empirical point of view, for permeability prediction of this class of media [19]. It is proposed here to extend this concept to non-Darcy flows. The CALIDE facility and the experimental conditions will be presented in section 2. In section 3, applicability of equations (4) and (5) will be investigated, and expressions for the equivalent diameters will be recommended.
2 EXPERIMENTAL CONDITIONS
2.1 The CALIDE Facility
The CALIDE facility, as illustrated in Figure 2, is an air/water loop at room temperature and pressure. Its instrumentation allows measurement of pressure losses versus flow-rates in a 93.96 ±0.04 mm diameter cylindrical test section that contains a 499.0 ±1.6 mm high particle bed.
Air flows (up to 1000 Nl/min ± 0.5%, which corresponds to 2.58 m/s at 20 °C; 1 atm), and water flows (up to 600 kg/h ± 0.2%, which corresponds to 24 mm/s) are representative of reflooding conditions, in terms of filtration velocity [20,21]. Instrumentation also allows measurement of pressure drops (up to 200 mbar ± 0.04%), absolute pressure and fluid temperature, which are necessary to determine the fluid density and viscosity.
Particles are representative of nuclear fuel debris, in terms of size and shape, and are presented in next paragraph.
Figure 2: The CALIDE experimental facility
2.2 Particle Beds
An exhaustive state-of-the-art on debris bed granulometry can be found in [19]. The main results of that study are summarized in this section. Fuel pellets naturally crack during normal operation [22]. In TMI-2 damaged core, 0.3 mm to 4 mm fragments have been observed, with an average value of the order of 2 mm [23]. This is consistent with the results of LOFT and PBF programs [19]. Concerning cladding particles, it can be calculated [24] that their average Sauter diameter ranges from 1.1 mm to 1.7 mm. When debris are formed by re-solidification of corium falling in a liquid water pool, sizes varying from 0.25 mm to more than 10 mm have been observed, for example in the FARO experiments [25].
The porosity of the TMI-2 debris bed has been determined [23], and ranges from 0.35 to 0.55. An average value of 0.4 is usually used for safety analysis, and for moderately irradiated fuel, for example in [26]. Particle beds studied in CALIDE are determined in order to be representative of nuclear debris beds. Non-spherical particle beds and mixtures of Non-spherical particles have been studied. Non Non-spherical particles (Table 2) consist in three kinds of cylinders and two kinds of prisms. Their dimensions are of the order of fuel pellets fragments. Nominal sizes of spherical particles range from 1.5 mm to 8 mm (Table 1). Table 4 summarizes the composition of each mixture.
Analytical understanding and modeling of experiments require a precise determination of the particle’s geometrical characteristics. Mean diameters, side lengths, heights, surfaces and densities of all particles have been determined from representative samples.
2.3 Determination of Porosity
Porosity has to be precisely measured, since pressure loss is very sensitive to this parameter. The adopted method consists in determining the volume of the pores by measuring the mass of water mw that is
H = 499.0 ± 1.6 mm above the bottom supporting wire mesh. Knowing the diameter D of the test section,
porosity can then be determined by:
H D m w w 2 4
π
ρ
ε
= . (6)Porosities of each bed are summarized in Table 3 and Table 4. They range from 35 % to 40 %, which fits the average porosity of debris beds. It should be noted that the values reported in these tables are different for air and water experiments, because air and water experiments have been conducted on different beds.
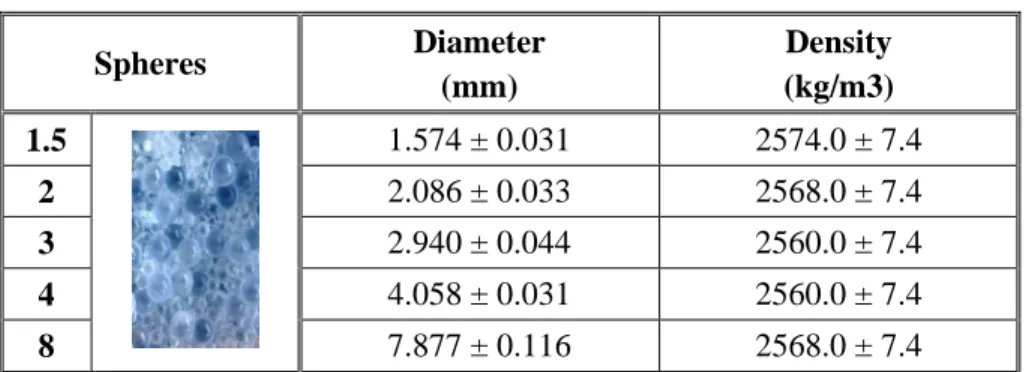
Table 1: Spherical particles used in this study
Spheres Diameter (mm) Density (kg/m3) 1.5 1.574 ± 0.031 2574.0 ± 7.4 2 2.086 ± 0.033 2568.0 ± 7.4 3 2.940 ± 0.044 2560.0 ± 7.4 4 4.058 ± 0.031 2560.0 ± 7.4 8 7.877 ± 0.116 2568.0 ± 7.4
Table 2: Non-spherical particles used in this study
Cylinders/Prisms Diameter/Side (mm) Height (mm) Density (kg/m3) 5×5 5.13 ± 0.08 4.53 ± 0.23 2572.0 ± 7.4 5×8 4.86 ± 0.08 7.39 ± 0.37 3046.0 ± 8.8 8×12 7.99 ± 0.10 11.13 ± 0.48 2568.0 ± 7.4 4×4 4.15 ± 0.11 3.84 ± 0.13 2568.0 ± 7.4 6×6 6.11 ± 0.15 5.87 ± 0.19 2452.0 ± 7.1
Table 3: Measured porosities of non-spherical particle beds
Particle ε (air experiments) ε (water experiments) cyl 5×5 0.3525 ± 0.0041 0.3525 ± 0.0041 cyl 5×8 0.3954 ± 0.0047 0.3843 ± 0.0045 cyl 8×12 0.3855 ± 0.0053 0.3642 ± 0.0065 pri 4×4 0.3646 ± 0.0041 0.3750 ± 0.0064 pri 6×6 0.3699 ± 0.0065 0.3666 ± 0.0065
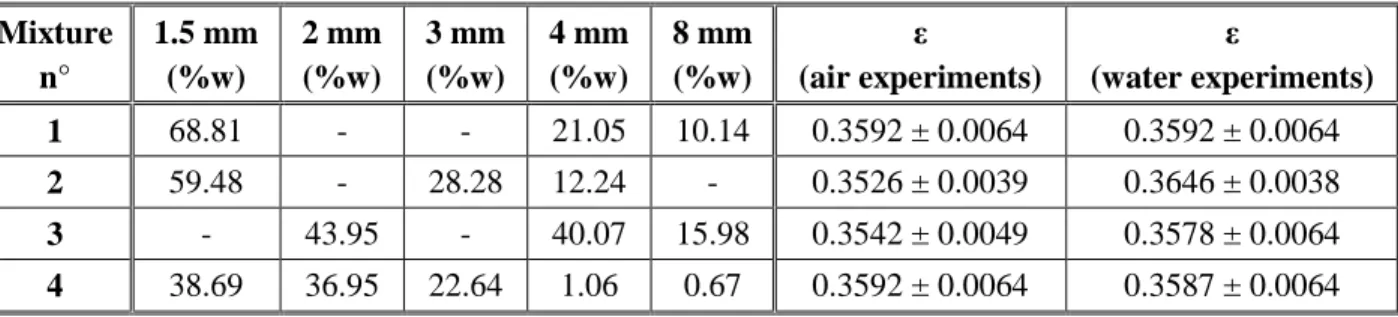
Table 4: Composition and measured porosities of multi-sized spherical particle beds Mixture n° 1.5 mm (%w) 2 mm (%w) 3 mm (%w) 4 mm (%w) 8 mm (%w) ε (air experiments) ε (water experiments) 1 68.81 - - 21.05 10.14 0.3592 ± 0.0064 0.3592 ± 0.0064 2 59.48 - 28.28 12.24 - 0.3526 ± 0.0039 0.3646 ± 0.0038 3 - 43.95 - 40.07 15.98 0.3542 ± 0.0049 0.3578 ± 0.0064 4 38.69 36.95 22.64 1.06 0.67 0.3592 ± 0.0064 0.3587 ± 0.0064
3 SINGLE-PHASE PRESSURE LOSS CORRELATION IN POROUS MEDIA
3.1 The Equivalent Diameter Concept
The Ergun law (equation (3)) is a validated empirical model for pressure losses prediction in monodisperse beds [14]. This law involves the sum of a linear term and a quadratic term, with respect to the filtration velocity, the coefficients of these terms including two macroscopic characteristics of the medium called “permeability” and “passability”, calculated by equations (4) and (5).
When the bed is composed of non-spherical and/or multi-sized particles, the equivalent diameter is defined as the dimension allowing a correct prediction of permeability and/or passability:
(
)
2 2 3 1ε
ε
− = K K h d K (7)(
ε
)
ε
η
η η − = 1 3 h d (8)where ε is the porosity of the bed, hK and hη are the so-called Ergun constants, and dK and dη are the
equivalent diameters for permeability and passability. It should be noted that dK and dη may be a priori
different.
Many definitions have been proposed in literature for equivalent diameters [7,16]. Table 5 presents possible definitions of equivalent diameters for non-spherical or multi-sized spherical particle beds. The objective of this section is to assess the possibility to define equivalent diameters by checking if one of these definitions constitutes a general prediction of the equivalent diameter.
This very empirical approach has been found relevant to predict permeability of debris-bed-like media [19]. It is proposed here to extend this concept to non-Darcy flows.
3.2 The Ergun Constants
In literature, recommended values for Ergun constants range between 150 and 180 for hK and between 1.6
and 4 for hη [14,15,16]. In order to eliminate this source of uncertainty, best fitting values for hK and hη
have been experimentally identified for monodisperse beds packed with spherical particles presented in Table 1, in air and water flows. In the following paragraphs, mean values, i.e., 181 ± 17 for hK and
Table 5: Equivalent diameters for non-monodisperse particle beds
Non-spherical particle beds Volume Equivalent diameter 3 / 1 6 =
π
part V v d Sauter Diameter part part part part St s v S V d = 6 = 6 Surface equivalent diameter 2 / 1 =π
part S s d Sauter diameter × Sphericity(
)
part part part part St s v s v d 3 / 2 3 / 1 6 6π
ψ
= ×Multi-sized particle beds Number mean diameter
∑
∑
= i i i n n d n d Surface mean diameter∑
∑
= 2 3 i i i i s d n d n d Length mean diameter∑
∑
= i i i i l d n d n d 2 Volume mean diameter∑
∑
= 3 4 i i i i v d n d n d3.3 Equivalent Diameter for Permeability dK
3.3.1 Observation of Darcy regime and identification of permeability
Permeability is directly deduced from linear regression between measurements of pressure losses and filtration speed at low flow rate, where Darcy regime occurs.
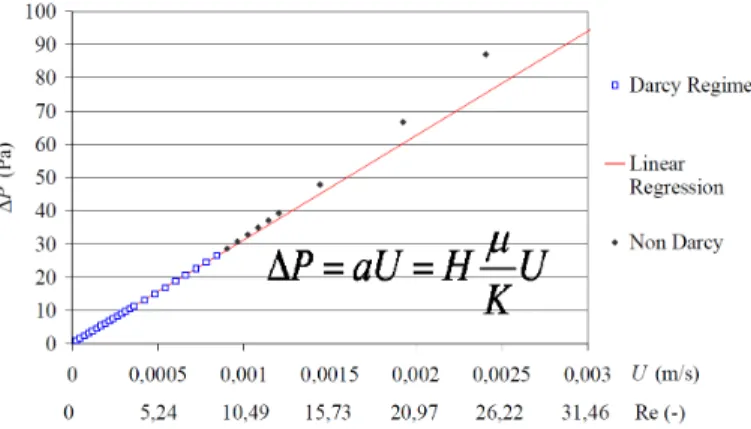
Figure 3: Experimental identification of Permeability and apparition of non-linear deviations to Darcy’s law (5×8 mm cylinders in water flow)
For instance, Figure 3 shows the evolution of pressure losses versus filtration velocity in Darcy and beginning of non-Darcy regimes in the case of 5×8 mm cylinders in water flow. A linear dependence,
corresponding to Darcy’s law, is observed for low velocities, up to 0.8 mm/s, or Re = 8 (blue squares in Figure 3). The proportional coefficient a between pressure losses and filtration speed in Darcy regime is determined by linear regression. According to Darcy’s law, the permeability can be deduced from a by:
a H
K =
µ
. (9)The permeabilities of all non-spherical and multi-sized spherical particle beds presented in Table 2 and Table 4 have been determined using this method, for air and water flows.
3.3.2 Equivalent diameter
The equivalent diameter for permeability dK is deduced from the Permeability, the porosity of the bed and
the first Ergun constant hK by reversing equation (7):
(
)
K h d K K 3 2 1ε
−ε
= . (10)Table 6 summarizes the values of equivalent diameters of all tested particle beds, in air and water flows, and their relative distances to the equivalent diameters presented in Table 5. Confidence intervals on the experimental values of dK are also reported. It should be pointed out first that experimental values of dK
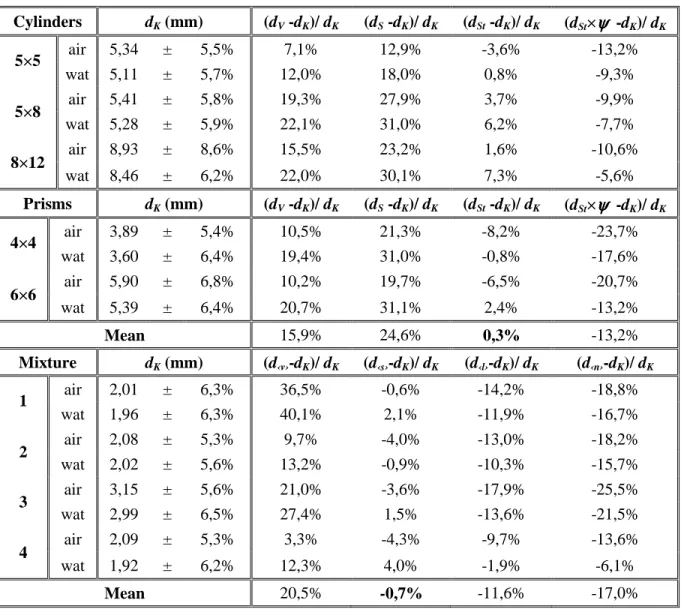
are independent of the flowing fluid, since the confidence intervals of air and water flow values always overlap each other. This observation is an indicator of the relevance of the notion of equivalent diameter. It can be seen in Table 6 that the average distance between the Sauter diameter and the experimental values of dK is the smallest, +0.3 %, and the only one to be smaller than the confidence intervals of dK.
Furthermore, when considering each particle bed individually, it appears that the Sauter diameter is always the closest to the experimental value of dK, except for 8×12 mm cylinders in water flow, where the
difference is 7.3 %, which remains very small. As a consequence, the Sauter diameter can be
recommended as a good equivalent diameter for permeability of non-spherical particle beds.
In the case of multi-sized spherical particle beds, the same observations can be made concerning the surface mean diameter, which is the closest to the experimental value of dK, both in average (-0.7 %
difference) and for each tested bed individually. Therefore, the surface mean diameter is recommended as
an equivalent diameter for permeability of multi-sized spherical particle beds.
It is of fundamental interest to point out here that these observations are consistent, because the surface mean diameter of a mixture of spherical particles is equal to its Sauter diameter:
St part part i i i i i i i i i i i i s d S V s n v n d n d n d n d n d = = = = =
∑
∑
∑
∑
∑
∑
6 /6 6 6 2 3 2 3π
π
. (11)Therefore, we may conclude that the equivalent diameter for permeability of polydisperse beds is the
Table 6: Comparison between experimental value of the equivalent diameter for permeability and equivalent diameters from Table 5
Cylinders dK (mm) (dV -dK)/ dK (dS -dK)/ dK (dSt -dK)/ dK (dSt×ψψψψ -dK)/ dK air 5,34 ± 5,5% 7,1% 12,9% -3,6% -13,2% 5×5 wat 5,11 ± 5,7% 12,0% 18,0% 0,8% -9,3% air 5,41 ± 5,8% 19,3% 27,9% 3,7% -9,9% 5×8 wat 5,28 ± 5,9% 22,1% 31,0% 6,2% -7,7% air 8,93 ± 8,6% 15,5% 23,2% 1,6% -10,6% 8×12 wat 8,46 ± 6,2% 22,0% 30,1% 7,3% -5,6% Prisms dK (mm) (dV -dK)/ dK (dS -dK)/ dK (dSt -dK)/ dK (dSt×ψψψψ -dK)/ dK air 3,89 ± 5,4% 10,5% 21,3% -8,2% -23,7% 4×4 wat 3,60 ± 6,4% 19,4% 31,0% -0,8% -17,6% air 5,90 ± 6,8% 10,2% 19,7% -6,5% -20,7% 6×6 wat 5,39 ± 6,4% 20,7% 31,1% 2,4% -13,2% Mean 15,9% 24,6% 0,3% -13,2% Mixture dK (mm) (d‹v›-dK)/ dK (d‹s›-dK)/ dK (d‹l›-dK)/ dK (d‹n›-dK)/ dK air 2,01 ± 6,3% 36,5% -0,6% -14,2% -18,8% 1 wat 1,96 ± 6,3% 40,1% 2,1% -11,9% -16,7% air 2,08 ± 5,3% 9,7% -4,0% -13,0% -18,2% 2 wat 2,02 ± 5,6% 13,2% -0,9% -10,3% -15,7% air 3,15 ± 5,6% 21,0% -3,6% -17,9% -25,5% 3 wat 2,99 ± 6,5% 27,4% 1,5% -13,6% -21,5% air 2,09 ± 5,3% 3,3% -4,3% -9,7% -13,6% 4 wat 1,92 ± 6,2% 12,3% 4,0% -1,9% -6,1% Mean 20,5% -0,7% -11,6% -17,0%
3.4 Passability Equivalent Diameter dηηηη
3.4.1 Observation of inertial regime and identification of passability
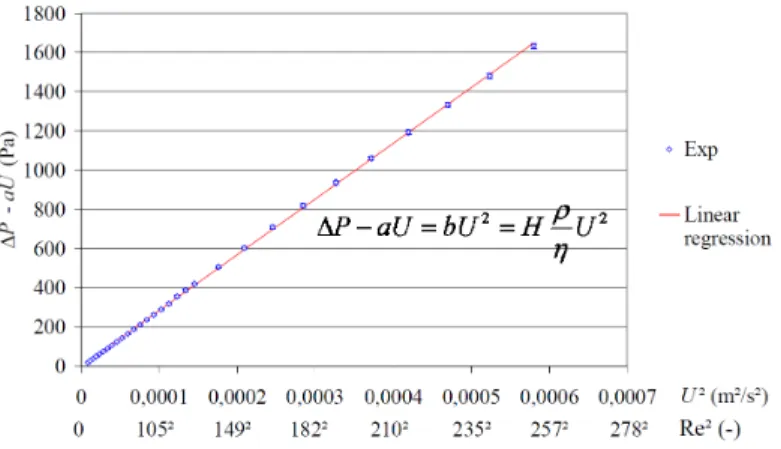
Skipping the discussion about weak inertia regime (see for example Lasseux [11]) which has no practical impact in our applications, non-linear deviations to Darcy’s law in particle beds are usually approximated by a quadratic law, as in Equation (3). Figure 4 shows the evolution of these deviations versus filtration velocity squared for 5×8 mm cylinders in water flow. Non-linear deviations to Darcy’s law are calculated as the difference between pressure loss measurements and the Darcy term aU obtained during the phase of determination of the permeability (in Figure 3 for 5×8 mm cylinders). It is clear on Figure 4 that they depend linearly on the square of the filtration velocity, which confirms that the quadratic law is a good approximation in the inertial regime. It should also be pointed out that it remains valid for Reynolds numbers of several hundreds (Re = 257 in Figure 4), where weak turbulence, at least should occur at the pore scale level [12]. The validity of the quadratic law for non-linear deviations to Darcy’s law can
therefore be extended to weak turbulent regimes. Similar behaviors have been observed for all tested particle beds.
Thus, passability can be deduced from linear regression between non-linear deviations to Darcy’s law and filtration velocity squared. It is calculated by:
b H
ρ
η
= , (12)where b is the linear coefficient between non-linear deviations to Darcy’s law and filtration velocity squared. Passabilities of all tested particle beds have been determined using this method, for air and water flows.
Figure 4: Experimental identification of passability (5×8 mm cylinders in water flow)
3.4.2 Equivalent diameter
Similarly to the equivalent diameter for permeability, the equivalent diameter for passability dη is deduced from the passability and the porosity of the bed and the second Ergun constant hη, by reversing
equation (8):
(
)
K h d 13ε
ε
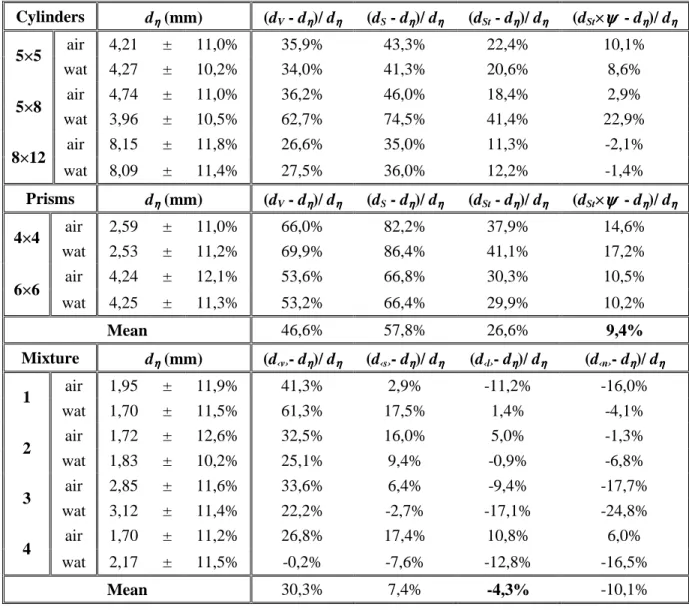
η η − = . (13)Table 7 summarizes experimental values of dη in air and water flows, and their relative distances to the equivalent diameters presented in Table 5. As for Table 6, confidence intervals on the experimental values of dη are also reported.
It can be seen on Table 7 that the closest equivalent diameter to the experimental value of dη is the
product of the Sauter diameter and the sphericity coefficient dSt×ψ, which presents the smallest distance
with experimental values of dη, in average (+9.4 %) as well as for each bed individually. The product of
the Sauter diameter and the sphericity coefficient is therefore recommended for the equivalent diameter for passability of non-spherical particle beds.
Table 7: Comparison between experimental value of the equivalent diameter for passability and equivalent diameters from Table 5
Cylinders dηηηη (mm) (dV - dηηηη)/ dηηηη (dS - dηηηη)/ dηηηη (dSt - dηηηη)/ dηηηη (dSt×ψψψψ - dηηηη)/ dηηηη air 4,21 ± 11,0% 35,9% 43,3% 22,4% 10,1% 5×5 wat 4,27 ± 10,2% 34,0% 41,3% 20,6% 8,6% air 4,74 ± 11,0% 36,2% 46,0% 18,4% 2,9% 5×8 wat 3,96 ± 10,5% 62,7% 74,5% 41,4% 22,9% air 8,15 ± 11,8% 26,6% 35,0% 11,3% -2,1% 8×12 wat 8,09 ± 11,4% 27,5% 36,0% 12,2% -1,4% Prisms dηηηη (mm) (dV - dηηηη)/ dηηηη (dS - dηηηη)/ dηηηη (dSt - dηηηη)/ dηηηη (dSt×ψψψψ - dηηηη)/ dηηηη air 2,59 ± 11,0% 66,0% 82,2% 37,9% 14,6% 4×4 wat 2,53 ± 11,2% 69,9% 86,4% 41,1% 17,2% air 4,24 ± 12,1% 53,6% 66,8% 30,3% 10,5% 6×6 wat 4,25 ± 11,3% 53,2% 66,4% 29,9% 10,2% Mean 46,6% 57,8% 26,6% 9,4% Mixture dηηηη (mm) (d‹v›- dηηηη)/ dηηηη (d‹s›- dηηηη)/ dηηηη (d‹l›- dηηηη)/ dηηηη (d‹n›- dηηηη)/ dηηηη air 1,95 ± 11,9% 41,3% 2,9% -11,2% -16,0% 1 wat 1,70 ± 11,5% 61,3% 17,5% 1,4% -4,1% air 1,72 ± 12,6% 32,5% 16,0% 5,0% -1,3% 2 wat 1,83 ± 10,2% 25,1% 9,4% -0,9% -6,8% air 2,85 ± 11,6% 33,6% 6,4% -9,4% -17,7% 3 wat 3,12 ± 11,4% 22,2% -2,7% -17,1% -24,8% air 1,70 ± 11,2% 26,8% 17,4% 10,8% 6,0% 4 wat 2,17 ± 11,5% -0,2% -7,6% -12,8% -16,5% Mean 30,3% 7,4% -4,3% -10,1%
In the case of multi-sized spherical particle beds, number, length and surface mean diameters present average distances to experimental values of dη smaller than their confidence intervals. Therefore, each one of these 3 equivalent diameters could be recommended. However, when looking at each bed separately, it appears that the surface mean diameter is the closest to the experimental values of dη for 50 % of beds, while the length and number mean diameters constitute the best prediction for 25 % of beds each. Therefore, the surface mean diameter is recommended for the equivalent diameter for passability of
multi-sized particle beds.
As for permeability, the recommended equivalent diameters for passability of non-spherical particle beds and multi-sized spherical particle beds are consistent, since the surface mean diameter of a mixture of spheres is the Sauter diameter (equation (11)) and the sphericity coefficient is 1 for spheres. Therefore,
the equivalent diameter for passability of polydisperse beds is the product of the Sauter diameter and the sphericity.
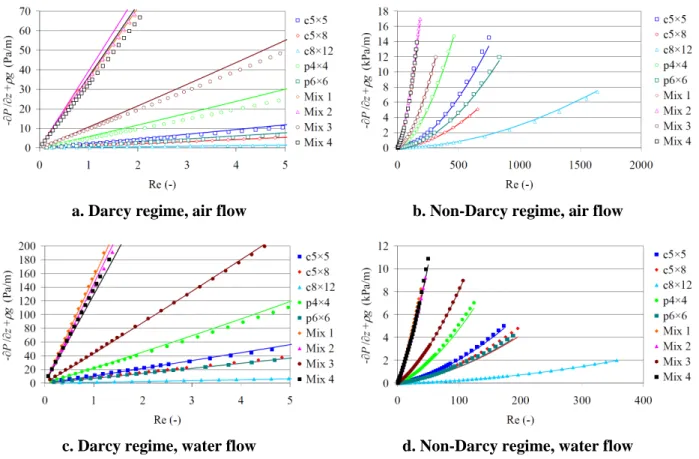
a. Darcy regime, air flow b. Non-Darcy regime, air flow
c. Darcy regime, water flow d. Non-Darcy regime, water flow
Figure 5: Direct comparison between experiments (symbols) and equation (14) (continuous lines)
As a conclusion, the following correlation accurately predicts single-phase pressure losses for all tested particle beds:
(
)
2 3 2 3 21
63
.
1
1
181
U
d
U
d
g
z
P
St Stρ
ψ
ε
ε
µ
ε
ε
ρ
=
−
+
−
+
∂
∂
−
. (14)In Figure 5 the prediction of equation (14) is compared to experimental data in the entire investigated domain, which covers Re = 0 to Re = 1500. This prediction is very close to experimental values, with a mean difference of the order of 10 %, in both Darcy (linear) and inertial (non-linear) regimes, and for both air and water flows.
The relevance of the notion of equivalent diameter is therefore demonstrated for the class of media investigated here, and the use of equation (14) is recommended for the prediction of single-phase pressure losses during reflooding of debris beds.
4 CONCLUSIONS
Motivated by uncertainty reduction in nuclear debris beds coolability, experiments have been conducted on the CALIDE facility in order to investigate single phase pressure losses in representative debris beds.
In this paper, experimental results obtained on the CALIDE facility have been presented and analyzed in order to identify a simple single-phase flow pressure loss correlation for debris-bed-like particle beds covering reflooding flow conditions. The CALIDE facility, characteristic flowing conditions of reflooding and debris bed size have been presented.
Experimental data obtained on the CALIDE facility have been interpreted to determine the macro-scale behavior of pressure losses in particle beds. It was observed that a Darcy-Forchheimer law, involving the sum of a linear term and a quadratic term, with respect to fluid velocity, was relevant to describe this behavior in Darcy, inertial and weak turbulent regimes.
Darcy-Forchheimer law allowing a qualitative description of pressure losses only, it was necessary to determine expressions for coefficients of linear and quadratic terms in order to obtain a predictive correlation. Applicability of the Ergun’s law, which is valid for monodisperse particle beds only, was investigated by assessing the possibility to define equivalent diameters for the studied beds. This approach has been found to be relevant for the prediction of permeability of debris beds. It was observed that permeabilities of all tested beds, i.e., non-spherical and multi-sized spherical particle beds, could be precisely predicted by Ergun expression using the Sauter diameter, while the product of the Sauter diameter and the sphericity coefficient ψ allowed for an accurate prediction of passabilities. Therefore, the following correlation can be recommended for calculation of single-phase pressure losses in nuclear debris beds during reflooding, for Reynolds numbers ranging from 0 to 1500.
(
)
2 3 2 3 21
63
.
1
1
181
U
d
U
d
g
z
P
St Stρ
ψ
ε
ε
µ
ε
ε
ρ
=
−
+
−
+
∂
∂
−
. (15) 5 REFERENCES1. Broughton, J., Kuan, P., Petti, D., Tolman, E., “A scenario of the Three Mile Island Unit-2 accident”,
Nucl.Tech. 87, pp. 34–53 (1989)
2. Hobbins, R., McPherson, G., “A summary of results from the LOFT LP-FP-2 test and their relationship to other studies at the Power Burst Facility and of the Three Mile Island Unit-2 accident”,
Proceedings of LOFT Open Forum, Madrid, Spain (1990)
3. Repetto, G., “Rapport définitif de dépouillement de l’essai B9R et résultats complémentaires de l’essai B9”, Tech. Rep. PHEBUS CSD 118/90, CEA (1990)
4. Petti, D., Martinson, Z., Hobbins, R., Allison, C., Carlson, E., Hargman, D., Cheng, T., Hartwell, J., Vinjamuri, K., Seifken, L., “Power Burst Facility (PBF) severe fuel damage test: 1-4 Test result report”, U.S. Nuclear Regulatory Commission NUREG/CR-5163, EGG-2542 (1989)
5. Bachrata, A., Fichot, F., Repetto, G., Quintard, M., Fleurot, J., “Quench front progression in a superheated porous medium: experimental analysis and model development”, J. of En. & Power Eng.
7, pp. 514-523 (2013)
6. Li, L., Ma, W., “Experimental characterization of the effective particle diameter of a particulate bed packed with multi-diameter spheres”, Nucl. Eng. and Des. 241, pp. 1736–1745 (2011)
7. Li, L., Ma, W., “Experimental study on the effective particle diameter of a packed bed with non-spherical particles”, Transp. in Porous Med. 89, pp. 35–48 (2011)
8. Repetto, G., Garcin, T., Eymery, S., Fichot, F., “Experimental program on debris refreflood (PEARL) - Results on PRELUDE facility”, Nucl.Eng. and Des. 264, pp. 176–186 (2011)
9. Chikhi, N., “First experimental results of large scale debris bed reflood tests in the PEARL facility”,
Proc. of 16th Int. Topical Meeting on Nuclear Reactor Thermal-Hydraulics (NURETH 16) (2014).
10. Mei, C., Auriault, J., “The effect of weak inertia on flow through a porous medium”, Journal of Fluid
11. Lasseux, D., Abbasian, A., Ahmadi, A., “On the stationary macroscopic inertial effects for one-phase flow in ordered and disordered porous media”, Physics of Fluids 23, (2011)
12. Chauveteau, G., Thirriot, C.L., “Régimes d’écoulement en milieu poreux et milite de la loi de Darcy”,
La Houille Blanche, 2, pp.141-148 (1967)
13. Forchheimer, P., “Wasser Bewegung durch Boden”, Z. Ver. Deutsch Ing. 45, pp. 1782–1788 (1901) 14. Ergun, S., “Fluid flow through packed columns”, Chem. Eng. Prog. 48(2), pp. 89–94 (1952)
15. MacDonald, I., El-Sayed, M., Mow, K., Dullien, F., “Flow through porous media - the Ergun equation revisited”, Ind. and Eng. Chem. Fund. 18, pp. 199–208 (1979)
16. Ozahi, E., Gundogdu, M.-Y., Carpinlioglu, M.-O., “A modification on Ergun’s correlation for use in cylindrical packed beds with non-spherical particles”, Adv. Powder Tech. 19, pp. 369–381 (2008) 17. Nemec, D., Levec, J., “Flow through packed bed reactors: 1. Single phase flow”, Chem. Eng. Sc. 60,
pp. 6947–6957 (2005)
18. Shaban, H., Khan, A., “Pressure-related operational problems and their remedies in hydrotreating reactors in petroleum refineries”, J. of Petr. Sc. and Eng. 14, pp. 79–88 (1995)
19. Chikhi, N., Coindreau, O., Li, L., Ma, W., Taivassalo, V., Takasuo, E., Leininger, S., Kulenovic, R., Laurien, E., “Evaluation of an effective diameter to study quenching and dry-out of complex debris bed”, Annals of Nuclear Energy 74, pp. 24–41 (2014)
20. Repetto, G., Chikhi, N., Fichot, F., “Mains outcomes on debris bed cooling from PRELUDE experiments”, Proc. of 6th Eur. Rev. meeting on Severe Accident Research (ERMSAR-2013) (2013) 21. Durin, T., Rahni, N., Guigueno, Y., Raimond, E., “L2 PSA development and review activities of
IRSN in the framework of the 3rd PSR of the French 1300 MWe PWR series”, Proc. of Int. Topical
Meeting on Probabilistic Safety Assessment and Analysis 2013, PSA 2013, 3, pp. 2434–2445 (2013)
22. Olander, D., “Fundamental aspects of nuclear reactor fuel elements”, USDOE Report, TID-26711-P1 (1990)
23. Akers, D., Carlson, E., Cook, B., Ploger, S., Carlson, J., “TMI-2 core debris grab samples - examination and analysis”, Tech. rep., Sandia National Laboratory GEND-INF-075 (1986)
24. Coindreau, O., Fichot, F., Fleurot, J., “Nuclear fuel rod fragmentation under accident conditions”,
Nucl.Eng. and Des. 255, pp. 68–76 (2013)
25. Magallon, D., Huhtiniemi, I., “Corium melt quenching tests at low pressure and subcooled water in FARO”, Nucl.Eng. and Des. 204, pp. 369–376 (2001)
26. Bürger, M., Buck, M., Schmidt, W., Widmann, W., “Validation and application of the WABE code: investigations of constitutive laws and 2D effects on debris coolability”, Nucl.Eng. and Des. 236, pp. 2164–2188 (2006)