A Raster SOLAP Designed for the Emergency Services of Brussels Agglomeration
Kasprzyk Jean-Paul
SEGEFA e-mail: [email protected]Donnay Jean-Paul
Geomatics Unit e-mail: [email protected] University of Liege Department of Geography Liege, Belgium Abstract— In order to quickly reach incident locations,emergency services have to fairly distribute their resources on the territory. This distribution is based on an analysis which depends on heterogeneous spatial data like past interventions (recurring risk), specific geographical places (sporadic risk), road network or socio-economic variables. On the other hand, Spatial Online Analytical Processing (SOLAP) tools are designed for the collection and the analysis of large spatial data sets. In this study, an original raster SOLAP model is implemented for emergency services of Brussels agglomeration. It allows decision-makers to freely generate risk maps (continuous fields), depending on several dimensions (time, intervention type, risk type, etc.), and to compare them with the accessibility of firefighters and ambulances. Simulations can also be performed on resources locations to see their impact on the main accessibility.
Keywords-GIS; Risk Analysis; Data Warehouse; Fields; Firefighting.
I. INTRODUCTION
In order to quickly reach incident locations, emergency services (including firefighters and medical aids) have to fairly distribute their resources on the territory. This distribution is a complex problem since it has to be adapted to a risk model which depends on heterogeneous spatial data sets: past interventions, population, buildings, road network, etc.
On the other hand, Business Intelligence [8] and Geographic Information Systems (GIS) include efficient tools for the collection and the analysis of large amounts of spatial data. Amongst them, SOLAP Spatial Online Analytical Processing (SOLAP) tools allow decision makers to freely explore spatial data warehouses through interactive maps, tables or charts [1][2]. The information from SOLAP is summarized (aggregated), thus more easily analyzed by the decision-makers. The objective of this research is the
design of a SOLAP adapted to the needs of the emergency services of Brussels.Thanks to SOLAP, they should be able to easily collect the data and analyze the risk so as to adequately deploy their resources in the territory of the Brussels agglomeration.
The remainder of this paper is structured as follows. Section II is a state of the art about risk analysis for emergency services (subsection II-A) and SOLAP including explanations about SOLAP basics (subsection II-B). A
raster SOLAP model adapted to risk analysis is then deducted from this review of the literature (research hypothesis in subsection II-C). Section III describes the raster SOLAP model developed to reach the research objective. Its main architecture (subsection III-A) is composed on the one hand of a vector data warehouse in charge of data collecting/archiving (subsection III-B), and on the other hand, of several raster data cubes which allows risk calculations by the SOLAP (subsection III-C). The SOLAP model is then validated in section IV by the SOLAP interface, which allows users to explore raster data cubes through interactive risk maps. Section V contains conclusions and perspectives of this paper.
II. STATE OF THE ART A. Risk Analysis
Risk can be divided into two distinct categories (and so two distincts models): recurring risk and sporadic risks [9].
Recurring risk is the probability of incidents, which can be estimated from historical interventions. These data are mainly characterized by time, space and intervetion type. In particular, space can be modeled as a field [3][18] thanks to Kernel Density Estimation (KDE) [13]. It is very popular to identify hotspots of punctual events in a continuous space. For instance, it is offenly used by police for crime prevention [7][8]. Moreover, when points are aggregated with KDE, shapes of the hotspots suffer less from the Modifiable Areal Unit Problem (MAUP) [25] than with spatial aggregations, depending on administrative entities (communes, census tracts, etc.).
Sporadic risk does not depend on incidents frequencies, but on specific places that would require important resources from emergency services in the event of an incident: tunnels, schools, hospitals, etc. Once identified, these locations can be incorporated into a multicriteria analysis [11] to determine the sporadic risk, by weighting the human and material damages incurred in their vicinity.
In addition to the probabilistic nature of the recurring risk, it is possible to study the conditions favoring the emergence of the risk, no longer for an operational purpose, but for an urban planning objective. Population density, age of buildings and other environmental variables can be considered in a geographic regression model to explain the frequency of incidents [14].
Once the risk model has been completed, the adequacy of the response by the emergency services can be assessed by the travel times required by the various concerned resources (personnel and specific equipment) to reach the claims sites. This step requires an up-to-date and precise road graph with average speeds adapted to the emergency vehicles.
B. SOLAP
A SOLAP server allows decision makers to query data hypercubes (also simply called “data cubes”) extracted from a data warehouse. Data hypercubes are models of pre-aggregated data depending on several dimensions (for example: month, commune and incident type) [1]: combinations of dimension members define facts, and an aggregated measure is associated to every fact. For example, the combination of January 2016 (member of dimension “month”), fire incident (member of dimension “incident type”) and Anderlecht (member of geographical dimension “commune”) is a fact with an associated number of incidents (measure).
Users navigate into data hypercubes through interactive tables, charts or maps. Maps can represent spatial facts (defined by at least one geographical dimension like communes), and tables/charts can represent non-spatial facts (defined by non-spatial dimensions like months, incident types, etc.).
The SOLAP server is able to calculate the measure of every possible fact defined at a less detailed level of dimensions than the one stored in the data hypercube (for example, the number of incidents for the whole year 2016 instead of January 2016). This typical SOLAP operation is called “roll up” (on the time dimension in the previous example) and the reverse operation is called “drill down”. Filters on dimension members (for instance, facts defined by a specific month of the time dimension) are called “slices” in the SOLAP vocabulary.
Despite the heavy calculations that a “roll up” operation can require, a SOLAP must show quick results. For this purpose, the SOLAP literature proposes different strategies [1] like the precomputing of different hypercubes at different levels of details or the use of different physical structures: hypercubes modelled by arrays (Multidimensional OLAP or MOLAP) [11], by relational tables (Relational OLAP or ROLAP) [20] or both (Hybrid OLAP or HOLAP) [13].
Figure 1. Examples of map algebra operators, adapted from [23] Most of SOLAP tools are only able to use the vector model to represent spatial facts on maps [16] [29]. However, several researches showed the potential of raster SOLAP [17][18] [20][22] [24] [28]. The raster model is well adapted to the representation of data which are continuous in space (fields). Pixels of a raster can spatially define every type of geographical entities while the vector model uses three different primitives: point, line and polygon. The physical structure of raster is quite similar to MOLAP (arrays of data) and so the SOLAP aggregations can easily be computed by raster functions which are already implemented in most of spatial database management systems (DBMS). The most important functions [23] are local map algebra (Figure 1a) for aggregations on non-spatial dimensions and zonal map algebra (Figure 1b) for aggregations on geographical dimensions. Moreover, as the X and Y dimensions of space are defined in the multidimensional structure of raster SOLAP (a spatial member is a pixel) [17][18], any geographical dimension (for examples: the communes of Brussels) can be imported on the fly as a zone layer during the analysis.
C. Hypothesis
This distribution of resources for emergency services is a complex problem that requires the design of a risk model. As said in subsection II-A, a risk model integrates spatial data about recurring risk (historical interventions), sporadic risk (hospitals, schools, etc.) and socio-economic characteristics. Then, the risk model has to be confronted to the accessibility of emergency service resources. As said in subsection II-B, SOLAP tools are very useful for the integration and the analysis of large amounts of spatial and heterogeneous data, as required by the risk analysis. In particular, raster SOLAP has important advantages for this study: a continuous representation of a space for recurring risk, a single spatial primitive (pixel) for every type of geographical entities, etc. Therefore, a raster SOLAP can be designed to help emergency services of Brussels to fairly distribute their resources on the territory.
III. RASTER SOLAP MODEL A. Main architecture
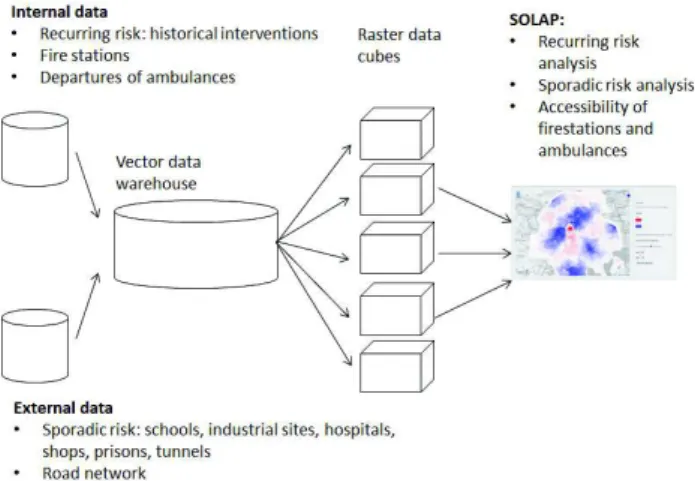
The main structure of the SOLAP is a typical “Business Intelligence” architecture (Figure 2). Data are extracted from different sources and archived in a spatial data warehouse (subsection III-B). At this stage, data are still in their native vector format. Then, vector data are used to create five raster data cubes (subsection III-C): recurring risk for fires, recurring risk for medical aids, sporadic risks, accessibility of firefighters and accessibility of medical aids. Users can then manipulate these raster cubes in the SOLAP interface to compute different risk maps.
Figure 2. Main architecture of the SOLAP
As mentioned above, spatialized variables of demography, environment, buildings, etc., can also be integrated into the SOLAP for urban planning objective, but this aspect is not developed here.
B. Spatial data warehouse
Some data were directly provided by emergency services of Brussels (internal data):
· fire stations and departures of ambulances georeferenced as points;
· past interventions from 2012 to 2016 georeferenced as points with time and type (the two main categories are fires and medical aids) for recurring risk (around 350 000 incidents). Some data were obtained from the appropriate suppliers or directly downloaded (open data). A first category of these external data are the ones defined by emergency services as sources of sporadic risk:
· school buildings with more than 1000 students (around 80 points with an attribute “number of students”);
· dangerous industrial sites (UE Seveso directive) with a “risk level” attribute (4 points);
· prisons (2 points);
· hospitals with a “number of beds” attribute (around 80 points);
· main shopping zones with a “type” attribute (around 100 polygons) [2];
· tunnels with a length superior to 400m (around 200 polygons).
A second category of external data is the road graph of Brussels extracted from Open Street Map (OSM) [26]. It covers a larger territory than Brussels because the quicker path between two points inside Brussels is not always entirely included in the city (which is surrounded by an important motorway). Arcs are associated to an average speed that was fixed with firefighters of Brussels for each road type of OSM. There is a speed for the two crossing directions in order to model prohibited directions (associated to a very slow speed). Note that OSM road data for Brussels are geometrically based on accurate UrbIS data which are supplied by Brussels Regional Informatics Centre (BRIC) [6].
C. Raster Data Cubes 1) Recurring risk
Conceptually, the multidimensional structure of a raster data cube can be described by a star schema. Figure 3 is the star schema for recurring risks. It is characterized by three non-spatial dimensions and two spatial dimensions. The raster SOLAP model used in this study, including the management of KDE, is based on [17][18]. Note that recurring risk data cubes about fires or about medical aids are described by the same star schema. Only the members of the “incident type” dimension are different.
Figure 3. Star schema of a recurring risk data cube
Non-spatial dimensions are incident type, hour range (3 hours) and day of the week. Physically, these dimensions are managed as a ROLAP model [20]: a non-spatial fact is the record of a fact table and the member of each non-spatial dimension describing the fact is stored in a specific attribute (incident type, hour range and day of week). The measure of the non-spatial detailed fact is stored in a raster attribute. The theoretical number of records of the fact table is
determined by the Cartesian product of the three non-spatial dimensions. For instance, the raster cube for fire recurring risk should have 224 records (detailed facts): 4 incident types * 8 hour ranges * 7 days of week. This value grows exponentially with the number of dimensions. For this reason, a raster cube cannot involve too many non-spatial dimensions to be able to quickly compute “roll up” aggregations. Note that concretely, the number of detailed facts can be inferior to the theoretical value if the density of the data cube is less than 100% (some detailed facts can have a null measure). This is an advantage of the ROLAP model, which does not have to store null facts (contrary to MOLAP or raster).
Physically, spatial dimensions (X and Y) are directly managed in the ROLAP measure (a raster attribute). At the raster level, a spatial fact is a pixel which is characterized by a raster measure (the pixel value), a member for X and a member for Y. These spatial dimensions members are determined by the position of the pixel in the raster array like for MOLAP. Therefore, the raster SOLAP model is also characterized by MOLAP advantages (fast aggregations on arrays) and disadvantages (null pixels have to be stored). Note that every raster of the fact table is characterized by the same resolution (100 m) and the same spatial coverage [16].
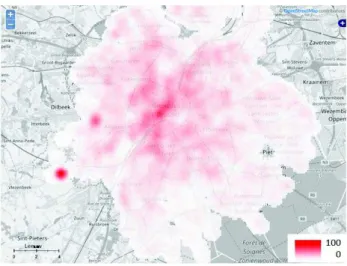
When a raster cube is created for recurring risks, a KDE raster is computed for the ROLAP measure of every non-spatial fact with the same parameters: resolution of 100 m, a quartic KDE function and a KDE bandwidth of 500 m (this parameter determines the smoothing of the field). It has been demonstrated [17] that aggregating KDE measures with local map algebra is equivalent to the computation of a KDE with all the points that should be involved in the SOLAP aggregation (if KDE parameters are identical for every non-spatial fact). Therefore, maps resulting from SOLAP operations on these data cubes are KDE fields of recurring risk. They are the result of a simple sum aggregation (local map algebra), then normalized to range from 0 to 100. An example is given by Figure 4. It is a map of recurring risk for indoor fires including all days of the week and all hour ranges.
Figure 4. Recurring risk for indoor fires
The other raster data cubes are characterized by a similar star schema for the spatial dimensions (resolution of 100 m). Consequently, only the non-spatial dimensions and the raster measure (pixel value) will be discussed in the following subsections.
2) Sporadic risks
The star schema of the raster cube for sporadic risk is only characterized by one non-spatial dimension: the source of risk. Its dimension members are schools, hospitals, tunnels, industrial sites, commercial areas and prisons. When punctual entities (schools, hospitals, industrial sites and prisons) are rasterized, their spatial shape is a buffer of 300 m. For zonal entities (tunnels and shopping zones), the shape of the native polygons is used.
The raster measure is a weight reflecting the risk generated by the source:
· hospitals: number of beds; · schools: number of students;
· commercial areas: 1 for secondary poles, 2 for primary poles and shopping centers, 3 for “rue Neuve” (a very populated shopping street in Brussels) [2];
· industrial sites: 1 for “low risk” industries and 2 for “high risk” industries in the Seveso description;
· prisons: 1 for all; · tunnels: 1 for all.
After their rasterisation, these six measures are normalized to range from 0 to 100.
As it is characterized by only one non-spatial dimension (source of risk), the fact table for sporadic risk has only six non-spatial facts (records). The local map algebra operation for the SOLAP aggregation on this dimension is a weighted sum for which weights were determined with the Brussels fire department:
· hospitals: 0.2; · schools: 0.2;
· commercial areas: 0.1; · industrial sites: 0.15; · prisons: 0.2; · tunnels: 0.15.
Figure 5. Sporadic risk
Figure 5 shows a map of sporadic risks including all sources (pixels values are normalized to range from 0 to 100).
3) Resources accessibility
The star schema of the two raster cubes for resources accessibilities are also characterized by one non-spatial dimension: fire stations for firefighters (first raster cube) and departures of ambulances for medical aids (second raster cube). The measure of a non-spatial fact is a raster,
modelling the accessibility of a specific resource. The measure of a spatial fact (a pixel value) is the travel time from the resource to the pixel location (in minutes). Note that in some cases, ambulances can start from fire stations too. These particular resources are present in both raster cubes (fire stations and ambulances departures).
When raster cubes are built, measures are calculated in this way. For a specific resource (a non-spatial fact), a vector routing algorithm calculates a travel time value for every node of the OSM graph through the quicker path. Then an interpolated value is associated to every pixel of a raster covering the region of interest.
As asked by emergency services, users can choose one threshold amongst three different values: 4 minutes, 7 minutes and 10 minutes. Beyond these thresholds, the accessibility of a resource is considered as null. Therefore, during the analysis, every pixel exceeding the chosen threshold is set to null. After that, remaining pixel values are transformed in order to obtain an accessibility index which grows when it gets closer to the resource and ranges from 0 to 100 (1).
' (100 *100) max
p
p = - (1)
In (1), p’ is the new pixel value, p is the original pixel value (travel time in minutes) and max is the maximum pixel value in the raster.
Figure 6. Accessibility of fire stations with a travel time threshold of 7 minutes
Finally, the local map algebra operation for the SOLAP aggregation on the resource dimension is a weighted sum. The weights can be set on the fly by the user in order to obtain an accessibility field adapted to previous risk maps. They reflect the amount of humans/materials present in the fire station or ambulance departure. For instance, Figure 6 shows an accessibility map of all fire stations with equal weights and with a travel time threshold of 7 minutes (pixels values are normalized to range from 0 to 100).
IV. VALIDATION
The raster SOLAP for emergency services of Brussels is implemented with open source tools only. The spatial DBMS PostgreSQL/PostGIS manages the vector data warehouses and the raster cubes. SOLAP aggregations are implemented with map algebra functions of PostGIS [28]. MapServer [21] delivers map results through Web Map Services (WMS) which are shown in the SOLAP web interface.
The SOLAP interface allows the user to do “slice” and “roll up” operations on the five raster cubes (recurring risk for fires and medical aids, sporadic risk, accessibility of firefighters and ambulances). It is also possible to add new resources and directly see their effect on the accessibility: after setting the new location on the interactive map, PGRouting (PostGIS extension for routing algorithms) calculates all the quicker paths and then PostGIS raster builds the new measure in the accessibility raster cube. As previously said, weights of fire stations and ambulance departures can also be modified on the fly. In addition to the risk analysis, emergency services are thus able to perform simulations about the spatial distribution of their resources.
The tool is also designed to easily integrate new data for future analysis. The creation of all raster cubes is automatized, including recurring risk (a KDE function has been implemented in PL/PGSQL language).
Let’s remember that SOLAP is a powerful tool to easily explore data. It gives all the keys that form the basis of a complete risk analysis: different sources of risk described through time/space dimensions and accessibility of emergency services resources. It is then up to the user to compare and interpret the different risk maps obtained with the SOLAP.
V. CONCLUSIONSANDPERSPECTIVES
The aim of this research was the design of a SOLAP for emergency services of Brussels agglomeration, which have to fairly distribute their resources on the territory (fire stations and ambulances). After a review of the literature about risk analysis and SOLAP, a raster SOLAP model was chosen to reach the objective. Following this model, a data warehouse was created to collect and archive spatial data involved in the risk study of Brussels (historical interventions, specific places of risk, road network, etc.). Several raster data cubes were then created to model the different aspects of the analysis: recurring risk, sporadic risk, accessibility of firefighters and ambulances. Finally, the model was validated by the implementation of the SOLAP architecture and its interface. It allows users to freely explore data by applying SOLAP operations (“slices” and “roll up”) on raster data cubes through interactive risk maps. Moreover, simulations can be performed on resources locations and weights (reflecting the amount of present human/materials) to see their effect on the main accessibility.
This research highlighted the interest of raster SOLAP for risk analysis. In comparison with vector SOLAP (most of current SOLAP tools), raster allows a continuous visualization of space adapted to the analysis of recurring risk through KDE maps. Moreover, all types of spatial entities can be described by a single primitive: the pixel. Raster SOLAP is quite easy to implement with spatial DBMS because raster operations (map algebra) can be directly used for data aggregations. More generally, SOLAP allows decision makers to proceed to risk analysis in a user-friendly environment which also includes the automatic integration of new data for future analyzes.
Finally, further improvements could be provided to this study. First, it was only possible to set one average speed to every arc of the road graph with the available data. This does not reflect the real situation of Brussels because the important congestion of the road network mainly depends on time dimensions: hour of the day and day of the week. With richer data, it would be easy to integrate these dimensions in raster cubes for accessibility. Secondly, for technical reasons, it was not possible to extract the durations of interventions from historical data. If it was available, the risk analysis could take it into account as a weight for each
point when KDE measures are computed. Indeed, the requisition time of emergency resources is an important factor in risk analysis.
ACKNOWLEDGMENT
The authors would like to express their thanks to SIAMU (“Service d'Incendie et d'Aide Médicale Urgente de la Région de Bruxelles-Capitale”) for providing this interesting case study.
REFERENCES
[1] Y. Bédard, “Spatial OLAP”, Forum annuel sur la R-D,
Géomatique VI: Un monde accessible, Montréal, November 1997.
[2] Y. Bédard, “Beyond GIS: Spatial Online Analytical
Processing and Big Data”, The 2014 Dangermond Lecture, Santa-Barbara, 2014.
[3] S. Bimonte, Integration of geographic information in data warehouses and online analysis: from modeling to visualization (Intégration de l’information géographique dans les entrepôts de données et l’analyse en ligne: de la modélisation à la visualisation), PhD, Institut National des Sciences Appliquées de Lyon, Lyon, 2007.
[4] S. Bimonte and M. A. Kang, “Towards a model for the multidimensional analysis of field data, in Proceedings of the Fourteenth east European conference on advances in databases and information systems”, B. Catania, M. Ivanovic and B. Thalheim, Eds. Berlin : Springer-Verlag, 2010, pp. 58-72.
[5] Brussels-Capital Region. Retail Observatory 2011, available
at
<http://urbanisme.irisnet.be/pdf/observatoire-du-commerce-2011>, retrieved [January, 2017].
[6] BRIC, Brussels Regional Informatics Centre —
CIRB-CIBG-BRIC, Available at <http://cirb.brussels/>, [retrieved : January, 2017]
[7] S. P. Chainey, L. Tompson, and S. Uhlig, “The utility of hotspot mapping for predicting spatial patterns of crime”, Security Journal, vol. 21, 2008, pp. 4-28.
[8] S. P. Chainey, “Examining the influence of cell size and bandwidth size on kernel density estimation crime hotspot maps for predicting spatial patterns of crime”, Bulletin of the Geographical Society of Liege, vol. 60, 2013, pp. 7-19.
[9] T. Chee et al., “Business Intelligence systems: state-of-the-art review and contemporary applications, Symposium on Progress in Information and Communication Technology”, Kuala Lumpur, 2009, pp. 96-101.
[10] P. Chevalier et al, Locating fire stations: An integrated approach for Belgium, Socio-Economic Planning Sciences, Vol. 46(2), 2012, pp. 173–182.
[11] E. F. Codd, S. B Codd, and C. T. Salley, Providing OLAP (On-line Analytical Processing) to User-Analysts: An IT Mandate, E.F Codd and Associates, 1993.
[12] M. N. Demers. GIS Modeling in Raster. New York : John Wiley & Sons, 2001.
[13] M. Di Salvo, M. Gadais, and G. Roche-Woillez, The kernel density estimation : methods and tools (L’estimation de la densité par la méthode du noyau: méthodes et outils), Lyon : Certu, 2005.
[14] B. Espinasse, Data warehouses: OLAP systems: ROLAP, MOLAP and HOLAP (Entrepôt de données: Systèmes OLAP: ROLAP, MOLAP et HOLAP). Ecole Polytechnique Universitaire de Marseille, 2013.
[15] N. Guldaker and P. O. Hallin, Spatio-temporal patterns of
determinants: A case study of Malmö, Sweden, Fire Safety Journal, Vol. 70, 2014, pp. 71–80.
[16] Intelli³, available at <http://www.intelli3.com>, [retrieved : january, 2017].
[17] ISO 19123. Geographic information - Schema for coverage geometry and functions, 2005.
[18] J. P. Kasprzyk, Integration of spatial continuity in the multi-dimensional structure of a data warehouse – raster SOLAP (Intégration de la continuité spatiale dans la structure multidimensionnelle d’un entrepôt de données – SOLAP raster), PhD, Université de Liège, 2015, Available at <http://hdl.handle.net/2268/182360>.
[19] J. P. Kasprzyk and J. P. Donnay, A raster SOLAP for Visualization of crime data fields. GEOProcessing 2016 : The Eighth International Conference on Advanced Geographic Information Systems, Applications, and Services, Venice, 24-28 april 2016, pp. 109-117.
[20] R. Kimball and M. Ross, The Data Warehouse Toolkit: The Definitive Guide to Dimensional Modeling, Third Edition, New York : John Wiley and Sons, 2013.
[21] J. Li, L. Meng, F. Z. Wang, W. Zhang, and W. Cai. “A Map-Reduce-enabled SOLAP cube for large-scale remotely sensed data aggregation”, Computers and Geosciences, vol. 70, 2014, pp. 110-119.
[22] Mapserver 7.0.0 beta1 documentation, available at <http://mapserver.org/>, [retrieved: march, 2016].
[23] R. McHugh, Integration of the matrix structure in spatial cubes (Intégration de la structure matricielle dans les cubes spatiaux), Master thesis. Université Laval, Québec, 2008.
[24] J, Mennis, R. Viger, and C. D. Tomlin, “Cubic Map Algebra functions for spatio-temporal analysis, Cartography and Geographic Information Systems”, vol. 30, no. 1, 2005, pp. 17–30.
[25] M. Miquel, Y. Bédard, and A. Brisebois, “Conception of geospatial data warehouses from heterogeneous sources: application example in forestry” (Conception d’entrepôts de données géospatiales à partir de sources hétérogènes : Exemple d’application en foresterie), Ingénierie des Systèmes d’Information, vol. 7, no. 3, 2002, pp. 89-111.
[26] S. Openshaw, The modifiable areal unit problem. Norwick (Norfolk), Geo Books, 1983.
[27] Open Street Map, Open Street Map, Available at <https://www.openstreetmap.org/>, [retrieved: January, 2017].
[28] M. Plante, Towards matrix cubes supporting on the fly spatial analysis in decision support (Vers des cubes matriciels supportant l’analyse spatiale à la volée dans un contexte décisionnel), Master thesis, Université Laval, Québec, 2014.
[29] P. Racine and S. Cumming, Store, manipulate and analyze raster data within the PostgreSQL/PostGIS spatial database. FOSS4G, Denver, September 2011.
[30] Spatialytics, Open Source GeoBI, available at <http://www.spatialytics.org/>, [retrieved: January, 2017].
![Figure 1. Examples of map algebra operators, adapted from [23]](https://thumb-eu.123doks.com/thumbv2/123doknet/6554709.176871/2.892.474.803.162.378/figure-examples-map-algebra-operators-adapted.webp)