__________________________________________
(1) Rochus Pierre, University of Liège, Belgium, [email protected]
(2) Peyrou-Lauga Romain, ESA-ESTEC, The Netherlands, [email protected] (3) Pin Olivier, ESA-ESTEC, The Netherlands, [email protected]
(4) Nutal Nicolas, CRM, Belgium, [email protected] (5) Crahay Jean, CRM, Belgium, [email protected]
IAC-12,C2,8,5,x14815 Page 1 of 11 IAC-12,C2,8,5,x14815
Prototyping of a Phase Change Material Heat Storage Device
Collette J.P.
Walopt, Belgium, [email protected]
Rochus P.1, Peyrou-Lauga R.2, Pin O.3, Nutal N.4, Crahay J.5
A new concept of Phase Change Materials (PCM) device has recently been developed to improve the thermal control of spacecraft. Two Phase Change Material candidates have been selected after extensive testing of a set of available materials. Special attention has been paid to the hysteresis and ageing. In the design of the container, the thermal expansion of the PCM is a critical parameter that has been taken into consideration by two competing technologies. These designs have been tested: a prototype of PCM heat storage device has been effectively manufactured and tested under vacuum environment. 1D and 2D mathematical models have been developed. Conclusions are drawn to promote the use of PCM Heat Storage device in various space missions.
1. INTRODUCTION
The renewed interest in Phase Change Material (PCM) for Space applications has been shown previously (Collette & al, 2011)[21]. A PCM is a material having a high heat of fusion, whose state change at the relevant temperature is able to store and release a large amount of energy. During this change of state, the temperature remains almost constant.
When analyzing the constraints of space missions, it has been demonstrated that a net mass gain of the spacecraft could be reached by carefully selecting latent heat storage. Critical elements such as electronic boxes see their extreme temperatures damped and housekeeping power can also be saved. This paper will first review the main design features of a new Phase Change Material Heat Storage Device (PCM-HSD) developed for the European Space Agency (ESA). The choice of an adequate PCM is a challenge and the testing of pre-selected materials has been useful to determine their real characteristics. Some interesting facts from PCM characterization tests will be put forward in the paper. The choice has finally been made to use n-octadecane.
The design of the container is another challenge and it has been supported by intensive computation, both for thermal and mechanical aspects. Optimization of the internal fins is a particular point. It has led to a breadboard design which is a bit different from a flight model to allow better measurement of its characteristics.
The test plan of the breadboard PCM-HSD will then be presented.
2. CHOICE OF PCM MATERIALS
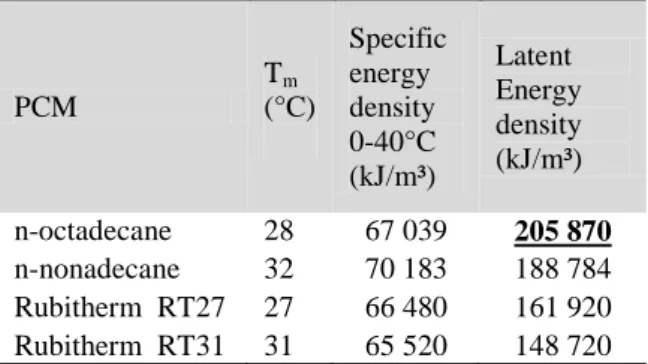
Among the possible PCM materials that can best fit the requirements of a space mission, organic PCMs have been viewed as the most promising [21]. Their transition temperature corresponds to the operating temperature of most electronic boxes (0 – 40 °C). Among them, n-octadecane and Rubitherm RT27 have been identified as the best ones, not to mention water. Due to its large volume increase during solidification and subsequent engineering difficulties[19], water has been considered as a particular case, worth of future investigations. The Table 1 shows the energy that can be stored in the pre-selected PCM’s, according to the available literature [1,2,4,5,6,7,8,9,10].
IAC-12,C2,8,5,x14815 Page 2 of 11 PCM Tm (°C) Specific energy density 0-40°C (kJ/m³) Latent Energy density (kJ/m³) n-octadecane 28 67 039 205 870 n-nonadecane 32 70 183 188 784 Rubitherm RT27 27 66 480 161 920 Rubitherm RT31 31 65 520 148 720 Table 1: Specific energy and latent energy stored by selected PCMs between 0 and 40°C
The volume change during the phase change is a design driver and should be well controlled (Table 2)[5,6,7]. PCM Density solid (kg/m³) Density solid (kg/m³) Volume change (%) n-octadecane 865 780 11 n-nonadecane 912 769 19 Rubitherm RT27 880 760 16 Rubitherm RT31 880 760 16
Table 2:Volume change during melting
To confirm these figures and more particularly the detailed behaviour during the phase change, it has been necessary to characterize some batches of materials bought from manufacturers
3. CHARACTERIZATION OF PCM MATERIALS
DSC diagrams
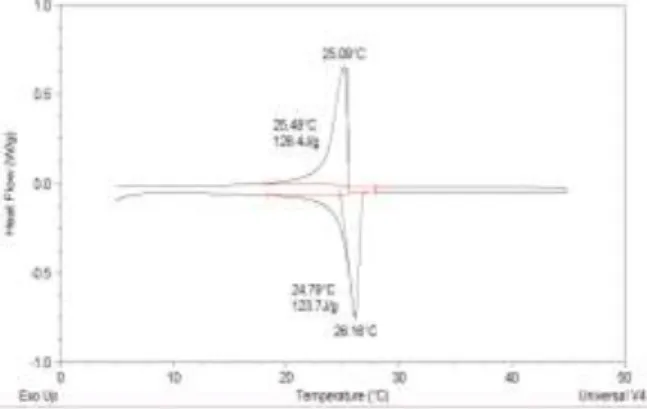
The DSC diagrams of the selected PCMs, measured with a heating rate of 0.5°C/min on a DSC Q20 (TA Instruments), are shown below on Figure 1 to Figure 4.
Figure 1: DSC diagram of RT27.
Figure 2: DSC diagram of RT31
Figure 3: DSC diagram of n-octadecane
IAC-12,C2,8,5,x14815 Page 3 of 11 Transformation temperature
From these diagrams, the melting and solidifying temperatures of the PCMs can be listed. The Table 3 shows the results.
PCM Melting temperature (°C) Solidifying temperature (°C) n-octadecane 26.65 25.85 n-nonadecane 21.33/30.5 19.80/30.58 Rubitherm RT27 24.55 25.47 Rubitherm RT31 26.70 31.84
Table 3: PCM's transformation temperatures
Transformation behaviour
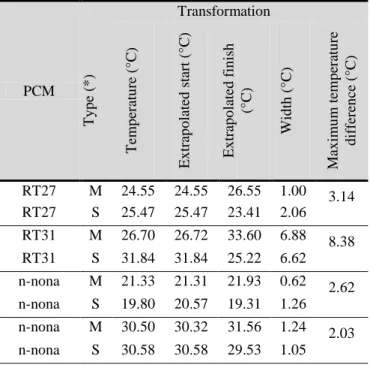
The transformation temperature only reflects a part of the qualities of the PCM. Concerning the effectiveness of a PCM for a particular space mission, another parameter has to be considered: the transformation behaviour. This parameter reflects the narrowness of the transformation peaks. Using the DSC diagrams, it is possible to see the various transformations of the PCM and the width of their transformation peaks. The Table 4 lists the main results obtained. The width of the transformation is defined as the absolute value of the difference of the extrapolated start and extrapolated finish temperatures.
PCM Transformation T y p e (* ) T em p er atu re (°C ) E x tr ap o lated s tar t ( °C ) E x tr ap o lated f in is h (°C ) W id th ( °C ) Ma x im u m tem p er atu re d if fer en ce ( °C ) RT27 M 24.55 24.55 26.55 1.00 3.14 RT27 S 25.47 25.47 23.41 2.06 RT31 M 26.70 26.72 33.60 6.88 8.38 RT31 S 31.84 31.84 25.22 6.62 n-nona M 21.33 21.31 21.93 0.62 2.62 n-nona S 19.80 20.57 19.31 1.26 n-nona M 30.50 30.32 31.56 1.24 2.03 n-nona S 30.58 30.58 29.53 1.05 n-octa M 26.65 26.48 27.94 1.46 3.33 n-octa S 25.85 25.73 24.61 1.12 Table 4: Transformation behavior of PCMs
(*) M: Melting – S: Solidification
Other results, including Micronal DS500X that has also been investigated, are combined on the Figure 5.
Figure 5: Transformation temperatures for some PCMs.
From Figure 5 and Table 4, it can be seen that: - Rubitherm RT31 has a really large
transformation temperature range (8.38°C) and a high solidification temperature start (31.84). Accordingly, the regeneration of this PCM can become quite hard if the operating temperature is not shifted sufficiently to high temperatures. - Rubitherm RT27 has a more acceptable range
of transformation temperature (3.14°C) with reasonable temperatures of transformation. - Micronal DS5001X has a quite large range of
transformation temperature (4.25°C) but with reasonable temperatures of transformation. - Both widths of transformation temperature
range for the nonadecane are excellent (2.62 and 2.03°C). However, the high temperature transformation can be quite close to the maximum operating temperature. This could be a drawback.
- n-octadecane constitutes a good compromise between width of transformation temperature and transformation temperatures. It has to be pointed out that this PCM shows an over
IAC-12,C2,8,5,x14815 Page 4 of 11 melting behaviour. Indeed, the temperature
drops a few tenth of °C before the transformation starts.
Transformation enthalpy
The transformation enthalpy is another important parameter regarding PCM qualities. This parameter reflects the energy storage capacity of the PCM and has been measured using DSC QA20. The results of the measurements are listed on Table 5.
PCM Melting enthalpy (J/g) Solidifying enthalpy (J/g) n-octadecane 208.1 212.8 n-nonadecane 43.41/147.1 151.1/41.51 Rubitherm RT27 119.3 123.3 Rubitherm RT31 115.3 116.9
Table 5: PCM transformation enthalpies
Small discrepancies are observed on Table 5 concerning the energy stored or released during melting and solidifying. These discrepancies result of the range used to measure these values.
This table allows us to rank the PCMs according to the energy stored during phase change:
1) n-octadecane 2) Rubitherm RT27 3) Rubitherm RT31
Of course, these values do not take into account the specific heat of the PCM in solid and liquid state.
Resistance of the PCM vs ageing effect Due to the long duration of a space mission, it is important to evaluate the resistance of the PCM regarding the ageing effect. The Figure 6 shows the superposition of the DSC diagrams of n-octadecane after 1 cycle (in blue) and 450 cycles (in red), both measured with a heating rate of 0.5°C/min.
Figure 6: superposition of the 1st and 450th DSC diagrams of n-octadecane
It can be seen that some ageing effect appears [12]. The melting peak does not move but the solidifying peak is shifted toward higher temperatures. This shift is not detrimental as it shortens the width of transformation range.
It can be seen from the Figure 7 that the energy stored during transformation (210 J/g) is the same as for the 1st DSC diagram (212.8J/g), see Figure 3.
Figure 7: 450th DSC diagram of n-octadecane. The Rubitherm RT27 seems to be stable regarding the ageing effect. Indeed, except a little shift (0.3°C) towards higher temperatures for the melting, no modification of the solidifying temperature is observed (Figure 8).
IAC-12,C2,8,5,x14815 Page 5 of 11 Figure 8: superposition of the 1st and 450th DSC
diagrams of Rubitherm RT27.
As can be seen on the Figure 1 and Figure 9, the latent heat of transformation remains stable after 450 cycles.
Figure 9: 450th DSC diagram of Rubitherm RT27.
No major evolution is observed regarding the DSC diagram of the Rubitherm RT31 after 450 cycles (Figure 10).
Figure 10: superposition of the 1st and 450th DSC diagrams of Rubitherm RT31.
Moreover, the total energy stored remains constant after 450 cycles (Figure 2 and Figure 11).
Figure 11: 450th DSC diagram of Rubitherm RT31
Densities
The volume change during phase change is an important parameter concerning the practical use of PCM. These values have been measured using pycnometry.
The Table 6 lists the measured densities in solid state for the selected PCM. The volumes occupied by 1kg of PCM are indicated too in this table.
PCM Density (g/cm³) Volume per kg (L) n-octadecane 0.850 1.176 n-nonadecane 0.865 1.156 Rubitherm RT27 0.782 1.278 Rubitherm RT31 0.823 1.215
Table 6: Densities in solid state and volume per kg of the selected PCMs (10°C).
The Table 7: lists the same parameters in liquid state. PCM Density (g/cm³) Volume per kg (L) n-octadecane 0.774 1.291 n-nonadecane 0.782 1.278 Rubitherm RT27 0.766 1.278 Rubitherm RT31 0.777 1.287
Table 7: Densities in liquid state and volume per kg of the selected PCMs (35°C)
IAC-12,C2,8,5,x14815 Page 6 of 11 Volume change during phase change
From the values listed on the preceding tables it is possible to determine the variation of density and volume during solidification. The values obtained are listed in the Table 8.
PCM Density (%) Volume (%) n-octadecane 9.8 -8.9 n-nonadecane 10.6 -9.6 Rubitherm RT27 2.1 -2.0 Rubitherm RT31 5.9 -5.6
Table 8: Density and volume variation during phase change of the selected PCMs (the values indicate the variation from the liquid phase to the solid phase).
Rubitherm RT27 has the lowest density change during phase change. Rubitherm RT31 has an intermediate value, while n-octadecane has the highest value.
In all the cases, the melting leads to an increase of volume.
Energy density stored during phase change
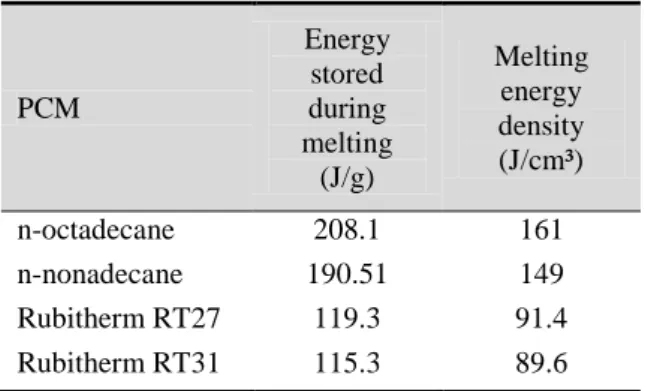
The melting energy density is the last critical parameter analysed in this paper. The values measured using DSC and pycnometry have allowed to determine the amount of heat that is stored as latent heat during melting. The Table 9 lists the results. PCM Energy stored during melting (J/g) Melting energy density (J/cm³) n-octadecane 208.1 161 n-nonadecane 190.51 149 Rubitherm RT27 119.3 91.4 Rubitherm RT31 115.3 89.6
Table 9: Melting energy density of the selected PCMs.
This table indicates that Rubitherm products have low values while n-octadecane has the highest value.
In conclusion of the PCM’s characterization tests, n-nonadecane has been discarded for its double transition peak. Rubitherm RT 31 has a too large transformation range. Finally, n-octadecane has been selected thanks to its generally good behaviour and its high melting energy density.
4. PROTOTYPE DESIGN
A breadboard of a PCM-HSD has been designed to be representative of a Flight Model, but with specific modifications enabling accurate measurements and mathematical model reconciliation. The PCM-HSD lower and upper faces have an area of 200*100mm² in order to best represent flight hardware and supply testing ease. This I/F will be able to easily accommodate the mechanical interface of an electronic box.
The characterisation tests have shown that the main problem of the PCM usage is the large volume change during phase transition. In particular, n-octadecane undergoes a melting with 9% volume increase. This can induce critical problems of mechanical stability to the PCM-HSD. So, two solutions have been considered: flexible internal medium and working under vacuum.
Fins
Care should also be taken concerning thermal conductivity. Indeed, organic PCMs show, in a general way, low thermal conductivity. As a consequence, fins have to be added to the PCM-HSD in order to improve heat transfer through the PCM and allow a good phase change without a high overheating. As already shown[14,21], these fins should have a cross section between 5 and 10 % of the total cross section of the PCM-HSD.
The change of phase can be not homogeneous inside the PCM volume. In order to sustain internal forces arising from volumes of PCM realising a phase transformation at different times, these fins need to have a sufficient thickness. And finally, these fins have to be regularly spaced in order to reach a homogeneous heat transfer into the PCM. The design of the fins has thus been particularly studied to find an optimisation between heat transfer efficiency and weight.
Assembly method
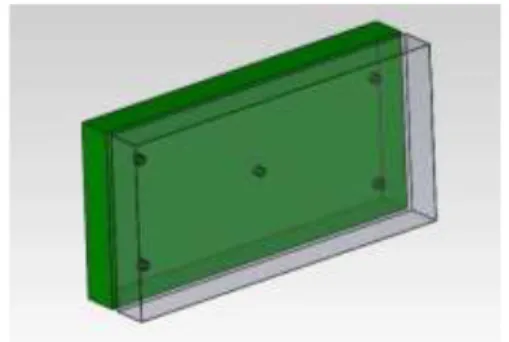
The opening of the breadboard is mandatory to make inspections or change some items inside the PCM-HSD. An assembly by bolted flanges is therefore better. The Figure 12 shows the initial
IAC-12,C2,8,5,x14815 Page 7 of 11 design that has been proposed for the breadboard,
with Aluminum flanges.
Figure 12: Breadboard PCM-HSD
Finally, a breadboard has been built with insulating spacer to get rid of the side effects: this spacer, made of polycarbonate, has in fact a thermal conductivity near the one of the PCM. The polycarbonate spacer has been made thick to allow screwing of instrumentation (Figure 13).
Figure 13: Breadboard with spacer
FEM mechanical analysis
A mechanical study of the breadboard has been performed. The thermo-mechanical analysis has shown that stresses are generated in the PCM-HSD due to the volume change; it works under internal pressure when it expands. This pressure is indeed reduced by using internal flexible media. The box should anyway be highly resistant. On the other side, the thickness of the PCM storage box should be limited to achieve a lightweight structure. Reinforcements are thus foreseen in this thin structure, as traditionally made in aerospace structures.
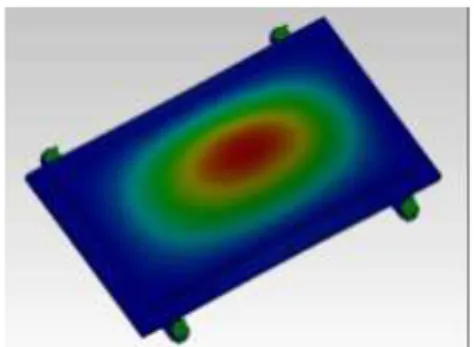
The vibration behaviour has also been addressed by analysis and the first eigen mode is shown in Figure 14.
Figure 14: First eigen mode (808 Hz)
The thermal cycling can be very demanding for long mission (about 15 000 cycles). A fatigue assessment has thus also been performed with the following results (Figure 15).
Figure 15: Fatigue assessment of the PCM-HSD As can be seen, no particular problem arises for fatigue, with a maximum life of about 15 000 cycles.
5. PROTOTYPE TESTING
To best control the thermal environment and be representative of a space environment, the thermal tests have been performed under vacuum. The testing facility consists of a vacuum rectangular chamber 1530*660*800 mm, as illustrated in Figure 16 .
IAC-12,C2,8,5,x14815 Page 8 of 11 The PCM-HSD is located between a cold source
and a hot source in order to simulate the thermal exchanges during a space mission. The side of the PCM-HSD facing the cold source is covered with chemglaze paint to offer a well-known emissivity. The test configuration also allows PCM-HSD testing upside down to check the effect of Earth gravity.
Hot source
The hot source is a resistance powered by DC voltage. This resistive system fits closely to the aluminium side of the PCM-HSD in order to spread heat homogeneously to the PCM-HSD. The measurement of the injected current allows knowing the amount of heat dissipated into the PCM-HSD. In order to provide a good insulation between the test specimen and the vacuum chamber, a support has been realized in Delrin. Multi Layer Insulation (MLI) is used to wrap all the surfaces of the PCM-HSD, but the face radiating to the cold source.
Cold source
The cold source is a reservoir filled with LN2. The bottom/upper face of this reservoir is respectively in front of the upper/down cold face of the PCM-HSD and painted with chemglaze. In order to have a homogeneous cold source temperature, the reservoir always contains LN2 and a PT100 controls the LN2 level in the reservoir. By this way, the external temperature seen by the PCM-HSD is perfectly homogeneous and constant to 77 K.
Figure 17: Filling of the LN2 reservoir
The LN2 reservoir is supported from above and properly insulated. The GN2 exhaust and LN2 inlet are directly welded on the reservoir. The whole system is wrapped with MLI to minimize heat leaks.
Knowing the temperature of the PCM-HSD face (measurement) and the emissivity of the black coating (Chemglaze) applied on both surfaces, the heat transfer to the cold source is calculated. Instrumentation
PT100 – 3 wires thermal sensors have been chosen and implemented at various locations. To make the most accurate measurements and taking into account the small size of the breadboard, miniature sensors have been selected. They are carefully glued to maintain their position during the phase changes and subsequent flows of the surrounding PCM. The wiring has been placed parallel to the quasi-isothermal plane.
A measurement of the pressure inside the breadboard has also been foreseen.
Figure 18: temperature sensors inside the PCM-HSD
Mechanical tests
To check the tightness of the PCM-HSD, the box has been pressurized to 1 bar. When under pressure, the deflections of the box plates have been measured to check the mechanical calculations. The results show that the flatness of the box is still good enough to maintain a good thermal contact, if interfaced with an electronic box.
Figure 19: Deformation (mm) under 1 bar internal pressure
IAC-12,C2,8,5,x14815 Page 9 of 11 Thermal characteristics of the PCM-HSD
The first thermal test has been dedicated to the determination of the quality of the insulation package. In order to determine this value, the PCM-HSD has been configured in a steady state, by injecting a known amount of heat during a long period. Then, as it is shown by Cognata et al.12, the heat leakage has been determined. The thermal conductivity of the whole system has also been measured.
Knowing the amount of heat lost during the measurements and the conductivity of the whole system, a series of tests have been realized to characterise the behaviour of the PCM-HSD with various amounts of heat injected by the hot source and extracted by the cold source. The data collected during the tests will be used to check the modelling in the coming weeks.
Static thermal gradient
Figure 20: Finite Difference 2D thermal model: node numbering (fins are in grey, PCM is in yellow)
First, a thermal static gradient through the PCM-HSD has been realized with 5W power heating and a cooling with the LN2 radiator. The results of the computation are shown in the following figure and allow defining an equivalent thermal conductivity.
Figure 21: Thermal static gradient
Tmin (K) Tmax (K) Equiv. thermal conductivity (W/m.K) 287.3 291.5 1.04
Table 10: Thermal static gradient
Transient behaviour
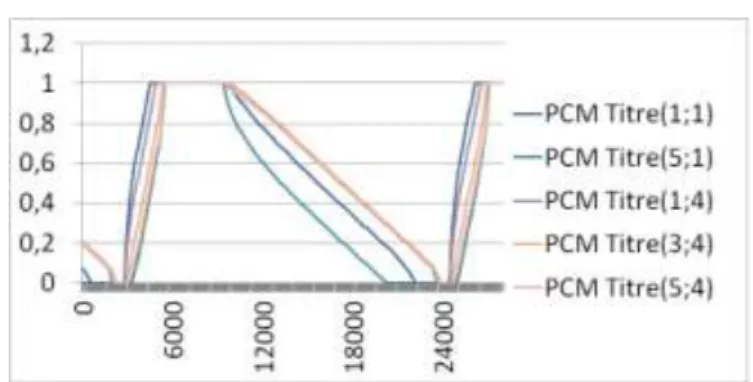
The input power is fixed at 33.40 W during one hour, followed by a cooling phase of 5 hours. This comes from the equilibrium power of the PCM-HSD with a cold plate at 77 K and a reciprocal emissivity of 0.63. The calculation gives an average power of 5.8 W to maintain a stabilized temperature of 300 K, near the melting temperature of the n-octadecane.
After some cycles of stabilization, the temperature of the hot side cycles regularly between 293.5 and 324.5 K. Only the last stabilized cycles are shown here. The melting/solidification process appears to be fully completed, without thermal ratcheting.
Figure 22: Temperatures inside the PCM: nodes 1,4 - 5,4 - 3,4
Figure 23: Liquid fraction inside the PCM
The first testing results reached up to now show a good fit with the numerical predictions, but a pretty much better conductivity through the PCM-HSD, which is favourable.
IAC-12,C2,8,5,x14815 Page 10 of 11
6. NUMERICAL MODELS
Various numerical models have been built using off-the-shelf software or specific algorithm. The purpose has been to compare their performance and to select the best codes.
All models are based on the enthalpy method. One should in particular address attention to the results reached with a FEM code. The easiness of use of such code, especially for developing the geometrical model, has been appreciated. On the other side, the lumped nodal method is certainly of general use and gives good results, but this method is not so user-friendly and is time consuming. We have also seen that the 3D effect of the fins can be very high and that a global model, oversimplified, can lead to results that are not realistic.
Further work has to be conducted to better understand and model what exactly happens during a phase change. The following aspects will be studied in a PhD thesis:
- Segregation under micro-gravity environment, especially for salt hydrates - Long term behavior (ageing) under
combined radiation and thermal environment
- Marangoni effect which can become significant in the absence of convection forces
- Stability of transition temperature under micro-gravity (influence on dendrite growth etc …)
7. CONCLUSION
PCM are worth being used for future space missions, particularly with regard to micro/nano-satellites, which are particularly demanding in power saving.
Various PCM’s have been characterized and have shown properties differing from the published ones. After detailed analyses and optimization, a breadboard has been built and tested with n-octadecane. The results show the definitive advantages of this thermal damper. Other applications than for spacecrafts are also under investigation such as the improvement of the equipement bay electronics for Ariane launchers.
8. ACKNOWLEDGMENT
This work has been founded by the European Space Agency ESA-ESTEC under contract number 4000102554/10/NL/NA. The authors wish to thank their colleagues who have made this work possible.
9. LIST OF ABBREVIATIONS DSC ESA ESTEC FEM HSD PCM
Differential Scanning Calorimetry European Space Agency
European Space Research and Technology Centre
Finite Element Method Heat Storage Device Phase Change Material
10. REFERENCES
[1] Huang, D., Simon, S.L. & McKenna, G.B. Chain length dependence of the thermodynamic properties of linear and cyclic alkanes and polymers. J. Chem. Phys. 122, 084907 (2005). [2] Salaün, F., Devaux, E., Bourbigot, S. & Rumeau, P. Development of Phase Change Materials in Clothing Part I: Formulation of Microencapsulated Phase Change. Textile Research Journal 80, 195 -205 (2010).
[3] Sharma, S.D. & Sagara, K. Latent Heat Storage Materials and Systems: A Review. International Journal of Green Energy 2, 1 (2005).
[4] Cabeza, L., Castell, A., Barreneche, C., de Gracia, A. & Fernández, A. Materials used as PCM in thermal energy storage in buildings: A review. Renewable and Sustainable Energy Reviews 15, 1675-1695 (2011). [5] RUBITHERM® RT 27 datasheet. at <http://www.rubitherm.com/english/download/te chdata_RT27_en.pdf> [6] RUBITHERM® RT 31 datasheet. at <http://www.rubitherm.com/english/download/te chdata_RT31_en.pdf>
[7] Haghshenaskashani, S. & Pasdarshahri, H. Simulation of Thermal Storage Phase Change Material in Buildings. WASET 58, 111-115 (2009).
[8] Castell, A., Medrano, M., Roca, J., Vila, A. & Cabeza, L. Experimental study of PCM in Mediterranean buildings. (Spanish government:).
[9] Holmen R, Lamvik M & Melhus O., Measurements of the Thermal Conductivities of Solid and Liquid Unbranched Alkanes in the
IAC-12,C2,8,5,x14815 Page 11 of 11
C16-to-C19 Range During Phase Transition. at <http://www.ingentaconnect.com/content/klu/ijot /2002/00000023/00000001/00364801>
[10] Sasol germany GMBH, Ziehe, H., Weitzi, A. & Gross, T. Method for producing a latent heat storage materail and dialkyl ether as a latent heat storage material.
[11] Li, H., Liu, X. & Fang, G. Preparation and characteristics of n-nonadecane/cement composites as thermal energy storage materials in buildings. Energy and Buildings 42, 1661-1665 (2010).
[12] Zhang, H. & Wang, X. Synthesis and properties of microencapsulated n-octadecane with polyurea shells containing different soft segments for heat energy storage and thermal regulation. Solar Energy Materials and Solar Cells 93, 1366-1376 (2009).
[13] Micronal PCMProduct A25 datasheet. at <http://www.pcmproducts.net/files/a_range.pdf> [14] Spacecraft Thermal Control Handbook. Fundamental Technologies, Vol. 1, 2nd edition, David G. Gilmore
[15] Latent Heat Storage using a PCM-graphite composite material, H. Mehling, S. Hiebler, F. Ziegler, ZAE Bayern.
[16] Review on thermal energy storage with phase change: materials, heat transfer analysis and applications, B. Zalba, J.M. Marin, L.F. Cabeza, H. Mehling, Applied thermal Engineering 23 (2003) 251-283.
[17] New method to evaluate the heat storage density in latent heat storage for arbitrary temperature ranges, H. Mehling, S. Hiebler, E. Günther, Applied Thermal Engineering, 30 (2010), 2652-2657.
[18] NASA Technical Paper 1074, A Design Handbook for Phase Change Thermal Control and Energy Storage Devices, 1977.
[19] Developing and Testing a Spacecraft Phase Change Material Container for Water Ice Using Resilient Compressible Foam, Jared Leidich, Thomas O. Leimkuehler, Stephanie S. Chiesi, AIAA 2011-5210.
[20] Nanoparticle-enhanced phase change materials (Nepcm) with great potential for improved thermal energy storage (24-Sep-2009) Inventors/Applicants: Khodadadi, Jeyhoon M. Auburn, AL, US. US Application Publication (Source: USPTO) Publication No. US 2009/0236079 A1 published on 24-Sep-2009 Application No. US 12/410061 filed on 24-Mar-2009.
[21] Collette J.P., Rochus P., Peyrou-Lauga R., Pin O., Nutal N., Larnicol M., Crahay J., Phase Change Material Device for Spacecraft Thermal Control, IAC-11.C2.8.1, Cape Town, 2011. [22] Cognata, T.J. et al. A review of the experimental and modeling development of a
water phase change heat exchanger for future exploration support vehicle, 2011.