R
esear
ch Ar
ticle
Build
ing Systems and
Co m p o n e n ts E-mail:sgendebien@ulg.ac.be
Designing an air-to-air heat exchanger dedicated to single room
ventilation with heat recovery
Samuel Gendebien1 (), Jonathan Martens2, Luc Prieels2, Vincent Lemort1
1. University of Liège, Energy Systems Research Unit, Allée de la Découverte, 17, Quartier Polytech, 4000 Liège, Belgium 2. Greencom Development SCRL, Rue Gilles Magnée, 92/3, 4430 Ans, Belgium
Abstract
The present paper focuses on the development steps of heat exchangers dedicated to single room ventilation unit with heat recovery (SRVHR) by proposing a numerical approach. A methodology is suggested in order to determine the best trade-off between hydraulic and thermal performance given a specific geometry. The methodology consists in a mapping of the coefficient of performance (COP) of the unit. The latter is defined as the ratio between recovered heat and the fan energy use, given a specific indoor/outdoor temperature difference. However, the energy performance should not be the only criterion to be taken into account in the frame of the design steps of a heat recovery exchanger: technical, economic and acoustic aspects should also be considered. This numerical methodology is illustrated by means of a real example of a newly developed heat exchanger dedicated to a SRVHR. The optimization is first performed while using a semi-empirical model (based on the use of correlations and on a spatial division of the studied heat exchanger). The semi-empirical model allows for the creation of a COP map in order to identify the most effective geometry parameters for the heat exchanger. The decision concerning the final geometry is made accounting for the so-called technical, economic and acoustic considerations. A discussion on some parameters needed for the COP establishment is also proposed.
Keywords
ventilation, heat recovery,
air-to-air heat exchanger, fan energy use
Article History
Received: 3 February 2017 Revised: 24 April 2017 Accepted: 29 May 2017
© Tsinghua University Press and Springer-Verlag Berlin Heidelberg 2017
1 Introduction
In Europe, the residential sector accounts for around 25% of the final energy consumption according to the Eurostat (2016), and therefore contributes significantly to CO2 emissions. In the context of mitigation of climate change, roadmaps towards energy-efficient buildings have been proposed by the International Energy Agency (IEA 2011). As referred in the Trias Energetica concept (Trias Energetica 2016), the first step to make a building climate friendly is to reduce the energy demand by implementing energy-saving measures. To this end, the first retrofit options to be considered for existing residential buildings are the improvement of the thermal insulation and the air tightness. Improving the building envelope tends to increase the relative part of the energy consumption due to ventilation. According to Roulet et al. (2001), more than 50% of the total energy losses can be due to ventilation losses in building with a high thermal
insulation. In this context, a large amount of heat recovery technologies have been developed in the last decades, as reported by Mardiana-Idayu and Riffat (2012) and by O’Connor et al. (2016).
As referred by Fehrm et al. (2002), first heat recovery ventilation systems dedicated to residential building were installed in the late seventies in Sweden. According to Händel (2011), heat recovery ventilation has now acquired a status of efficient ventilation strategy, especially for buildings with low or zero energy consumption. The supplementary study on Ecodesign Lot 10 (FGK 2012) forecasts a drastic increase of sales in the medium climate market. As reported by Wouters et al. (2008), this trend was already observed in Belgium with an increasing of the share of the balanced mechanical ventilation systems.
In the two last decades, a large amount of papers about “centralized” heat recovery ventilation systems has been published in the scientific literature. These papers focus
List of symbols
a semi-period of the heat exchanger waves (geometric parameter)
A heat transfer area [m2]
b height of the heat exchanger waves (geometric
parameter)
cp air specific heat at constant pressure [J/(kg·K)] C capacitance rate of a flow [W/K]
Cr capacity ratio [–]
e plate thickness [m]
k conductivity of the material [W/(m·K)]
L length of the heat exchanger [m]
Lsin length of the sinus semi wavelength [m]
H height of the heat exchanger [m]
h convective heat transfer coefficient [W/(m2·K)]
HX heat exchanger
M mass flow rate [kg/s]
Q Heat transfer rate [W]
R heat transfer resistance [K/W]
ROI Rest Of Installation
SRVHR single room ventilation with heat recovery
T temperature [°C]
W wide of the heat exchanger [m] W electrical supplied power [W] Zone zone of the heat exchanger
ε heat exchanger effectiveness [–]
Φ enlargement factor [%]
Subscripts
A corresponding to the supply part A of the HX B corresponding to the central part B of the HX C corresponding to the exhaust part C of the HX design design set point
fans related to fans
ind related to the indoor air side max maximal value
min minimal value
out related to the outdoor air side recovered recovered heat
ROI Rest Of Installation
su supply of the heat exchanger w wall of the HX
zone zone of the heat exchanger (A, B or C)
more precisely on the heat recovery exchanger. Adamski (2008a) carried out experimental studies and developed correlations on a longitudinal flow spiral recuperator. Fernández-Seara et al. (2011) experimentally studied an off-the-shelf air-to-air heat recovery device for balanced ventilation. A set of tests was conducted under reference operating conditions in order to evaluate the heat exchanger performance. Afterwards, an experimental parametric analysis was conducted to investigate the influence of the operating conditions on the heat exchanger performance. Kragh et al. (2008) also experimentally investigated a new counter-flow heat exchanger but focused more precisely on the frosting issue. Adamski (2008b, 2010) also estimated the economical effect due to the use of heat recovery ventilation instead of a simple exhaust ventilation system. More recently, Asdrubali et al. (2015) conducted experimental investigations on a heat recovery system for mechanical ventilation and Nam et al. (2016) focused their work on the behaviour of heat recovery ventilator under partially wet conditions. Concerning design optimization of heat recovery exchanger, a thermo-economic investigation was carried out by Söylemez (2000) in order to find the optimum heat exchange area of recovery heat exchanger by determining an optimum net savings and payback period. Teke et al. (2010) also proposed a method to find out the type, area and net gain of the most appropriate
heat exchanger to be used in waste recovery systems by determining a non-dimensional number based on technical and economical parameters. However, pressure drop determination and electrical consumption related to the passage of flows in the heat exchanger channels have not been considered in those studies. On the contrary, Adamski (2004) presented a methodology to optimize the overall geometric form of the plates of counterflow ventilation heat exchangers by taking into account the energy losses induced by frictional pressure drops in channels.
The present paper focuses on heat exchangers dedicated to balanced single room ventilation with heat recovery (SRVHR). Such units consist of a box containing two fans (one dedicated to the extraction of indoor air and one dedicated to the introduction of outdoor air), two filters (for both flow rates), an electronic fan control (for manual or automatic regulation of flow rates), a set of sensors (CO2, humidity or presence) and a heat recovery exchanger, often considered as the key component of the unit. Regarding the SRVHR technology, Manz et al. (2000) and Schwenzfeier et al. (2009) presented experimental investigation in order to determine the overall performance of such SRVHR units. Advantages, drawbacks and challenges related to the development of such units are summarized by Gendebien et al. (2013a). To the author’s knowledge, no paper specifically
related to the design optimisation of heat exchangers for single room ventilation (and the related constraints) has been published in the scientific literature. In this context, the present paper aims at presenting a numerical method in order to determine the best trade-off between hydraulic and thermal performance given a specific defined geometry of corrugated plates through the optimization of the coefficient of performance (COP) of the unit.
2 Overall performance of single room ventilation with heat recovery unit
The overall performance of centralized heat recovery ventilation is highly dependent on the hydraulic circuit (i.e. singularities, bending of the air pulsing and air extracting ducting) and therefore on the building and ducting configuration. On the other hand, the performance of single room heat recovery ventilation system is not influenced by the rest of the installation. As a result, performance of single room ventilation with heat recovery does not depend on the building/ducting characteristics but only on the characteristics of the device itself.
The overall performance of each unit can be defined as the ratio of the recovered heat transfer rate to the electrical power of the fans as given in Eq. (1):
recovered SRVHR
fans
Recovered heat power COP
Electrical supplied power
Q W
= = (1)
By only taking into account the sensible part of the heat transfer rate (the total amount of latent heat rate compared to sensible recovered heat can be neglected in moderate climate as Belgium, according to Gendebien et al. (2013b)), the recovered heat transfer rate is given by Eq. (2) and depends on the heat exchanger effectiveness (varying with the mass flow rate), the delivered mass flow rate and on the indoor/outdoor difference temperature, i.e.,
recovered Mout cp ε T( ind Tout)
Q = ⋅ ⋅ ⋅ - (2) where Mout is the outdoor air mass flow rate in [kg/s], cp is the air specific heat at constant pressure in [J/(kg·K)], ε is the heat exchanger effectiveness [–], Tind is the indoor temperature [K] and Tout is the outdoor temperature [K].
Exhaust and supplied flows are considered well balanced in the rest of the paper.
Some parameters influencing the seasonal COP of the SRVHR are the fans performance and the overall hydraulic performance of the unit. The latter can be divided in two major parts: one related to the passage of the airflow in the “heat exchanger itself” and another one related to the flows through the Rest Of the Installation (filter, supply and exhaust
of the unit). For centralized units, hydraulic performance of the so-called Rest Of the Installation (ROI) also includes the pressure drop related to the air passage in the air extracting and air supplying ducts. Other parameters influencing the seasonal COP are the thermal performance of the heat exchanger and the climate (indoor/outdoor temperature difference). According to El Fouih et al. (2012) and from a yearly performance point of view, the interest of use of heat recovery ventilation is highly dependent on the climate (recovered heat over one year vs electrical consumption due to fans).
3 Design steps
Here below is summarized the design steps used to determine the best geometric parameters dedicated to a given predefined heat exchanger geometry:
1) The first step is to determine the heat exchanger characteristics such as the external dimensions, the flow configuration, the manufacturing process as well as the material used for the heat exchanger. This step also includes the definition of the geometric parameters to be optimized.
2) The second step is to develop a model able to determine the thermal and hydraulic performance of the heat exchanger (efficiency and pressure drop due to airflow passage in the heat exchanger) based on its geometric characteristics.
3) By setting a design flow rate and the associated pressure drop (related to the heat exchanger and to the rest of installation), it is possible to establish the electrical con-sumption of the fans (based on manufacturer performance curves). This step is referred to “COP factors settings” in the rest of the paper.
4) Knowing the heat exchanger effectiveness and the fans power consumption, it is possible to create a COP map of the device which depends on the geometric parameters to be optimized.
5) The last step consists in taking into account the so-called technical, economic and acoustical constraints in order to reject some data combination and to identify the best values of the geometric parameters that optimize the COP.
4 Main characteristics of the newly built heat exchanger
This section is dedicated to the design of a specific heat exchanger. The following sub-sections describe the main characteristics chosen for the case study. Some of these characteristics are set at the beginning of the design procedure (e.g. flow configuration, external dimensions, materials, etc.) while others are computed by the optimisation process.
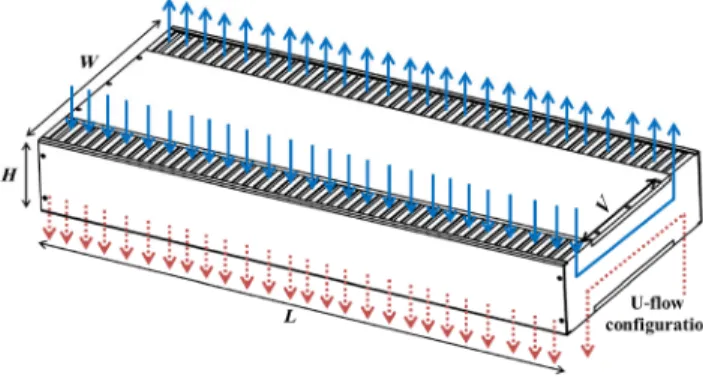
4.1 Flow configuration
In order to maximize the thermal performance, the initial idea was to develop a U-flow configuration heat exchanger, as shown in Fig. 1. Nasif et al. (2005) have already investigated an enthalpy heat exchanger that presents a quite similar flow configuration (Z-flow configuration).
Such heat exchangers present a counter flow configuration over the major part of their heat transfer surface area (this is the reason why they are also called “quasi” counter-flow heat exchanger). The latter is often called the central part of the heat exchanger. A schematic representation of such a heat exchanger is given in Fig. 1.
For the rest of the optimization procedure, the external dimensions of the heat exchanger are given in the Table 1.
Those external dimensions correspond to those of a heat exchanger supposed to be installed in a standard single room ventilation unit.
4.2 Materials
It has been decided to develop a recovery heat exchanger made in polystyrene. The main drawback of polystyrene heat exchangers concerns their low thermal conductivity. However, this drawback can be counter-balanced by the higher enlargement factor (up to 400%) in comparison with traditional plate heat exchangers made of metal (rarely superior to 150%). According to the definition proposed by Ayub (2003), the enlargement factor Φ is the ratio of the developed length to the protracted length. As already shown by Gendebien (2013b), due to its small thickness, the wall
Fig. 1 U-flow configuration heat exchanger
Table 1 External dimensions of the heat exchanger External dimensions Values Unit
V 0.137 [m]
W 0.22 [m]
H 0.06 [m]
L 0.45 [m]
resistance can generally be neglected, even for low thermal conductivity material. Economic criteria have also to be considered in the material choice. Other benefits include their lightness and their low cost. Additional information is given by T’Joen et al. (2009) in its review on polymer heat exchangers dedicated to HVAC systems.
4.3 Manufacturing process
The first step of the manufacturing process is to thermoform plates coming from a plastic roll. Once the thermoforming process is finished, the next step is to fold up the several corrugated plates similarly to an accordion, as shown in Fig. 2.
This manufacturing process was presented by Kleeman (1978). A schematic representation of the several steps is given in Fig. 3.
The main advantages about this manufacturing process are the easiness for assembling the heat exchanger after the thermoforming process, the easiness for ensuring air tightness between plates and the possibility of adjustment of the heat exchanger length.
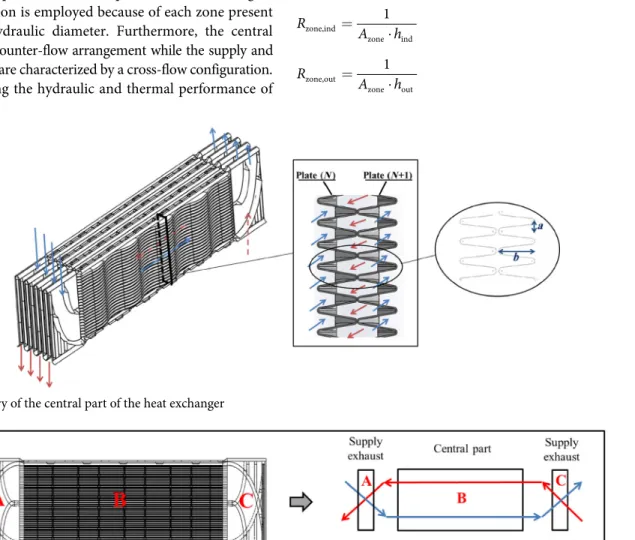
4.4 Geometry of the central part of the heat exchanger For manufacturing reasons, it has been decided to corrugate the central part of the heat exchanger in a sinus wave pattern.
Fig. 2 Assembling in accordion style
The latter can be characterized by two geometric parameters: the semi-period a and the peak-to-peak amplitude b. The nomenclature used for the geometry definition is indicated in Fig. 4. As all the features of the heat exchanger have already been defined in the previous sections, the crucial question remaining for rest of the procedure is: “What are the best
values for a and b in order to optimize the COP of the unit?” 5 Geometric parameters determination
5.1 Heat exchanger model
In order to carry out the optimization procedure, a semi-empirical model (SEM) was built in the EES (2016) environment. The aim of this section is to give features of the developed model (assumptions used, heat transfer area determination, and pressure drop correlation). The model is based on a spatial division of the heat exchanger in three zones (two supply/exhaust zones: A and C; and one central part: B), as represented in Fig. 5. The main part of the heat transfer rate appears in the central part of the heat exchanger.
This division is employed because of each zone present a different hydraulic diameter. Furthermore, the central part shows a counter-flow arrangement while the supply and exhaust zones are characterized by a cross-flow configuration.
Concerning the hydraulic and thermal performance of
the heat exchanger, the same method exposed by Gendebien et al. (2013b) is applied. It consists in the identification of the friction factor and the convective heat transfer coefficient for each zone. The heat transfer rate is modeled for each zone (QA, QB and QC) using the ε-NTU method. The minimal
and maximal capacitance rates are given by Eqs. (3) and (4), where Cind and Cout are the indoor and outdoor air
capacitance flow rates in [W/K] respectively:
min min( ind; out)
C = C C (3)
max max( ind; out)
C = C C (4)
Cr [–] is the heat capacity ratio and is defined by Eq. (5):
min r max C C C = (5) The heat transfer resistances for each zone, related to the indoor and outdoor side Rind and Rout in [K/W] are expressed as functions of the convective heat transfer coefficients hind and hout in [W/(m2·K)]: zone,ind zone ind 1 R A ⋅h = (6) zone,out o t e u zon 1 R A ⋅h = (7)
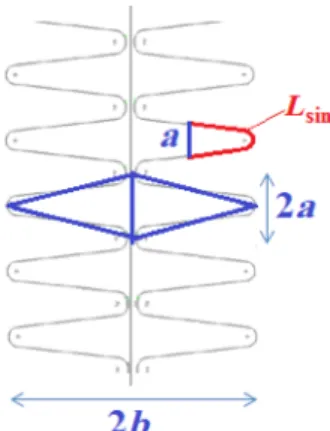
Fig. 4 Geometry of the central part of the heat exchanger
Heat transfer resistance Rw in [K/W] is related to the conductivity plates kw in [W/(m·K)] : zone,w zone w e R A ⋅k = (8) Correlations for the convective heat transfer coefficient and the friction factor dedicated to sinus wave form are proposed in literature by Hesselgraves (2001). However, these correlations are only valid for ratio between a and b lower than two. For this reason, as schematically represented in Fig. 6, the sinusoidal channels have been approximated by triangular channels.
Fig. 6 Central part of the matrix, used nomenclature and geometric assumptions
Investigations carried out by Gendebien et al. (2013b) provided calibrated correlations for friction factor, as well as for convective heat transfer coefficients, for such triangular channels. Concerning the zones A and C, correlations dedicated to rectangular cross section area have been used (Nellis and Klein 2011).
The overall heat transfer conductance for each zone
AUzone in [W/K] is given by:
zone
zone,ind zone,out zone,w
1 AU R R R = + + (9) The number of transfer unit for each zone, NTU [–] can be obtained by: zone zone min AU N C TU = (10)
For parts A and C of the heat exchanger with a crossflow configuration, its effectiveness is given by the commonly-used Eq. (11), given in Incropera and DeWitt (2002):
0.22
A,B 0.78
A,C r A,B
r
1 exp NTU (exp( 1))
ε C NTU
C
é ù
= - ê ⋅ -
-êë ⋅ úúû (11)
For the part B of the heat exchanger, the effectiveness is given by Eq. (12), also proposed by Incropera and DeWitt (2002): [ ] [ ] r r 1 exp (1 ) 1 exp (1 ) B r NTU C ε C NTU C - ⋅ -= - ⋅ ⋅ - (12) Once the heat transfers for each zone of the heat exchanger have been obtained by an iterative process, the overall effectiveness of the heat exchanger can be computed by Eq. (13):
A B C
min ( su,ind su,out)
ε T Q T Q Q C ⋅ + + = - (13) The enlargement factor (and therefore the heat exchanger area) for the central part of the matrix is calculated as a function of a and b by using Eq. (14):
sin
L Φ
a
= (14) This corresponds to the ratio between the semi wavelength of the sinus Lsin (as depicted in Fig. 6) and the semi-period a.
Lsin is determined by Eq. (15) (application of the Pythagorean theorem). The resolution of this elliptic integral is numerically obtained by the EES (2016) software:
2 2 sin 0 0 π π 1 ( ) d 1 cos d 2 a a b x L f x x x b a ¢ =
ò
+ =ò
+(
⋅)
(15)5.2 COP factors settings
Some values of the factors influencing the COP determination have to be set in order to carry out the COP mapping: – In the rest of the paper, the indoor and outdoor temperatures
are set to 20 °C and 8.5 °C respectively, which corresponds to the mean indoor and outdoor for a European moderate temperature such as in Belgium. Since this temperature difference is independent from the geometry parameters and it is kept constant in Eq. (2), it does not influence the COP mapping shape and thus neither the results obtained for the geometric parameters.
– The heat exchanger is considered as perfectly symmetric. – Mass flows are considered perfectly well-balanced, which
means that indoor and outdoor mass flow rates are identical.
– Electrical consumption is determined using manufacturer fan curves depending on the flow rate and pressure drop of the whole unit (heat exchanger and rest of the installation). – Pressure drops related to the rest of the installation
have been experimentally determined before the COP optimization phase.
– Design steps are conducted by setting a design airflow rate of 60 m3/h.
5.3 Constraints definition
This section aims at listing the several constraints to take into account in the parameters identification of the heat exchanger. These constraints can be classified into three categories: technical (manufacturing constraints), acoustic (pressure drop limit) and economic (manufacturing costs).
Due to technical manufacturing constraints, the minimal values for a and b are respectively a > 1 mm and b > 2.5 mm. Using the current manufacturing technology, the maximum enlargement factor that could be reached is Φ > 400%. Plate thicknesses before and after the thermoforming process are equal to 0.25 mm and 0.05 mm respectively, which is the minimal value that could be reached with polystyrene with such a process.
Great attention is also paid to noise level of the device since the units are to be placed in rooms. In order to obtain good acoustic performance of the device, several guidelines can be followed. The first one is to use the most silent and efficient fan. This step is realized at the beginning of the design of SRVHR and is not detailed in the present paper. In SRVHR, the impact of sound absorber is really limited, as reported by Gendebien (2014). This is mainly due to the lack of space dedicated to SRVHR. On the contrary, reducing the pressure drop of the unit (heat exchanger and rest of installation) has a strong impact on the hydraulic and thus the acoustic performance. This is the reason why a map of ΔP for a given flow passage through the heat exchanger as a function of parameters a and b will be drawn. Usually, acoustic requirements are dependent of the type of considered local, according to the standard NBN S01-400-1 (NBN 2008). For a given flow rate, it is possible to convert the maximum authorized noise level into a maximum pressure drop related to the flow passage in the heat exchanger. This can be realized by knowing the acoustic and hydraulic performance curve of the used fans as well as the pressure drop related to the air passage through the rest of installation (out of heat exchanger). In the investigated case, the maximal pressure drop allowed for the air passage through the heat exchanger has been determined equal to 40 Pa. The acoustic constraints can be stated as follow: ΔP < 40 Pa.
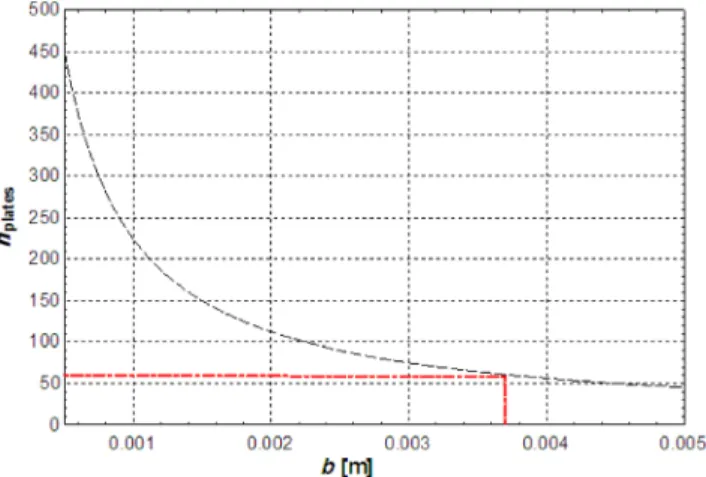
From an economical point of view, the manufacturing process cost is dependent on the number of plates composing the heat exchanger. The maximal number of plates can be translated by determining a minimal value for b, as shown in Fig. 7. A maximum number of plates is imposed to 60 which corresponds to a value equal to b = 0.00375 m.
Fig. 7 Number of plates of a function of the parameter b
6 Results
6.1 Pressure drop evolution
Figure 8 shows the evolution of the pressure drop as a function of the geometric parameters a and b. The dashed lines corresponds to the limit of 40 Pa defined in Section 5.3. The corresponding set of values for a and b will be used as a constraint in the COP mapping, presented in Section 6.3.
Fig. 8 Pressure drop map as a function of a and b 6.2 Thermal performance evolution
Figure 9 shows the evolution of the effectiveness as a function of a and b. Even though it is not graphically represented, the same trend may be observed with the heat transfer area evolution. As expected, the thermal and hydraulic performance does not follow the same trend and the optimal values of a and b result in a trade-off. In some cases, one can consider a minimal effectiveness as a constraint in order to reach some thermal performance required in national standards. Such a constraint has not been considered in the frame of this paper.
Fig. 9 Effectiveness map as a function of a and b
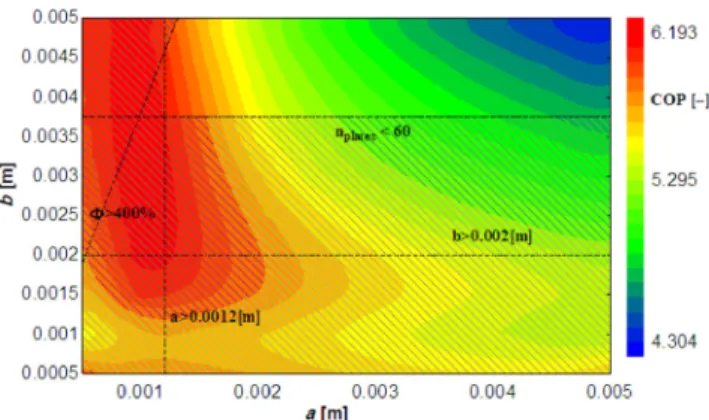
6.3 COP mapping
The aim of the present section is to show the results of the COP mapping. It has been graphically determined by representing the COP evolution while varying a and b from 0.5 mm to 5 mm, as shown in Fig. 10. Dashed lines correspond to the previously defined constraints.
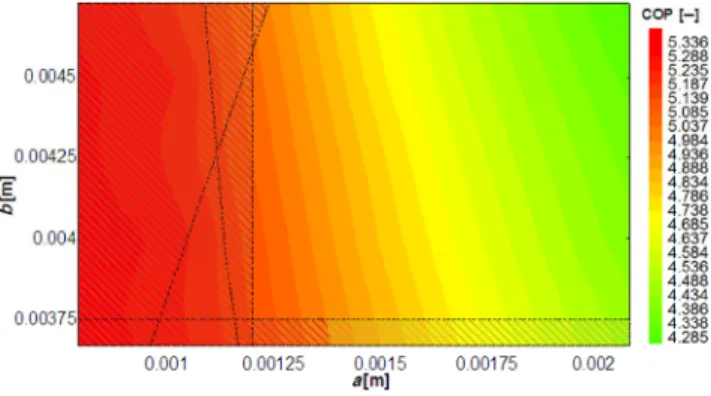
Figure 11 is obtained by zooming in the high-COP region. From this figure, it can be noted that the best value for the parameter a is equal to 0.0012 m. The value for the parameter b optimizing the COP is equal to 0.00375 m. In that case, the COP is equal to 5.13, but the total number of plates is equal to 60. However, another value of the parameter
b could be chosen if the manufacturing cost was taken into
account. For example, a value for the parameter b equal to 0.0045 m results in a lower COP of 5.05 but also in a decrease of the number of plates (down to 50). For a quasi- equal COP, a geometry presenting a lower manufacturing cost (reduction of 16% of the number of plates) might be preferred. From those results, the best values for a and b are chosen to be, in the frame of this work, a = 1.2 mm and
b = 4.5 mm.
Fig. 10 COP mapping
Fig. 11 High-COP region
7 Parametric study
The aim of this section is to discuss the influence of some COP factor settings (as defined in Section 5.2) and other dimensions. More specifically, this study is realized by varying the design flow rates delivered by the unit, the assumed hydraulic performance of the rest of the installation and the external dimensions (W, H and L) of the heat exchanger. 7.1 Effect of the delivered flow rates
As a first step, the influence of the design flow rate is investigated. To this end, the COP mapping is re-performed with another value of well-balanced flow rates (arbitrary chosen at 30 m3/h). This kind of study is relevant when investigating units able to deliver variable flows (e.g. by using variable speed fans for demand control ventilation). Indeed, it is interesting to assess the influence of the design flow rate on the HX optimal geometry to ensure proper variable charge performance.
By comparing Fig. 10 and Fig. 12, it may be seen that differences appear in the shape of the COP mapping. For instance, the new COP mapping present a local maximum while varying the parameter a, which was not the case for the
initial design. However, it is interesting to note that, while accounting for the various constraints in the selection process, the optimal values of a and b found for the new design are very close to the original one (a = 0.0012 m and b = 0.0045 m). Acoustic constraint is not represented in Fig. 12 (set of values for a and b is beyond the range displayed in the figure for a flow rate of 30 m3/h).
7.2 Effect of the hydraulic performance of the rest of the installation
If the pressure drop related to the rest of the installation is assumed equal to 0 Pa, a new COP mapping is obtained (Fig. 13). This ideal case allows for assessing the sensitivity of the COP evolution in function of the hydraulic performance of the ROI.
The same conclusion can be drawn concerning the optimal values for a and b. However, a difference can be observed concerning the area where the COP is optimized. The latter is larger and other values for aand b leading to a decrease of pressure drop (see Fig. 8) could be selected. This observation is important regarding the acoustic performance of the unit.
It can also be observed a difference in terms of the maximal value reached by the COP between Fig. 10 (COPmax = 5.33) and Fig. 13 (COPmax = 7.95). It highlights the fact that hydraulic performance of the ROI (and not only the HX) has a crucial role on the overall performance of such unit. 7.3 Effect of the external dimensions of the heat exchanger
In the previous analyses, the external dimensions (V, W, H and L) were pre-defined and chosen to be consistent for a standard HX dedicated to a single room ventilation unit. The aim of the present study is to assess the impact of these
Fig. 13 COP mapping for well-balanced flow rates of 60 m3/h and ΔPROI = 0 Pa
external dimensions on the optimal parameters a and b and their influence on the COP reached by the unit.
Figure 14 shows the result of the COP mapping by doubling the length L of the heat exchanger. That consists in using two HXs of the same external dimensions (presented in Fig. 1) in parallel for the same design flow rate (60 m3/h). Here also, the dashed line related to the acoustic constraint is not represented since it is beyond the range displayed in the figure. Without accounting for the negligible difference in terms of pressure drop at the inlet and outlet parts of the HX, doubling the height H or the length L has the same impact in terms of COP evolution.
As shown in Fig. 14, it is interesting to notice that even by doubling the volume of the heat exchanger (by doubling L), the maximal value reached by the COP (COPmax = 6.2) is lower compared to the case where the pressure drop of the ROI is assumed to 0 Pa (COPmax = 7.9, as shown in Fig. 13). Once again, this highlights the importance of the hydraulic performance of the whole unit and its impact on the COP.
Doubling the central part of the heat exchanger V is equivalent to add a second HX in series. As observed in Fig. 15, such new configuration leads to a change in the maximal value reached by the COP (COPmax = 5.1). This phenomenon can be explained by the fact that adding a
Fig. 14 COP mapping for well-balanced flow rates of 60 m3/h (doubling the length of the heat exchanger L)
Fig. 15 COP mapping for well-balanced flow rates of 60 m3/h (by doubling the central part V)
second HX in series raises the effectiveness of the heat exchanger but also doubles the pressure drop. On the other hand, when adding a heat exchanger in parallel, both thermal and hydraulic performances of the unit are improved. Conclusions concerning the final optimized values for parameters a and b are also different. Indeed, the acoustic constraint (ΔP < 40 Pa) implies the rejection of the values initially determined in Section 6.3.
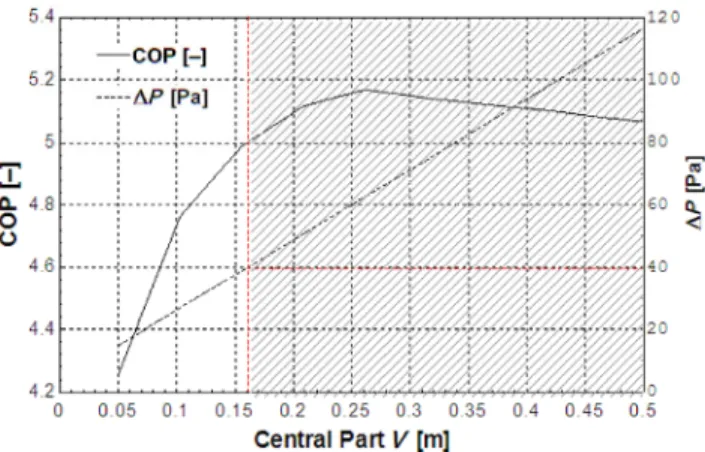
The effect of the length variation of the central part on the COP evolution is presented in Fig. 16. The study is realized with optimized a and b values (see Section 6.3).
A value equal to V = 0.24 m for the central part of the matrix corresponds to the COP maximum. For higher values of V, the augmentation of the thermal effectiveness is counterbalanced by a rise of the pressure drop which leads to an overall degradation of the COP. Moreover, higher values than V = 0.16 m are rejected given the acoustic constraints.
Fig. 16 COP and ΔP Pa as a function of the central part length of the unit
8 Discussion
It is important to notice that the exposed method can also be applied when designing heat recovery exchanger dedicated to centralized ventilation. It implies knowing or approximating the hydraulic performance of the so-called rest of the installation. The knowledge of the fan perfor-mance curve remains obviously essential to carry out such a study. It is worth to note that the constraints when studying a centralized ventilation system can be modified in comparison to the scenario described in this paper (i.e. SRVHR). In particular, the constraints related to the acoustic and the compactness aspects can be less restrictive.
One can also note that the proposed design steps could be applied to heat exchangers presenting other types of geometries, materials, or flow configuration. Each related optimization involves the definition of new constraints. A comparison between all the optimized solutions can be carried out in order to determine the best solutions.
Final geometry can also be checked by means of a CFD analysis to confirm numerical results coming from the semi empirical model.
9 Conclusions
The present paper aims at describing a methodology to determine the best geometric parameters for a single room ventilation recovery heat exchanger, by means of a COP mapping approach. This COP mapping is performed by simulation with a spatially divided heat exchanger model, using correlations for the determination of the friction factors and the convective heat transfer coefficients. The hydraulic performance of the rest of the installation, as well as the fan performance curve, must be previously known or approximated to carry out this optimization. The last design step relies on the application of key constraints classified in three categories: economic, hydraulic and technical.
Once the optimal geometry of the newly built heat exchanger defined, a set of parametric studies is conducted to investigate the effect of various parameters. Out of this study, the following statements can be formulated. The design flow rate appears to influence not much the set of optimal parameters a and b, which ensures a proper performance in variable charge operation. The hydraulic performance of the rest of the installation has a crucial importance on the maximal value that could be reached for the COP. Besides of the parameters a and b, the external dimension of the HX (i.e. W, H and L) are also key parameters to be optimized. Indeed, an increase of L or H is always beneficial for the system COP since it positively impacts both the hydraulic and the thermal performance of the unit. On the other hand, an increase of W improves the heat transfer while degrading the hydraulic performance of the HX. Furthermore, too high values of W cannot be considered viable because of acoustic constraints. Therefore, the width of such heat exchanger must be chosen carefully.
Acknowledgements
This study has been carried out in the frame of the Green + project. This project was performed with the support of the Walloon Region and was carried out by a large consortium of research centers and industrial partners, such as Greencom development s.c.r.l.
References
Adamski M (2004). Optimization of the form of the plates of counterflow ventilation heat exchangers. In: Proceedings of the 10th International Symposium on Heat Transfer and Renewable Sources of Energy, Szczecin-Miedzyzdroje, Poland.
Adamski M (2008a). Heat transfer correlations and NTU number for the longitudinal flow spiral recuperators. Applied Thermal
Engineering, 29: 591–596.
Adamski M (2008b). Longitudinal flow spiral recuperators in building ventilation systems. Energy and Buildings, 40: 1883–1888. Adamski M (2010). Ventilation system with spiral recuperator. Energy
and Buildings, 42: 674–677.
Asdrubali F, Baldinelli G, Bianchi F, Cornicchia M (2015). Experimental performance analyses of a heat recovery system for mechanical ventilation in buildings. Energy Procedia, 82: 465–471.
Ayub ZH (2003). Plate heat exchanger survey and new heat transfer and pressure drop correlations for refrigerant evaporators. Heat
Transfer Engineering, 24: 3–16.
EES (2016). Engineering Equation Solver. F-Chart Software.
El Fouih Y, Stabat P, Rivière P, Hoang P, Archambault V (2012). Adequacy of air-to-air heat recovery ventilation system applied in low energy buildings. Energy and Buildings, 54: 29–39. Eurostat (2016). Available at http://www.ec.europa.eu/eurostat. Accessed
Nov 2016.
Fehrm M, Reiners W, Ungemach M (2002). Exhaust air heat recovery in buildings. International Journal of Refrigeration, 25: 439–449. Fernández-Seara J, Diz R, Uhía FJ, Dopazo A, Ferro JM (2011).
Experimental analysis of an air-to-air recovery unit for balanced ventilation systems in residential buildings. Energy Conversion
and Management, 52: 635–640.
FGK (2012). Supplements to Preparatory Study on Residential Ventilation LOT 10. Fachinstitut Gebäude-Klima e.V., Germany.
Gendebien S, Georges E, Prieels L, Lemort V (2013a). Experimental performance characterization of a new single ventilation device with heat recovery. In: Proceedings of the 34th AIVC Conference, Athens, Greece.
Gendebien S, Bertagnolio S, Lemort V (2013b). Investigation on a ventilation heat recovery exchanger: Modeling and experimental validation in dry and partially wet conditions. Energy and Buildings, 62: 176–189.
Gendebien S (2014). Contributions to the development of a single room ventilation unit with heat recovery. PhD Thesis, University of Liège, Belgium.
Händel C (2011). Ventilation with heat recovery is a necessity in “nearly zero” energy buildings. REHVA Journal, 2011(3): 18–22. Hesselgreaves JE (2001). Heat Exchangers: Selection, Design and
Operation. Oxford, UK: Pergamon Press.
Incropera FP, DeWitt DP (2002). Fundamentals of Heat and Mass Transfer, 5th edn. New York: JohnWiley & Sons.
IEA (2011). Technology Roadmap for Energy-Efficient Buildings. International Energy Agency.
Kleeman M (1978). Design of a new compact recuperator. PhD Thesis, Rheinisch-Westfälische Technische Hochschule Aachen, Germany. Kragh J, Rose J, Nielsen TR, Svendsen S (2008). New counter flow
heat exchanger designed for ventilation systems in cold climates.
Energy and Buildings, 39, 1151–1158.
Manz H, Huber H, Schälinc A, Weber A, Ferrazzini M, Studer M (2000). Performance of single room ventilation unit with recuperative or regenerative heat recovery. Energy and Buildings, 31: 37–47.
Mardiana-Idayu A, Riffat SB (2012). Review on heat recovery technologies for building applications. Renewable and Sustainable
Energy Reviews, 16: 1241–1255.
Nam SH, Han H (2016). Computational modeling and experimental validation of heat recovery ventilator under partially wet conditions.
Applied Thermal Engineering, 95: 229–235.
Nasif MS, Morrison GL, Behnia M (2005). Heat and mass transfer in air to air enthalpy heat exchangers. In: Proceedings of the 6th World Conference on Experimental Heat Transfer, Fluid Mechanics, and Thermodynamics, Matsushima, Japan.
NBN (2008). NBN S 01-400-1:2008, Criteria for Acoustic Comfort in Dwellings. Bureau for Standardisation, Belgium.
Nellis G, Klein S (2009). Heat Transfer. Cambridge, UK: Cambridge University Press.
O’Connor D, Calautit JKS, Hughes BR (2016). A review of heat recovery technology for passive ventilation applications. Renewable
and Sustainable Energy Reviews, 54: 1481–1493.
Roulet C-A, Heidt FD, Foradini F, Pibiri M-C (2001). Real heat recovery with air handling units. Energy and Buildings, 33: 495–502. Schwenzfeier L, Akoua J-J, Bianchina M, Buseyne S, Limoges D,
Morel R (2009). Use of compact balanced single room ventilation units with heat recovery in existing dwellings. In: Proceedings of the 30th AIVC Conference, Berlin, Germany.
Söylemez MS (2000). On the optimum heat exchanger sizing for heat recovery. Energy Conversion and Management, 41: 1419–1427. Teke İ, Ağra Ö, Atayılmaz Ö, Demir H (2010). Determining the
best type of heat exchangers for heat recovery. Applied Thermal
Engineering, 30: 577–583.
T’Joen C, Park Y, Wang Q, Sommers A, Han X, Jacobi A (2009). A review on polymer heat exchangers for HVAC & R applications.
International Journal of Refrigeration, 32: 763–779.
Trias Energetica (2016). Trias Energetica Concept Website. Available at http://www.triasenergetic.com. Accessed Mar 2016. Wouters P, Heijmans N, Delmotte C, Van den Bossche P, Wuyts D
(2008). Trends in the Belgian building ventilation market and drivers for change. In: Proceedings of the 29th AIVC Conference, Kyoto, Japan.