REVISED EU-CRITERIA FOR APPLYING BIOANALYTICAL METHODS FOR
SCREENING OF FEED AND FOOD FOR DIOXINS AND DIOXIN-LIKE PCBS
Hoogenboom LAP1, Hädrich J2, Eppe G3, Goeyens L4, Elskens M4, Malagocki P5, Scippo ML3, Vanderperren H6, Windal I7, Kotz A2, Denison MS8, Malisch R21RIKILT, Wageningen UR, P.O. Box 230, 6700AE Wageningen, The Netherlands; 2 European Union Reference Laboratory for Dioxins and PCBs in Feed and Food, D-79114 Freiburg, Germany; 3Université Liege, CART, Faculty of Veterinay Medicine, Department of Food Sciences, Laboratory of Food Analysis, B-4000 Liège, Belgium; 4Vrije Universiteit Brussel, Department of Analytical & Environmental Chemistry, Brussels, Belgium; 5National Veterinary Research Institute, 24-100 Pulawy, Poland; 6Federal Agency Safety Food Chain, B-3080 Tervuren, Belgium; 7Rue du Tivoli 6, B-5030 Gembloux, Belgium; 8Univ Calif Davis, Department of Environmental Toxicology, Davis, CA 95616, USA
Introduction
Performance criteria for bioanalytical analysis of dioxins in food were previously developed by a consortium of scientists experienced with the assay, including the two companies that commercialized the CALUX bioassay. Criteria were presented at the Dioxin 2001 conference in Gyeongju, Korea (1) and later on adopted by the EU in a document dealing with performance criteria for both the HRGC/HRMS confirmatory method and screening assays (2,3). Minor changes were introduced in updates (4,5), but recently it was decided to reevaluate the criteria based on gained experience of a number of National Reference Laboratories and the European Union Reference Laboratory. The present paper describes the major issues discussed by the working group and the proposed revisions.
Bioanalytical methods generate qualitative or semi-quantitative results
Exposure of cells to PCDD/Fs or dl-PCBs results in a concentration dependant increase of the response. However, the newly proposed requirements stress the fact that the main purpose of the test is screening in order to obtain a qualitative result. This will be achieved by comparison of the test result with a certain cut-off value. This is in line with the IUPAC definition of quantitative analysis, stating that quantitative analysis requires the identification (qualification) of the analytes for which numerical estimates are given (6). As discussed below, this is not necessarily the case for the CALUX-assay. Also the new EU guidelines for the validation of screening methods for residues of veterinary medicines clearly define the nature of results from bioanalytical screening as qualitative or semi-quantitative, the latter primarily intended for guidance of the confirmatory method.
Indicative levels from bioanalytical screening methods are best expressed in bioanalytical equivalents (BEQs)
An indicative level in the sample may be calculated but it should be clear that this semi-quantitative figure results from screening and not from HRGC/HRMS. This is best achieved by expressing the result in BEQs rather than TEQs. When a standard deviation on the indicative level is given, this should represent at least a triplicate analysis, including extraction and clean-up.
PCDD/Fs and dl-PCBs actually refer to a mixture of compounds with similar toxicological effects but different potencies. In practice this means that the effects are additive but that the actual cumulative effect depends on the relative potencies of the compounds present in the mixture. The TEQ-principle was introduced to deal with the differences in toxic potencies of the various congeners. Based on in vivo and in vitro studies it was decided whether congeners should obtain a so-called TEF value and if so, what this TEF-value should be. The decision to assign a TEF value was not simply based on the ability of compounds to bind to the Ah-receptor (AhR) and/or induce dioxin-like gene expression, since this would also apply for many AhR-active polycyclic aromatic hydrocarbons (PAHs) and naturally occurring compounds present in many fruits and vegetables, but the ability of the congener to produce a common set of AhR-dependent toxic effects. A second important feature of the compounds assigned TEF values (i.e. PCDD/Fs and dl-PCBs) is their relative resistance to metabolic degradation, thus resulting in their accumulation in humans and animals. Only 7 PCDDs and 10 PCDFs, as well as 12 dioxin-like PCBs were therefore included. While other candidate compounds and compound classes (e.g., brominated and mixed halogenated
dioxins/furans and polychlorinated naphthalenes) are being considered for inclusion in the TEF toxicity scheme, they have not yet been assigned TEF-values.
In practice the current CALUX bioassays are to some extent selective towards these different classes of compounds. First of all, and very crucial for routine application, the test applies a clean-up with a sulfuric acid-silica column, which will remove many of the non-dioxin-like AhR agonists. In some cases an additional clean-up over activated carbon is used, intended to separate dl-PCBs from PCDD/Fs but also removing other undesired AhR active compounds. Secondly, the cells used for the assays are to some extent able to inactivate certain compounds by active metabolism. Nevertheless, in routine testing, certain types of products frequently show an elevated response that cannot be assigned to PCDD/Fs or dl-PCBs included in the TEQ principle. It cannot be excluded that this response is due to compounds that do not produce dioxin-like adverse effects and an expression of the result in TEQs may suggest otherwise. Nevertheless, the detection of potential novel risks is an important advantage of the use of a combined bioanalytical and chemo-analytical approach and follow-up of false-positive test results is recommended.
Another important issue is the way in which the TEFs were assigned. While all available data on relative potencies were evaluated, there was a clear emphasis on those values directly associated with the production of toxic effects in animals or humans, if available. Such studies would include potential differences in pharmacokinetics but also evaluate the actual adverse effects beyond the initial steps of the mechanism of action of these compounds (i.e. the binding to the AhR and the subsequent change in gene expression, protein levels or enzymatic activities). The relative potencies derived in various studies may show a wide range and the assigned TEF-values are in practice weighted factors. Although there is a clear correlation between the assigned TEF-values and the relative response, expressed as a relative potencies (REPs), in the bioassays, there is not an exact 1 to 1 relationship. Also based on the deviation between REPs and TEFs, the result of a bioanalytical method can only provide an estimation of the total TEQ of a sample that would be derived from HRGC/HRMS analysis, where the levels of the individual congeners are determined, multiplied by the assigned TEF-value and summed.
Bioassay calibration curve and working range
The concentration-dependent production of the AhR-inducible enzyme luciferase (in the CALUX bioassay) follows the shape of a sigmoid-like curve, which can be characterized by a maximum response (Rmax), an EC50, being the concentration resulting in a half-maximal response, and a slope parameter at the EC50 value. In dose-response curves, residuals are not equal at all concentrations and therefore it seems justified to apply a weighted least squares (WLS) regression to fit a 4-parametric sigmoid Hill function. It has been shown, however, that in particular in the lower part of the curve even this fit is far from ideal. In WLS regression, a coefficient of determination (R2) close to 1 does not guarantee a satisfactory regressive fit. A better curve fit is obtained when instead of optimizing the R2, the sum of squared residuals (SSR) is minimized.
For routine testing it is important to know the concentration range that leads to a trustworthy result. It is clear that at low concentrations the influence of an unspecific background response on the results is strong, and a small variation in the response leads to large variations in the estimated level in the sample. The latter is also true for a response close to the maximum response (Rmax). For this reason, it seems impossible to determine an LOD or LOQ solely based on the mean response and SD obtained with the solvent (DMSO). If determined at all, it should be set at a sample level showing a significantly elevated response in comparison with the non-contaminated sample.
Standard solutions and sample extracts should be tested at least in duplicate wells. When using duplicates, a standard solution or a control extract tested in 4 to 6 wells distributed across the plate should produce a response or concentration (only possible in the working range) with a CV<15%.
When calculating the concentrations from a TCDD calibration curve, values at the lower and higher end of the curve will show a high variation (CV). The working range is the area where this CV is smaller than 15%. The lower end of the working range (reporting limit) must further be set significantly (at least by a factor of three) above the procedure blanks. The upper end of the working range is usually represented by the EC70 value (70% of maximal effective concentration), but lower if the CV is higher than 15% in this range. The working range should be established during validation. Cut-off values (see below) must be within the working range.
The question that remains is what to do with samples with a test response outside the working range. Previously, the performance criteria included the obligation to dilute extracts to obtain a more reliable estimate. In
practice, samples with a response lower than the working range will be negative (below cut-off) and require no further investigation. Samples showing a test response above the working range are possible candidates for high levels of PCDD/Fs and/or dl-PCBs and should be analyzed by HRGC/HRMS as soon as possible. Additional investigations to obtain a better estimate of the level of a suspected sample should certainly not delay the confirmatory analysis.
Recovery, reproducibility and repeatability
Contrary to HRGC/HRMS, bioanalytical methods cannot control their extraction and clean-up process by including internal standards. This makes the assay potentially vulnerable to variations in extraction efficiency and the recovery of the compounds of interest. However, extensive analysis has revealed that the extraction and clean-up over acidic silica are processes with a high and reproducible recovery. More critical may be the evaporation of the final extract. In order to obtain a view on the real recovery, final extracts should also be examined by HRGC/HRMS as part of the validation studies.
In current legislation, the requirement for the precision or relative standard deviation obtained under reproducibility conditions (RSDR) is set at <30%. Since this has serious consequences for the cut-off value (see below), it was decided to reduce this to 25%. In addition an RSDr for repeatability was set to <20%.
Determination of suitable cut-off values for checking compliance with maximum and/or action levels
The most critical issue when applying a screening method is the cut-off value: “When should a sample be considered as suspected to be noncompliant and be further examined with a confirmatory method? And what is an acceptable fraction of samples that are in fact non-compliant, whereas a compliant measurement has been obtained (false-compliant decision)?” Previously, this so-called beta-error was set at 1% for screening methods for PCDD/Fs and dl-PCBs, whereas for other food contaminants 5% is common. A beta-error of 1% presents a number of difficulties, a very important one being the fact that it is very difficult to evaluate it during validation. Hundreds of positive samples of each sample matrix may have to be tested for this purpose. Furthermore, a low conservative cut-off level may have to be established, resulting in large numbers of false-noncompliant results (see below), making the application of any screening method less effective.
The latter is also true when discussing whether cut-off values should be based on maximum levels (ML) or action levels (AL), the latter being around 2/3 of the ML for most matrices. The current EU strategy on dioxins and dl-PCBs is based on three pillars, maximum (ML), action (AL) and target levels (7). MLs were set to regulate compliance, whereas ALs were set as “early warning” for elevated levels to identify possible sources for contamination. Samples exceeding the AL but not the ML are compliant but may require further action to discover the source of the contamination. MLs were set for PCDD/F-TEQ and the sum of PCDD/F- and dl-PCB-TEQs, whereas ALs were set separately for PCDD/F-TEQ and dl-PCB-TEQ. MLs have been set according to the principle “strict but feasible”. Data on levels in each type of product were collected and MLs were set around the 95-99% level, meaning that 1-5% of the samples with the highest levels would be noncompliant. For most sample matrices, ALs were set at 2/3 of the ML. The main focus of bioassays is to check compliance of samples, meaning that the control of MLs is the main point of interest. It may however be argued that bioassays should also detect most of the samples exceeding the AL, but no performance criteria were set for this purpose (see below).
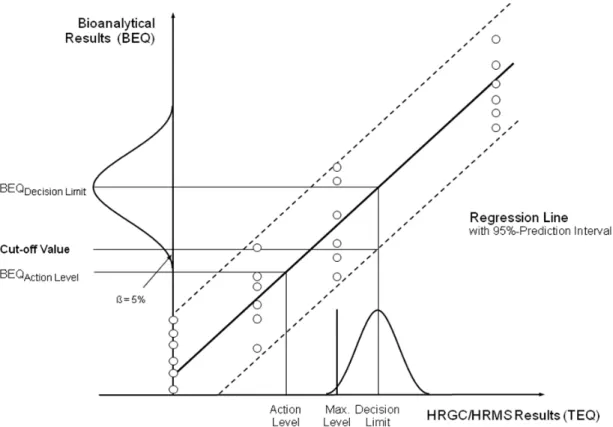
For determination of ML-based cut-off values, first the relationship between bioanalytical results (in BEQ) and HRGC/HRMS results (in TEQ) has to be established (e.g. by matrix-matched calibration experiments, involving reference samples spiked at 0, 0.5x, 1x and 2x maximum level, with 6 repetitions on each level) (8). The bioanalytical results should be corrected for blank and recovery. Cut-off values are represented by the lower endpoint of the distribution of bioanalytical results (RSDR <25%) corresponding to the HRGC/HRMS decision limit, which is based on a 95% level of confidence, implying a false-compliant rate <5%. Figure 1 demonstrates the relationship between the cut-off values and the ML including the expanded measurement uncertainty, used as a decision limit by HRGC/HRMS. In practice, the cut-off value (in BEQ) may be calculated from three different approaches: (1) use of the lower band of the 95% prediction interval at the HRGC/HRMS decision limit, (2) calculation from bioanalytical results (corrected for blank and recovery) of multiple analyses of samples (n>6) contaminated at the HRGC/HRMS decision limit, as the lower endpoint of the data distribution at the corresponding
Figure 1. Calculation of cut-off values based on a 95% level of confidence implying a false-compliant rate < 5%, and a RSDR <25%: 1. from the lower band of the 95% prediction interval at the HRGC/HRMS decision limit, 2.
from multiple analysis of samples (n>6) contaminated at the HRGC/HRMS decision limit as the lower endpoint of the data distribution (represented in the figure by a bell-shaped curve) at the corresponding mean BEQ value.
mean BEQ value, or (3) calculation as mean value of bioanalytical results (in BEQ, corrected for blank and recovery) from multiple analysis of samples (n>6) contaminated at 2/3 the level of interest.
This cut-off value will in practice be slightly higher than 2/3 of the ML, i.e. for most matrices corresponding to the current AL. So, based on both the theoretical considerations and the practical experience it can be concluded that cut-off values at 2/3 of the ML are suitable to guarantee a beta-error of less than 5%. In practice, BEQ-based cut-off values calculated from the RSDR achieved during validation using a limited number of samples with different matrix/congener patterns may be higher than the TEQ-based levels of interest due to a better precision than attainable in routine when an unknown spectrum of possible congener patterns has to be controlled. In such cases, cut-off values still have to be calculated from an RSDR = 25%, or two-thirds of the level of interest should be preferred.
In routine, most samples exceeding the AL will be detected as well (9) but no criterion was set for a beta-error on the AL. When applying the same beta-error as for the ML, a similar approach as for the ML can be used, focusing on a HRGC/HRMS decision limit equal to the AL plus expanded measurement uncertainty. Cut-off values would be around 2/3 of the AL. However, this may result in large numbers of false-noncompliant results, since many samples in routine will have levels around this cut-off value. This is exemplified by the recent collection of data by EFSA (10), showing that most MLs are around the P95 and that many ALs fall between P75 and P90. A cut-off value around 2/3 of the AL would correspond to levels around a P75 and require HRGC/HRMS confirmation of 25% of the samples. As a result, any screening method for PCDD/Fs and dl-PCBs would in theory become useless. More importantly, the widespread use of screening methods and subsequent analysis of much larger sample
numbers will actually increase the chance of detecting samples with dioxin- and dl-PCB-levels that really present a health threat.
In practice, levels will be estimated based on a TCDD (or PCB 126) calibration curve and then be corrected for blank and recovery based on reference samples. The estimated level is then compared with the cut-off value. Levels may also be estimated from a curve based on a set of representative reference samples with levels around the cut-off level. In that case, no corrections for blank and recovery are required. This approach also allows the determination of the response (in relative light units (RLUs) for the CALUX bioassay) corresponding to the cut-off level, which can then be used to qualitatively evaluate the test result of samples (i.e. are they negative or suspected to be positive).
To split or not to split
Current EU-legislation has MLs for PCDD/Fs and the sum of PCDD/Fs and dl-PCBs for each type of product or feed ingredient. In addition, there are ALs for both PCDD/Fs and dl-PCBs. Bioanalytical methods in principle detect any AhR-agonist present in the sample extract and as such do not discriminate between PCDD/Fs and dl-PCBs. This can only be achieved by using an additional clean-up step in order to separate PCDD/Fs and dl-PCBs. Some laboratories apply such an additional step based on a column with activated carbon. This is a rather successful strategy to compare results directly with the ALs which are set separately for PCDD/Fs and dl-PCBs and with the ML separately set for PCDD/F. However, this additional step adds to the complexity of the clean-up and also has some consequences for recovery and background response.
A major question is how to deal with the cut-off levels when not splitting the extract. It is evident that focusing on the ML for the sum of PCDD/Fs and dl-PCBs will result in a high beta-error for samples contaminated with only PCDD/Fs, which is true for many incidents. Therefore, a cut-off value based on the ML for PCDD/Fs should be the target for screening. Since ALs for dl-PCBs for a number of products are lower than for PCDD/Fs, more samples exceeding the AL for dl-PCBs might be missed.
Use of reference samples
References samples are important for control of procedure and sample matrix blank values and apparent recovery, but also for controlling the performance of the test. Furthermore, they may be used for estimating the levels of active compounds in the test samples. Ideally, reference samples are incurred materials but in the case of bioanalytical methods there is a serious risk that such samples contain unknown AhR-agonists that may give an elevated response. Ideally, a material showing a low response in the bioassay is used. Such samples can subsequently be fortified at a relatively high level, then be analyzed by HRGC/HRMS and subsequently be diluted with the blank starting material to obtain the desired activity levels (e.g. 0.5, 1 and 2x ML). Congener mixtures of PCDD/Fs and dl-PCBs should be representative for the patterns observed in food and feed, however, since there are many different patterns, this seems unfeasible. Most important is that a possible difference between the level based on the TEFs and that calculated from using the REPs in the bioassay, will not lead to an underestimation of the level in the test sample. In the case of the rat H4IIE-cells it was shown that such CALUX-based levels are for most PCDD/F patterns around 60-70%, with the exception of the pattern observed with pentachlorophenol contamination that shows a slight activity overestimation. This is due to the high contribution of HpCDD in the sample combined with its relatively high response in the test. In the case of dl-PCBs and based on the new TEFs from 2005, PCB 126 seems by far the most relevant congener. In the rat cells the REP values for this PCB vary between 0.05 and 0.067 as compared to a TEF of 0.1. So for dl-PCBs the levels in samples will be underestimated by 30-50%, when compared to HRGC/HRMS analysis, unless a standard curve of PCB 126 is used instead of TCDD. In H1L6.1c2 mouse cells, the REPs seem slightly different from those in the rat cells resulting even in an overestimation of the levels of PCDD/Fs but an even stronger underestimation of dl-PCBs. In practice it seems unnecessary to produce reference samples for each type of product but this should be demonstrated during validation.
Screening and confirmatory methods, just good friends
It seems obvious that there must be good connection between screening and confirmatory methods. Samples showing a suspected response must be analyzed by HRGC/HRMS. However, also part of the samples tested compliant should be analyzed by the confirmatory method in order to demonstrate the proper performance of the
test. Initially, it is recommended to test 2 to 10% of the negative samples for each type of product (minimum of 20 per matrix) but this may be decreased in a laboratory with experience over time depending on the results obtained. HRGC/HRMS is also important for checking the levels in the standards and reference materials. Overall, it is important that a laboratory using the screening method has a good arrangement with a laboratory performing the confirmatory method. Laboratories applying the test for control should evaluate the correspondence between results obtained by a bioanalytical method and HRGC/HRMS on a regular basis (both compliant and noncompliant results). This may result in an adjustment of the cut-off values. At the same time the performance of the test with respect to the ALs may be evaluated.
Regarding the difference in the principles behind the two types of methods, either based on effects or on the structure of the compound, their combined use is also very suitable for the detection of novel risks (11). Screening of choline chloride, a widely used feed ingredient, resulted in the discovery of a contamination with brominated flame retardants and bromodioxins (PBDD/PBDFs) (12). Initially the positive test result could not be confirmed by HRGC/HRMS but follow-up on this “false-positive” result led to the discovery of the contamination. Although not included in the legislation, brominated dioxins are well-known to be equitoxic to their chlorinated counterparts and it is expected that TEFs will be assigned as experimental potency results are obtained. This example demonstrates that routine screening may yield false-noncompliant results but that a follow-up on the compounds responsible for this result may reveal novel risks.
It is also important to realize that confirmatory methods also allow determination of levels of PCDD/F and dioxin-like PCBs reliably in the range of low background levels. This is important in order to follow time trends in levels, for performing exposure assessment of a population and to build a database for possible re-evaluation of action and maximum levels and derivation of target levels over time. As a result, both screening and confirmatory methods have advantages and limitations. However, their complementary use enables to achieve the various goals and objectives of feed and food analysis.
References
1. Behnisch PA, Allen R, Anderson J, Brouwer A, Brown DJ, Campbell TC, Goeyens L, Harrison RO, Hoogenboom R, Van Overmeire I, Traag WA, Malisch R (2001). Organohal. Comp. 50: 59-63.
2. EC (2002). Off. J. Eur. Comm. L209, 5-14. 3. EC (2002). Off. J. Eur. Comm. L209, 15-21. 4. EC (2006). Off. J. Eur. Comm. L364, 32-43. 5. EC (2009). Off. J. Eur. Comm. L54, 1-130.
6. IUPAC (1997). Compendium of Chemical Terminology, 2nd ed. (the "Gold Book"). Compiled by A. D. McNaught and A. Wilkinson. Blackwell Scientific Publications, Oxford (1997). XML on-line corrected version: http://goldbook.iupac.org (2006-) created by M. Nic, J. Jirat, B. Kosata; updates compiled by A. Jenkins. ISBN 0-9678550-9-8.
7. EC (2002). Off. J. Eur. Comm. L67, 69-73.
8. Hädrich J, Eppe G, Goeyens L, Hoogenboom LAP, Malagocki P, Scippo M-L, Vanderperren H, Windal I, Denison MS, Stumpf C, Kotz A, Malisch R (2010) Abstract on cut-off values. Organohal. Comp.(in press). 9. Vanderperren H, Hädrich J, Eppe G, Goeyens L, Hoogenboom R, Malagocki P, Scippo M-L, Windal I, Lekens
M (2010) Abstract on practical performance XDS CALUX-assay. Organohal. Comp. (in press). 10. EFSA (2010). EFSA J. 8(1385): 1-35.
11. Goeyens L, Hoogenboom LAP, Eppe G, Malagocki P, Vanderperren H, Scippo M-L, Windal I, Baeyens W, Denison MS, Hädrich J (2010) Abstract on discrepansies between CALUX and HRGC/HRMS. Organohal.
Comp. (in press).