www.world-food.net Journal of Food, Agriculture & Environment Vol.10 (1): 391-396. 2012
WFL Publisher Science and Technology
Meri-Rastilantie 3 B, FI-00980 Helsinki, Finland
e-mail: info@world-food.net
Research on crude protein and digestibility of Arnica montana L. using conventional
NIR spectrometry and hyperspectral imaging NIR
Laura M. Dale 1, 2, 3 *, Juan A. Fernández Pierna 3, Philippe Vermeulen 3, Bernard Lecler 3, Anca D. Bogdan 1,
Florin S. Păcurar 1, Ioan Rotar 1, André Thewis 2 and Vincent Baeten 3
1 Department of Grassland and Forage Crops, University of Agricultural Science and Medicine Veterinary, Cluj Napoca, 3-5
Calea Manaştur, 400372 Cluj, Romania. 2 Animal Science Unit, Gembloux Agro-Bio Tech, University of Liège, 2 Passage des
Déportés, 5030 Gembloux, Belgium. 3 Walloon Agricultural Research Center, Valorisation of Agricultural Products Department,
24 Chaussée de Namur, 5030 Gembloux, Belgium. e-mail: dale_lm@yahoo.com, ancadorinabogdan@yahoo.com, fpacurar@gmail.com, rotarioan52@yahoo.fr, fernandez@cra.wallonie.be, vermeulen@cra.wallonie.be, lecler@cra.wallonie.be,
athewis@ulg.ac.be, baeten@cra.wallonie.be Received 18 September 2011, accepted 7 January 2012.
Abstract
Arnica montana L. (AM) is considered a medicinal plant, used as hay in feed ration. The aim of this study is to assess the prediction of protein content and in vitro organic matter digestibility value in grass mixtures containing Arnica montana L., and in a second step to check if these values have a positive or negative influence in the mixtures. Crude protein has been selected because it is one of the most important quality parameters of forages as nutritional element used in animal feeding. The protein is required on a daily basis for maintenance, lactation, growth and reproduction, but is important for agriculture too, because a high content of protein makes it an important source of feed. The digestibility is also important, because it refers to the extent to which a feedstuff is absorbed in the animal body as it passes through an animal’s digestive tract. In this study, the Weende system (the Kjeldahl method) for the protein content, together with the enzymatic technique for digestibility, was applied and used in combination with non-destructive methods, like those based on the Near Infrared Spectroscopy (NIRS) or the Near Infrared Hyperspectral Imaging. Based on NIR imaging system data, the PLS-DA was used to discriminate between the classes with AM and classes without AM, as well as to build a model that could be used to predict the composition of mixtures. More than 99% correct prediction for AM was obtained. The crude protein content of the hay determined by classical method decrease from the type of meadow Agrostis capillaris L. - Festuca rubra L. (15.22%) until to the pure sample of Arnica montana L. (11.19%); however, the digestibility was highest in the pure sample of Arnica montana L. (84.13%) and lowest in samples from the type of meadow Agrostis capillaris L. - Festuca rubra L. (57.18%) or in samples with the participation of Arnica montana L. This study should lead to a more important point, which is to verify whether the medicinal properties of Arnica montana L. can be transferred or not to milk production through the dairy cow feed.
Key words: NIRS, hyperspectral imaging, Arnica montana L., crude protein, digestibility, PLS-DA.
Introduction
Forages contain a mixture of chemical, physical and structural characteristics that determine the quality of a pasture and the accessibility of nutrients to the target animal. Forage quality is a broader term that not only includes nutritive value, but also includes forage intake. Especially because forage plant characteristics change with maturity, regular and timely analyses of forage are required to determine if forage meets the daily nutritional requirements of the animals.
The importance of forages quality is mainly for establishing nutritionally balanced rations, developing and allocating forage inventories, evaluating forage management practices (growing, harvesting and storage), marketing and pricing forages. In 2003, the term ‘forage nutritive value’ was used to describe nutrient concentrations, digestibility and the nature of the end products of digestion 1.
Arnica montana L. (AM) is part of the European vegetation of
meadows, particularly in mountain areas. This plant belongs to the Asteraceae family. It is a small perennial herbaceous plant not exceeding half a metre in height, it is native of the temperate mountain regions (between 700 and 2500 m above sea level) of the northern hemisphere. Arnica montana L. is considerated a medicinal plant protected in Europe and can be used in human or in veterinary medicine. It has been used in traditional herbal healing as either an anti-inflammatory or a stimulant, but also because of its anti-bacterial qualities. In herbal medicine, its use is recommended for topical administration only for treatment of distortions, rheumatic pain and to promote wound healing 2. It can
be used like homeopathic veterinary medicinal products prepared according to homeopathic pharmacopoeias, or used in veterinary phytotherapy like topically for the treatment of acute inflammations of tendons. In 2008, it was proved that the collection of the Arnica
montana L. as a medicinal plant, in local processing and direct
marketing, could also be a key element in preserving oligotrophic
Abbreviations: NIRS, Near Infrared Spectroscopy; CP, crude protein; DMO, organic matter digestibility;
PLS-DA, Partial Least Squares-Discriminant Analysis; AM, Arnica montana L.; USAMV, University of Agriculture Science and Medicine Veterinary; GxABT, Gembloux Agro-Bio Tech, University of Liège;CRA- W, Walloon Agricultural Research Center.
grassland through utilization 3. In countries like Romania the forage
is composed almost of hay, which is rich in Arnica montana L. Sheep, horses and goats eat the AM like a fresh plant, but cattle rejects it because of the odder of leaves and flowers. As part of the hay, when it is dried, cattle would also consume it.
Top 10 quality parameters in forages are easy destruction (degradability), high content of non-structural carbohydrates, palatability, high fat content, high digestibility (low lignin content), high content of “protected” proteins, low content of anti-quality components (e.g. alkaloids), erect growth habit, balanced mineral content and high content in S-amino acids 4. Most of these
parameters need the use of wet chemistry methods that refer to a number of scientific techniques involving direct analyses with solvents, acidic or basic solutions, other chemicals and other traditional laboratory methods used to analyze feed samples. Wet chemistry methods are the most accurate methods for determining nutrient values of feeds or forages, they are frequently used for quality assurance purposes or in the development of new techniques (calculations). Moreover, wet chemistry is the basis for all modern, instrument-based, analytical methods and for calibration of NIRS methods.
Laboratory analyses of the composition of feed or forage are used to assess their nutritive value. A typical feed analysis includes measurements of some important quality attributes or parameters (e.g., crude protein, cellulose, digestibility, etc.) used to define nutritive value. Proteins are organic compounds composed of building blocks called amino acids. They are a major component of vital organs, tissue, muscle, hair, skin, milk and enzymes 5.
Undoubtedly, one of the major problems of grazed and conserved grass and legumes is the reduced efficiency of protein utilization. Ideally, grass should contain about 12% protein of 100% availability; so, on the one hand, it should look like maize and on the other hand, like red clover. However, it still remains perennial and grazed like a pasture.
In a review published in 2009, itwas related that almost each country has its own feeding value system, giving rise to confusion, although all the systems for evaluating the energy values are based on the same notion: digestibility 4. The digestibility of the
organic matter of forage is one of its most important characteristics. It refers to the extent to which a feedstuff is absorbed in the animal body as it passes through an animal’s digestive tract. It varies greatly with the type of feedstuff and type of animal concerned. Most of the above mentioned quality parameters have to be determined in the laboratory by chemical destruction of the sample. This means that the sample is no more available after the analysis for a possible repetition of the same analysis or for other chemical analyses. It is the merit of Norris et al. 31 who promotes
the NIRS for routine forage analyses 6.
Near Infrared Spectroscopy is based on diffuse reflectance of ground samples, it is widely used for laboratory measurements of the concentration of nutrients and feeding value in dried and fresh crop material 7, 10. The data obtained with NIR imaging
instrument agree well with those obtained by classical NIRS and all advantages of NIRS are possessed by the imaging instrument11.
The imaging system contains together spectral and spatial information. In the last years, important emphasis is put on the development of non-destructive methods for determining the quality of feed. Thus, developed countries have initiated numerous studies aiming at the development of non-destructive methods
based on NIRS technology in order to evaluate opportunities to build spectral database and perform calibration and validation of methods. For the last 20 years, the NIRS technique is more and more used in forage analyses techniques. Most of the NIR instruments dedicated to forage assessment have a spectral range from 1000 to 2500 nm.
The imaging instruments are detecting adequate NIR data and present a fast answer and a good repeatability. For perspective, NIR cameras and NIR spectroscopes can detect fractions of plant species and properties of plant material 12.
Imaging spectroscopy brings the concept of NIRS one step further, as it measures the in situ leaf reflectance with high spectral and high spatial resolution in the near-infrared area of the spectrum. It can be of interest for the discrimination of samples, not only for the variety discrimination.
The aim of this study is to determine if the protein content and the digestibility of Arnica montana L. influence the quality of hay produced in a certain area and if this influence is positive or negative for the quality of hay. The objectives of this study are to predict samples of grass hay from Apuseni mountains (Poienile Ursului) with a well defined calibration equation for the protein content and the digestibility. Then, the aim will be to study the possibility of using such samples to build a discrimination model for specific plants with known botanical composition based in
Arnica montana L. The resolution of these objectives is important
in order to improve the meadows culture with Arnica montana L.; not only for its use as medicinal plant (flowers collections), but also as meadow hay using their leaves in nutrition rational for cattle and horse.
Materials and Methods
The grasses were collected in July 2010 in Romania, Carpathians Apuseni Mountains, Gârda Area, which is included in Apuseni Natural Park. The research was realized in one type of meadow
Agrostis capillaris L. - Festuca rubra L. For chemical analysis,
the following samples were used: Type of meadow Agrostis
capillaris L. - Festuca rubra L. without Arnica montana L.
(LD500), type of meadow Agrostis capillaris L. - Festuca rubra L. with 40% of pure species Arnica montana L. (A1), type of meadow
Agrostis capillaris L. - Festuca rubra L. with 30% of pure species Arnica montana L. (A2), type of meadow Agrostis capillaris L. - Festuca rubra L. with 20% of pure species Arnica montana L.
(A3), type of meadow Agrostis capillaris L. - Festuca rubra L. with 10% of pure species Arnica montana L. (A4) and pure species of Arnica montana L. (sample LD567).
To build discrimination model, a data set was collected in order to validate the different equations and to estimate their composition. This data set consists of hay compound containing different types of varieties with different percentages. The contamination of the sample was made in four different types, it is presented in Table 1.
The grass was cut into field in July 2010 and let on field to dry. First, the grass was mixed and then the samples from each plot with one sound were taken. The pure samples were taken also from the same field of the Arnica montana L. and, after that, the rest was used like fodder for animals.
The samples taken with sound were natural dried and milled first (after one month) with Retsch Grndmx Gm 200 100-110V 50/60 HZ and after that with the Cyclotec™ 1093 Sample Mill. The mill is
based on the cyclone principle for universal grinding applications in the laboratory. The grinding was carried out by a high-speed action, where the sample was rolled against the inner circumference of a durable grinding surface and passed out through a screen. The high grinding capacity reached 4 g/s and the recovery of the sample was completed through a 1 mm sieve 13. First, the samples
were scanned by FOSS NIRSystems 6500 Silver Spring MD, USA (Fig. 1); afterwards, they were scanned by SWIR ImSpector N25E hyperspectral imaging system (Fig. 2).
The samples were scanned with the conventional NIRS, FOSS NIRSystems 6500 Silver Spring MD, USA, in small ring cup, from 1100 to 2500 nm, at 2 nm intervals. This near infrared line scan or push-broom imaging spectrometer uses a cooled, temperature stabilized MCT (Mercury-Cadmium-Telluride) detector (Xenics), combined with a conveyor belt (Burgermetrics). All images consist of lines of 320 pixels that are acquired at 209 wavelength channels: 1100-2400 nm with a spectral resolution of 6.3 nm and with 32 scans by image 14.
In Fig. 2, it is explained how the plane scan imaging system is
used. The images are stacked to form a three-sided matrix, where the first two axes (x and y) define the image plane (field of view), and the third (z axis) corresponds to the spectrum at each pixel location. Using the line scan imaging system, the images are stacked to form a three-sided matrix, where X define the spatial axis for the first frame, Z the spectral axis and Y the time axis corresponding to the spectra set for each frame (Fig. 3) .
The accuracy and reliability of the prediction of the protein content of a sample by this NIRS technique is totally dependent of the accuracy and reliability of the determination of the protein content on the classical way. In this case, one has to rely upon a good Kjeldahl analysis and digestibility technique.
The crude protein content of a feed sample represents the total nitrogen (N) in the diet. Samples were analyzed in duplicate. The total N present in a hay sample is first determined by Kjeldahl method 15. The total amount of protein is calculated by multiplying
the total N by a factor (forages factor is 6.25 because leaf and stem tissue).
The digestibility of the organic or dry matter was determined by the enzymic pepsin/cellulase method. This method, called “the in
vitro digestibility” 16, is nowadays well known and applied all
over the world. Cellulase is used for determination of the digestibility bythe method developed by De Boever et al. 16, 17. It is also known in the entire world as the “in vivo digestibility” method.
The in vivo method that was proposed by De Boever 17, but
with a shorter heating time at 80°C, was found to be more accurate than the in vitro (inoculums) procedure for predicting the digestibility of a diverse range of feeds; including cereals, by products and dried forages.
The digestibility principle was the incubation at 24 hours with the acid-pepsin at 40°C, heating the acid pepsin solution at 80°C for 45 min to remove starch; the final stage is the second incubation with cellulase at pH 4.5 for 24 hours after removal of the acid pepsin.
Results
The results for the calibration of the crude protein and the in vitro digestibility are in Table 2. Most components showed a wide range of values for both methods.
The crude protein content of the hay determined by classical method decreases from the type of meadow Agrostis capillaris L.
- Festuca rubra L. (15.22%) until to the pure sample of Arnica montana L. (11.19%). For the digestibility content, the highest
content was obtained in the pure sample of Arnica montana L. Figure 1. FOSS NIRSystems 6500 Silver Spring MD,
USA (CRA-W, 2011).
Conveyor belt NIR camera Light source
Figure 2. SWIR ImSpector N25E hyperspectral imaging system 14.
Figure 3. The plan scan imaging system 14.
Plane scan
imaging system Spectral
Line scan imaging system Spatial Spatial b Y Z a X Samples code LD567 (g) LD500 (g) A1 0.6093 1.4072 A2 0.4060 1.6299 A3 0.2030 1.8307 A4 0.1009 1.9038
Sample A1: Type of meadow Agrostis capillaris L - Festuca rubra L. with 40% of pure species Arnica montana L., Sample A2: Type of meadow Agrostis capillaris L. - Festuca rubra L. with 30% of pure species Arnica montana L. Sample A3: Type of meadow Agrostis capillaris L. - Festuca rubra L. with 20% of pure species Arnica montana L. Sample A4: Type of meadow Agrostis capillaris L. - Festuca rubra L. with 10% of pure species Arnica montana L.
Table 1. Artificial mixture of type of meadow Agrostic
capillaris L. - Festuca rubra L. (LD500)
of meadow hay with Arnica montana L. (LD567).
(84.13%) and the lowest one in sample from the type of meadow
Agrostis capillaris L. - Festuca rubra L. (57.18%) or in samples
with the participation of Arnica montana L.
From the results of the hyperspectral imaging system, it was possible to distinguish between the different grass species and concentration of species. A1, A2, A3 and A4 contain AM particles in four concentrations. That means that the clusters analyses are based on the difference ratios of AM in mixture grasses.
Discussion
This study shows that the differences of the protein values between classical method and non-destructive method are close for the samples A1 to A4, but for sample LD500 hay from type of meadow
Agrostis capillaris L. - Festuca rubra L. is a big difference.
The samples taken from Romania, Carpathian Apuseni Mountains, Grâda Area (Poienile Ursului) were used to validate the calibration model from CRA-W, Gembloux. Validation requires prediction of either an independent set of samples, i.e. from a different population than the calibration set, with known reference values, or removing a certain number of samples from the calibration set and not using them in the calibration process.
The NIRS calibrations were developed to estimate the CP and DMOrt from forage spectra, the NIRS models were set up with a modified partial least square (PLS) procedure, with cross validation, in WINISI® 1.50 software. The best predictive
model was obtained using the second derivative mode spectrum. The performance of the NIRS calibration equations was expressed in terms of coefficient of determination (R2 = 0.98 for CP and R2 = 0.96 for DMOrt),
standard error of calibration (SEC = 0.84 for CP and SEC = 3.01 for DMOrt) and standard error of cross validation (SECV = 0.84 for CP and SECV = 3.48 for DMOrt).
Several authorsreported about protein values in the early flowering phenophases stage 1, 18-25. The protein value is
between 10.10 -17.00% (Australia, 1990); 4.48-10.78% 21,
10.21-18.59% 21, 6.20-24.20% (Belgium: INRA, 2008), 13.00-
15.00% (France, 2002), 7.40-22.80% (Belgium: Ghent, 1999), 15.00-20.00% (Iowa, 2003), maximum 16% (Iowa, 2007), 8.80- 10.40% (Alps Mountain, 2007) and 5.50-16.4% (USA, 2003); for meadow plants, intermountain is give like 8.70% (Canada, 2009), but, especially in Romania, the protein value in the field of Carpathians Apuseni Mountains increases after organic and mineral fertilization from 9.11% to 15.03% 26. The values obtained in this study by classical
and NIR method are from 11.19% to 15.46% and it can be seen that the values are almost same like the values of other authors.
Regarding the digestibility, several authors relate that
Samples CP(%)-classic CP-NIRS(%) DMOrt(%)-classic DMOrt-NIRS(%)
LD500 15.22 13.56 53.13 57.18 A1 14.49 13.26 58.74 57.77 A2 14.56 13.60 58.19 59.93 A3 14.61 13.30 58.51 61.42 A4 15.46 14.35 57.74 60.52 LD567 11.19 11.12 84.13 71.97
Table 2. The crude protein content and the in vitro organic matter digestibility determined by classical and NIRS analysis.
Sample A1: Type of meadow Agrostis capillaris L - Festuca rubra L. with 40% of pure species Arnica montana L. Sample A2: Type of meadow Agrostis capillaris L. - Festuca rubra L. with 30% of pure species Arnica montana L. Sample A3: Type of meadow Agrostis capillaris L. - Festuca rubra L. with 20% of pure species Arnica montana L. Sample A4: Type of meadow Agrostis capillaris L. - Festuca rubra L. with 10% of pure species Arnica montana L.
the values of digestibility based on the De Boever method are different: the range between 47.70% and 85.20% 17, 44.60-68.50%27,
43.10-59.10% 28, 57-85.20% 29, 55.60-64.20%24, 28.20-76.50% 30,
64.70-92.30% 21, 64.20-86% 21 and 52.80-87.30% 21. Similarly, in a
review, it was reported 62.60-68.60%18 and 68-73% 1. The
digestibility value determined at Libramont laboratory of CRA-W for the samples from Romania are almost in the same range like these authors.
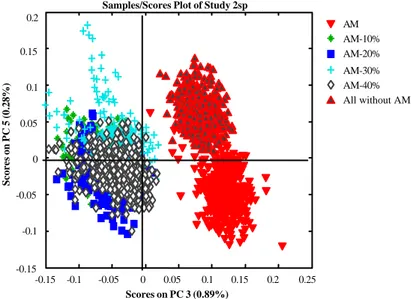
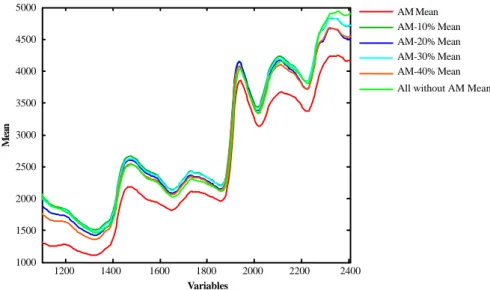
In Fig. 4, the score plot of PC3 versus PC5 is presented and showed five clusters. The respective clusters in the score plot could be associated with specific parts of the AM content in score image interactively. Fig. 5 shows the mean spectra for pure sample of Arnica montana L., mean spectra of mixed samples A1, A2, A3, A4 and mean spectra of the sample LD500 hay from type of meadow Agrostis capillaris L. - Festuca rubra L. without AM.
For the spectra interpretation of difference between crude protein content and digestibility of the artificial mixed samples, in Fig. 6 it is related spectra form. The three classes were extracted and analyzed together. One model was build with PLS-DA from the image of pure samples: Dark blue = Festuca rubra L., yellow =
Trifolium repens L., green = Agrostis capillaris L., red = Arnica montana L., dark green = Hieracium aurantiacum L., blue = small
p y p
Samples/Scores Plot of Study 2sp
0.2 Scores on PC 5 (0.28%) 0.15 Scores on PC 3 (0.89%) 0.1 0.05 0.25 0 -0.1 -0.05 -0.15 0.2 0.15 0.1 0.05 0 -0.1 -0.05 -0.15
Figure 4. Discrimination of AM concentration in mixed samples. The samples are:
All without AM, type of meadow Agrostis capillaris L. - Festuca rubra L. without the pure species Arnica montana L.; AM-40%, type of meadow Agrostis capillaris L. - Festuca rubra L. with 40% of pure species Arnica montana L.; AM-30%, type of meadow Agrostis capillaris L. - Festuca rubra L. with 30% of pure species Arnica
montana L., AM-20%, type of meadow Agrostis capillaris L. - Festuca rubra L.
with 20% of pure species Arnica montana L. and AM-10%, type of meadow Agrostis
capillaris L. - Festuca rubra L. with 10% of pure species Arnica montana L.; AM
stands for pure species Arnica montana L.
All without AM AM-40% AM AM-20% AM-30% AM-10%
Classes AM FR HR TR BKG Support AC Total AM 98.74 0.08 0.76 0.00 0.00 0.17 0.00 99.75 FR 0.00 76.09 0.09 0.00 0.00 0.00 21.92 98.10 HR 0.00 0.08 94.94 0.48 0.00 0.00 0.24 95.74 TR 0.00 0.00 1.31 95.56 0.00 0.00 1.22 98.09 BKG 0.00 0.00 0.04 0.00 99.72 0.25 0.00 100.00 Support 0.00 0.00 0.00 3.94 0.00 91.00 4.23 99.17 AC 0.00 0.00 0.00 0.00 0.00 0.00 92.92 92.92 Total 98.74 76.28 97.03 103.13 99.72 91.44 118.71 98.09
Table 3. Confusion matrix for the PLS-DA model of discrimination of pure samples.
HR: Hieracium aurantiacum L.; FR: Festuca rubra L.; TR: Trifolium repens L.; AC: Agrostis capillaris L.; AM: Arnica montana L.; BKG: Background; Support: Small ring cup.
Mean Variables 5000 4500 4000 3500 3000 2500 2000 1500 2000 2200 1800 1600 1400 1000 1200 2400 AM Mean AM-10% Mean AM-20% Mean AM-30% Mean AM-40% Mean All without AM Mean
Figure 5. Typical spectra for different AM content in mixed samples. The samples are: All without AM,
type of meadow Agrostis capillaris L. - Festuca rubra L. without the pure species Arnica montana L.; AM-40%, type of meadow Agrostis capillaris L. - Festuca rubra L. with 40% of pure species Arnica
montana L.; AM-30%, type of meadow Agrostis capillaris L. - Festuca rubra L. with 30% of pure
species Arnica montana L., AM-20%, type of meadow Agrostis capillaris L. - Festuca rubra L. with 20% of pure species Arnica montana L. and AM-10%, type of meadow Agrostis capillaris L. - Festuca
rubra L. with 10% of pure species Arnica montana L.; AM stands for pure species Arnica montana L.
ring cup and pink = background. The confusion matrix for this model is presented in Table 3.
From the different pre-process evaluated, standard normal variate (SVN) and first derivative 15 2 1 points was the most efficient pre- processing.
The PLS-DA was used to determine whether it was possible to discriminate between the classes and to build a model that could be used to predict future images. The potential of using NIR hyperspectral imaging to distinguish between pure species was also confirmed on a line-scan system in binary and ternary mixtures
(5b)
(b) (a)
Figure 6. Calibration and predicted image in different binary (a) and ternary
(b) mixture samples for different pure samples.
(Fig. 6a-b). It can be seen in Fig. 6a the image of pure samples scanned with the line-scan system. The pure samples are distinguished correctly and, from the confusion matrix, we can see the correct predictions. Fig. 6b relates that it is possible to distinguish pure samples of AM between other samples and pure samples as well as between binary and ternary mixtures of pure samples. More than 99% correct prediction for AM was obtained.
Conclusions
The results of the present study show that the crude protein and of the in vitro digestibility can be predicted by the classical NIRS. It is normal to find differences between the results obtained by classical method and NIRS method because the conventional NIR model used did not contain the pure variety Arnica montana L., only hay from Apuseni Mountains. In comparison with other authors, the field, the soil, the fertilization and the climate are not the same, and of course the region is different.
For the PLS-DA models, with the observed classes could be use the method proposed in this paper as a real potential for the future classification of botanical composition. The advantage of NIR hyperspectral imaging compared with the existent commercial NIRS is speed of analysis and measurements of a line-scan of thousand of spectra/25 s.
References
1Collins, M. and Fritz, J. O. 2003. Forages. In Barnes, R. F. (ed.). An
Introduction to Grassland Agriculture. 6th edn. Blackwell Publishing
Professional, Iowa.
2EMEA 1999. Arnica montana L. The European Agency for the
Evaluation of Medical Products, Veterinary Medicines Evaluation Unit, Summary Report.
3Reif, A., Brinkmann, K., Goia, A., Hoernstein, H., Jaeckle, S., Mohr, B.
et al. 2008. Differences of development patterns in Central and Eastern
European mountain regions: History of land uses and landscapes in the Southern Black Forest (Germany) and the Central Apuseni Mountains (Romania). Bulletin UASVM, Agriculture 65(1).
4Carlier, L., Van Waes, C., Rotar, I., Valhova, M. and Vidican, R. 2009.
Forage quality evaluation. Bulletin of University of Agricultural Sciences and Veterinary Medicine Cluj Napoca, Agriculture 66(1):216- 230.
5Hill, N. S., Kissel, D. E., Heusne, G. L., Sonon, L. S., Saha, U. K.,
Lawton, S. et al. 2010. Common terms used in animal feeding and nutrition. University of Georgia Cooperative Extension and Ft. Valley State 1367:1-20.
6Carlier, L., Puia, I. and Rotar, I. 1998. For a Better Grass Production.
Risoprint, Cluj-Napoca, pp. 129-131.
7Berardo, N. 1997. Prediction of the chemical composition of white
clover by near-infrared reflectance spectroscopy. Grass Forage Science 52:27-32.
8Park, R., Agnew, R., Gordon, F. and Steen, R. 1998. The use of Near
Infrared Reflectance Spectroscopy (NIRS) on undried samples of grass silage to predict chemical composition and digestibility parameters. Animal Feed Science Technology 72:155-167.
9Paul, C. and Hausler, A. 2002. Developing the NIRS harvest line concept
for forage trials. Grasslans Science Euro. 7:464-465.
10Ruano Ramos, A., García Ciudad, A. and García Criado, B. 1999.
Determination of nitrogen and ash contents in total herbage and botanical components of grassland systems with near infrared spectroscopy. Journal of Science Food Agriculture 79:137-143.
11Fernández Pierna, J. A., Baeten, V. and Dardenne, P. 2006. Screening of
compound feeds using NIR hyperspectral data. Chemometrics and Intelligent Laboratory Systems 84(1-2):114-118.
12Schut, A., Van der Heijden, G., Hoving, I., Stienezen, M., Van Evert, F.,
and Meleman, J. 2006. Imaging spectroscopy for on-farm measurement of grassland yield and quality. Agronomy Journal 98(5):1318-1325.
13FOSS Analytical 2005. Cyclotec 1093 sample mill complete with sample
bottles (125 ml) with snap-on lid (2) screens 0.5 and 1.0 mm, allen keys 4 and 6 mm seal for grinding chamber, paper bag for dust collection, seal for sample bottle, 200-230 v, 50 hz. Users’ Manual, PN 9999 0730E, (2 gb).
14Vermeulen, P., Fernández Pierna, J. A., Burger, J., Tossens, A., Dardenne,
P. and Baeten, V. 2010. NIR hyperspectral imaging and chemometrics as a lab tool for the quality control of agricultural products. In Chemometrics in Analytical Chemistry (CAC 2010). Antwerp, Belgium.
15Association of Official Analytical Chemists (AOAC) 1990. Methods
of Analysis. 15th edn. Washington DC.
16De Boever, J., Cottyn, B.G., Buysse, F.X., Wainman, F.W. and Vanacker,
J.M. 1986. The use of an enzymatic technique to predict digestibility, metabolisable and net energy of compound feedstuffs for ruminants. Animal Feed Science and Technology 14:203-214.
17De Boever, J., Cottyn, B., Andries, J., Buysse, F. X. and Vanacker, J.
1988. The use of a cellulase technique to predict digestibility, metabolizable and net energy of forages. Animal Feed Science and Technology 19(3):247-260.
18Minson, D. J. 1990. Forage in Ruminant Nutrition. Academic Press,
San Diego, Sydney, Australia, 483 p.
19Jean Blain, C. 2002. Introduction a la nutrition des animaux domestiques.
Technique et Documentation, Paris.
20Moore, J. E., Adesogan, A. T., Coleman, S. W. and Undersander, D. J.
2007. Predicting forage quality. In Barnes, R. F., Nelson, J. C., Moore, K. J. and Collins, M. (eds). Forages: The Science of Grassland Agriculture. Vol II. 6th edn. Blackwell Publishing, Ames, IA, pp. 553-
568.
21Decruyenaere, V., Lecomte, P., Demarquilly, C., Aufrere, J., Dardenne,
P., Stilmant, D. et al. 2008. Evaluation of green forage intake and digestibility in ruminants using Near Infrared Reflectance Spectroscopy (NIRS): Developing a global calibration. Animal Feed Science and Technology 148:138-156.
22Guide Pratique 2007. Alimentation des bovins, ovins et caprins, besoins
des animaux: Valeurs des aliments, tables INRA. Editions Quae, Versailles, Paris, France.
23De Boever, J., Cottyn, B., De Brabander, D., Vancker, J. and Boucque,
C. 1999. Equations to predict digestibility and energy value of grass silages, maize silages, grass hays, compound feeds and raw materials for cattle. Nutrition Abstracts and Reviews 69:835-850.
24Stuth, J., Jama, A. and Tolleson, D. 2003. Direct and indirect means of
predicting forage quality through Near Infrared Reflectance Spectroscopy. Field Crops Research 84:45-56.
24Gillespie, J. R. and Flanders, F. B. 2009. Modern Livestock and Poultry
Production. 8th edn. Delmar, Cengage Learning, Canada, USA. 26Păcurar, F. 2005. Cercetări privind dezvoltarea sustenabilă (durabilă) a
satului Gheţari, comuna Gârda prin îmbunătăţirea pajiştilor naturale şi a unor culturi agricole. PhD Thesis. Cluj Napoca.
27Walshaw, J., Mathison, G. W., Fenton, T., Sedgwick, G., Hsu, H.,
Recinos Díaz, G. et al. 1998. Characterization of forages by differential scanning calorimetry and prediction of their chemical composition and nutritive value. Animal Feed Science Technology 71:309-323.
28Iantcheva, N., Steingass, H., Todorov, N. and Pavlov, D. 1999. A
comparison of in vitro rumen fluid and enzymatic methods to predict digestibility and energy value of grass and alfalfa hay. Animal Feed Science and Technology 81:333-344.
29Vidican, R., Rotar, I. and Sima, N. 2000. Tehnica NIRS (Near Infrared
Reflectance Spectroscopy) si aplicaţiile sale în analiza calităţii furajelor. Symposium “Agriultura si Alimentaţia”.
30Gosselink, J., Dulphy, J., Poncet, C., Jailler, M., Tamminga, S. and
Cone, J. 2004. Prediction of forage digestibility in ruminants using in
situ and in vitro techniques. Animal Feed Science and Technology
115(3):227-246.
31Norris, K. H., Barnes, R. F., Moore, J. E. and Shenk, J. S. 1976.
Predicting forage quality by infrared reflectance spectroscopy. J. Animal Sci. 43:889-897.
Acknowledgements
We thank the CRA-W Gembloux and CRA-W Libramont for providing technical advice on the NIR instrument, PN II IDEI 1485, contract no. 1099 unfolded by CNCSIS, Andre Thewis for technical advice in chemical analysis and POSDRU/6/1.5/S/20 (PhD Program).