UNIVERSITÉ DU QUEBEC À MONTRÉAL
NETWORK FRAMEWORKS FOR TACKLING ECOLOGICAL AND EVOLUTIONARYPROBLEMS
DISSERTATION PRESENTED
AS PARTIALREQUIREMENT OF THE DOCTORA TE OF BIOLOGY
BY
MEHDI LA YEGHIF ARD
UNIVERSITÉ DU QUÉBEC À MONTRÉAL SeNice des bibliothèques
Avertissement
La diffusion de cette thèse se fait dans le respect des droits de son auteur, qui a signé le formulaire Autorisation de reproduire et de diffuser un travail de recherche de cycles supérieurs (SDU-522 - Rév.01-2006). Cette autorisation stipule que «conformément à l'article 11 du Règlement no 8 des études de cycles supérieurs, [l'auteur] concède à l'Université du Québec à Montréal une licence non exclusive d'utilisation et de publication de la totalité ou d'une partie importante de [son] travail de recherche pour des fins pédagogiques et non commerciales. Plus précisément, [l'auteur] autorise l'Université du Québec à Montréal à reproduire, diffuser, prêter, distribuer ou vendre des copies de [son] travail de recherche à des fins non commerciales sur quelque support que ce soit, y compris l'Internet. Cette licence et cette autorisation n'entraînent pas une renonciation de [la] part [de l'auteur] à [ses] droits moraux ni à [ses] droits de propriété intellectuelle. Sauf entente contraire, [l'auteur] conserve la liberté de diffuser et de commercialiser ou non ce travail dont [il] possède un exemplaire.»
UNIVERSITÉ DU QUEBEC À MONTRÉAL
DES ANALYSES DE RÉSEAU POUR RÉSOUDRE DES PROBLÈMES EN ÉCOLOGIE ET ÉVOLUTION
THÈSE PRÉSENTÉE
COMME EXIGENCE PARTIELLE DUDOCTORATEN BIOLOGIE
PAR
MEHDI LA YEGHIF ARD
ACKNOWLEDGEMENTS
Foremost, I would like to express my sincere gratitude to my advisors Dr. Pedro R. Peres-Neto and Prof. Vladimir Makarenkov for the continuous support of my Ph.D. study and research, for their patience, motivation, enthusiasm, and immense knowledge. Their guidance helped me in ail the time of research and writing of this thesis. I cannot imagine a more inspiring and enjoyable environment in which to work. 1 would also like to thank my !ab-mates, whose companionship and support made coming into work fun: Bailey Jacobson, Renato Henriques da Silva, Alix Boe, Frédéric Boivin, Shubha Pandit, Who-Seung Lee, Andrew Smith, Dunarel Badescu, Marie-Hélène Greffard, Marie-Christine Bellemare and Wagner Moreira. Finally, I would like to thank Razi, the love of my life, and family and friends for their support and encouragement.
This thesis was funded by the FQRNT (Fonds de Recherche sur la Nature et les Technologies du Québec) team research grant to V. Makarenkov and P. Peres-Neto and an FQRNT PhD grant to M. Layeghifard.
TABLE OF CONTENTS LIST OF FIGURES ... viii LIST OF TABLES ... .x RESUMÉ ... xi ABS1RACT ... xii INTRODUCTION ... 1 0.1 Background ... 1 0.2 Phylogenetic networks ... 4 0.3 Ecological networks ... ." ... 7 0.4 Biogeography ... 8 0.5 Metacommunity ... 10 0.6 Thesis outline ... Il CHAPTER I INFERRING EXPLICIT WEIGHTED CONSENSUS NETWORKS TO REPRESENT ALTERNATIVEEVOLUTIONARYHISTORIES ... 13
1.1 Summary ... 13
1.2 Introduction ... 14
1.3 Methods ... 19
1.3.1 Basicconcepts ... 19
1.3 .3 Method description: consensus network ... 25
1.3 .4 Inferring elus ter weights ... 31
1.3 .5 Assessing the efficiency of the new method ... 32
1.4 Results ... 35
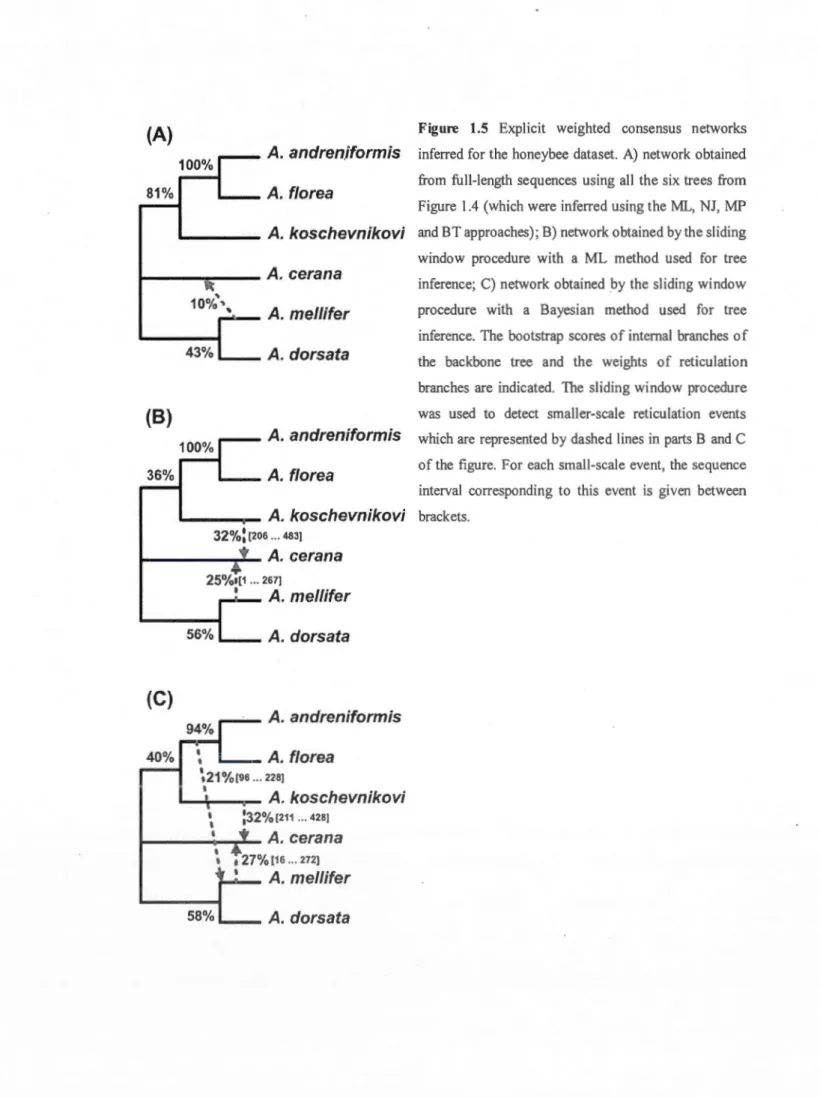
1.4.1 First example: Honeybee data ... 35
1.4.2 Second example: Chloroplast data ... 38
1.4.3 Third example: Archaebacteria data ... 41
1.4.4 Simulation results ... 44
1.4.5 Searching for intragenic recombination and partial horizontal gene transfer events in real data ... 45
1.5 Discussion ... 53
CHAPTER II USING DIRECTED PHYLOGENETIC NETWORKS TO RETRACE SPECIES DISPERSAL HIS TOR Y ... 59
2.1 Summary ... 59
2.2 Introduction ... 60
2.3 Methods ... 62
2.3 .1 Biogeographie data and study area ... 62
2.3 .2 Defming geographical units ... 62
2.3 .3 Directional species dispersal networks ... 65
2.3 .4 Exploring the relationship between dispersal his tory and species attributes ... 69
2.5 Discussion ... 75
CHAPTER III
SPATIAL NETWORKS FOR INFERRING DISPERSAL IN ECOLOGICAL
COMMUNITIES ... 81
3.1 Summary ... , ... 81
3.2 Introduction ... 82
3.3 Methods ... 84
3.3 .1 Step 1: Building the spatial tree ... 86
3.3.2 Step 2: Building the metacommunity network ... 90
3.3.3 Building dispersal predictors ... 91
3.3.4 Assessing the performance ofMSSN via simulations ... 93
3.3.5 Assessing the performance ofMSSN on real datasets ... 96
3.4 Results ... 97
3.4.1 Simulated data ... 97
3.4.2 Real ecological data ... 97
3.5 Discussion ... .' ... 102 CHAPTER IV A CONNECTIVITY MEASURE FOR METACOMMUNITY NETWORKS ... 106
4.1 Summary ... : ... 106 4.2 Introduction ... 107
4.3 Methods ... 109 4.3.1 Background ... 109 4.3 .2 Methodology ... 111
4.4 Results ... 118 4.5 Discussion ... 122 CONCLUSIONS ... 125 ALGORITHM ! ... 128 ALGORITHM II ... 130 ALGORITHM III ... 131 APPENDIXA
CALCULATION OF WEIGHTS FOR THE EDGES OF SPATIAL
NETWORK ... 132 APPENDIX B
FINDING THE DISPERSAL DIRECTION OF NEWL Y ADDED EDGES ... 143
REFERENCES ... 145
~---Figure 1.1 1.2 1.3
LIST OF FIGURES
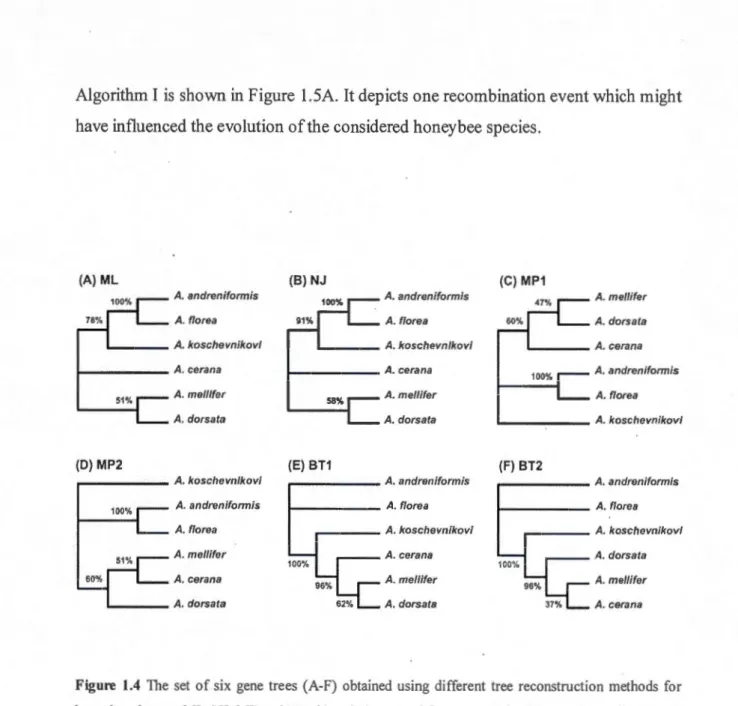
Bootstrap-based consensus trees and networks ... .. Flowchart of the new method for building weighted consensus networks .. . Building explicit weighted consensus phylogenetic networks ... . 1.4 The set of six gene trees (A-F) obtained using different tree
Page 23 28 30
reconstruction methods for honeybee dataset... 36
1.5
1.6 1.7 1.8 1.9
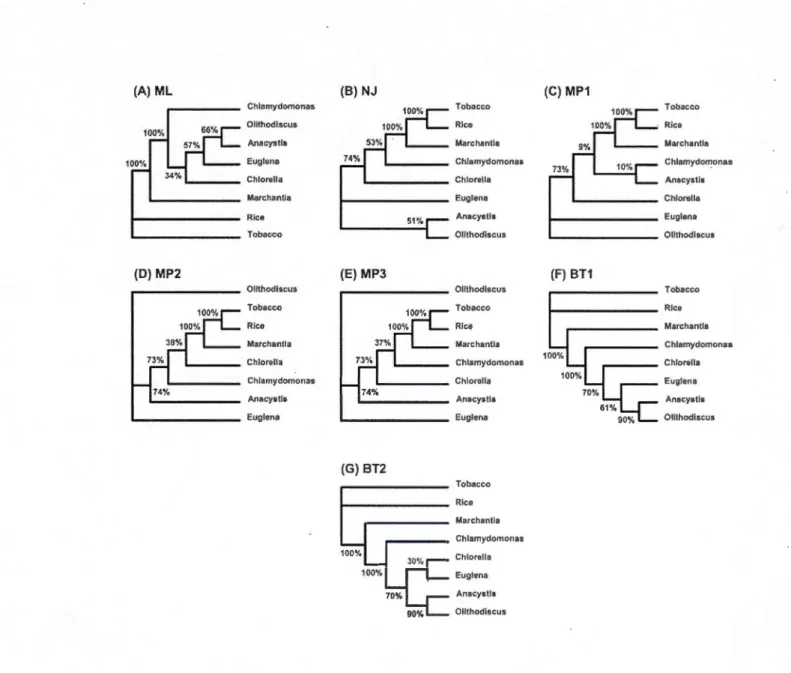
Explicit weighted consensus networks inferred for the honeybee dataset. .. The set of seven gene trees (A-G) inferred for the chloroplast dataset ... .
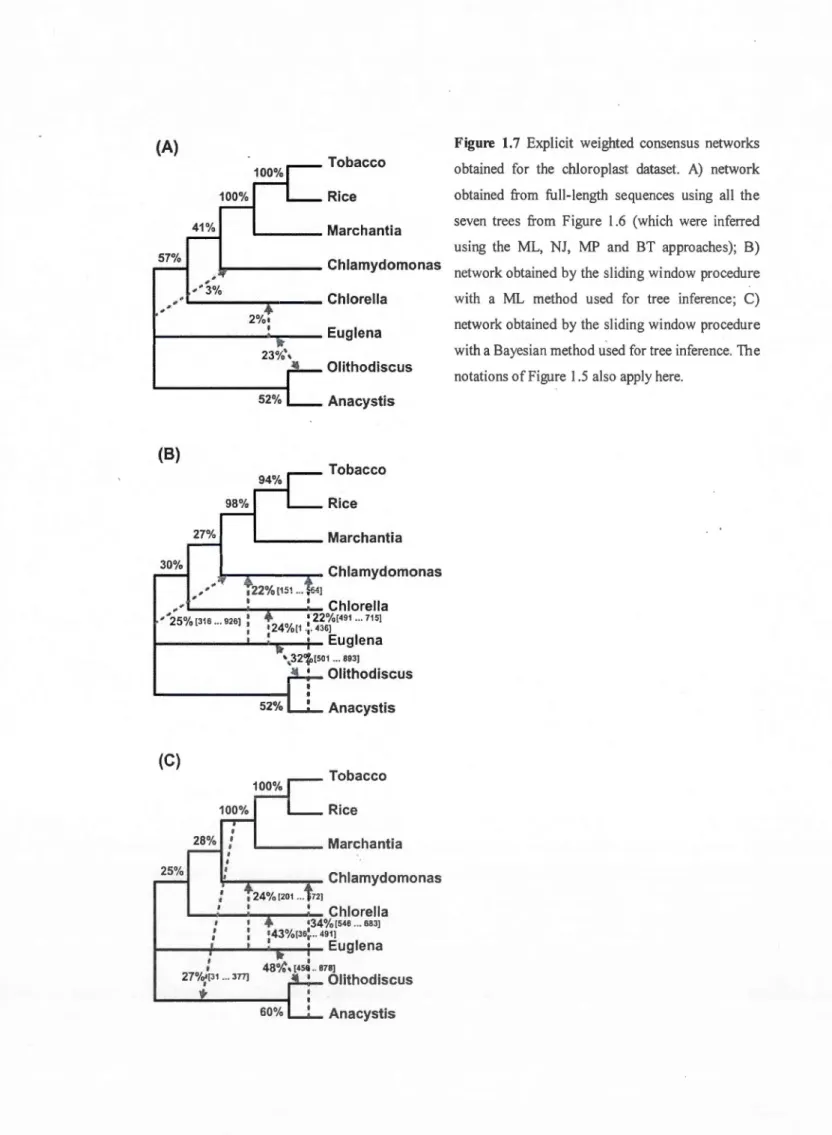
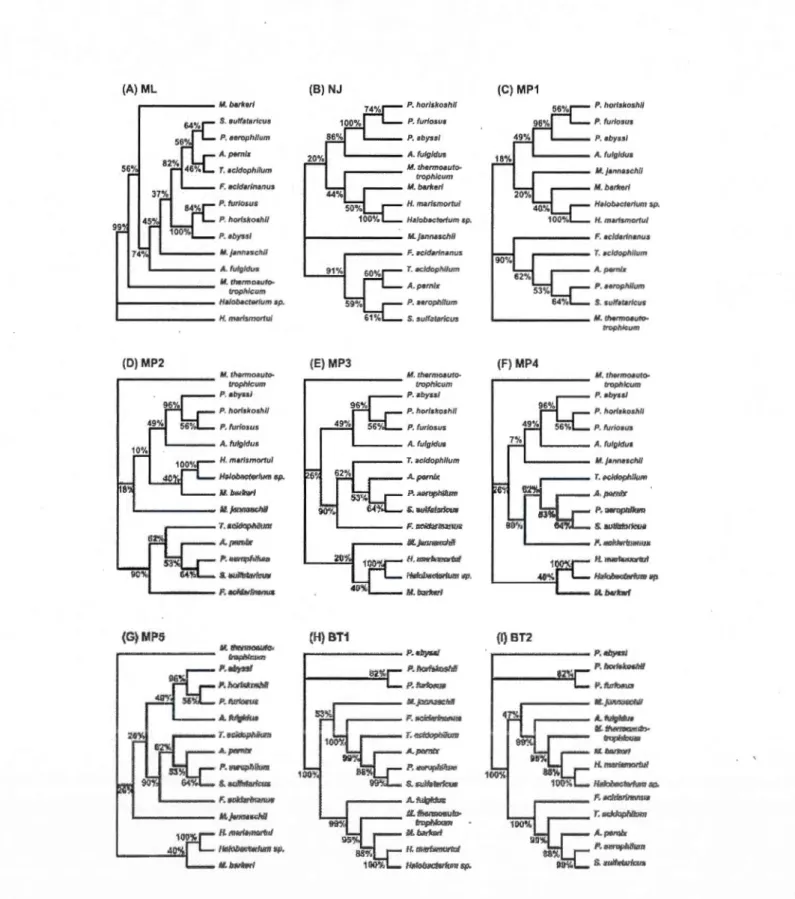
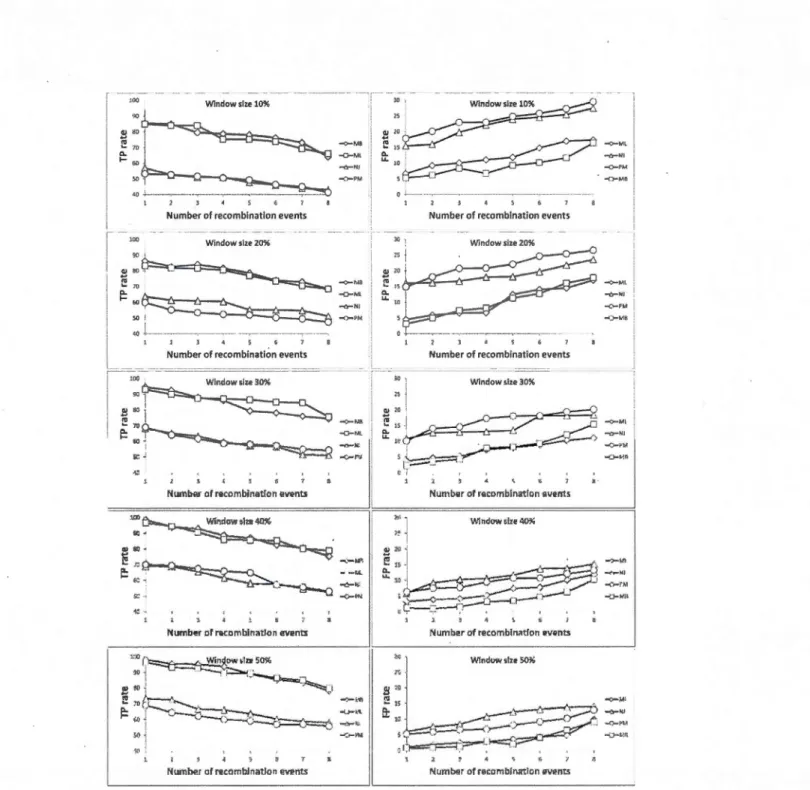
Explicit weighted consensus networks obtained for the chloroplast dataset. The set ofnine gene trees (A-1) inferred for the Archaebacteria dataset ... Explicit weighted consensus horizontal gene transfer networks inferred for the Archaebacteria datas et. ... . 1.10 Average true-positive (left-hand panel) and false-positive (right-hand
panel) rates provided by the weighted consensus network reconstruction method depending on the number of recombination events. in the simulated
37
39
40
42
43
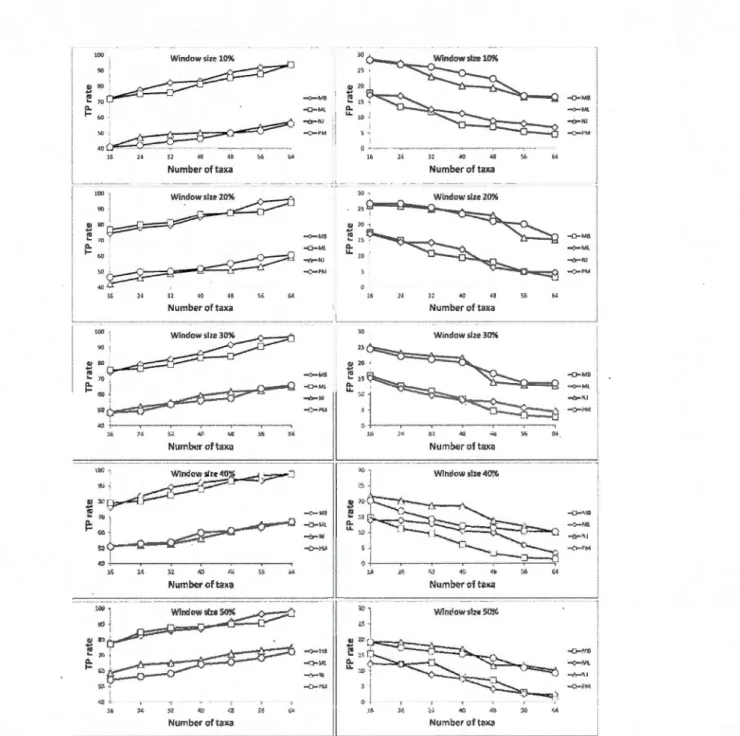
data and the tree inference method used... 46 1.11 Average true-positive (left-hand panel) and false-positive (right-hand
panel) rates provided by the weighted consensus network reconstruction method depend ing on the number of taxa in the simulated data and the
tree inference method used.. .... .. .. .. .. .. .. .. .. .. .. .. .. ... .. ... .. .. ... ... 47 1.12 Alternative network representations of the honeybee dataset... ... 50
1.13 Alternative network representations of the chloroplast dataset. ... :... 51 1.14 Alternative network representations of the Archaebacteria datas et... 52
2.1 Biogeographie history of postglacial dispersal of Ontario fïshes
represented as a dispersal network... 64
2.2 Schematic representation of the directional species dispersal network
building process based on an artifïcial data set... 66
2.3 3.1
Comparison between phylogenetic tree and dispersal pattern tree ... .. A simple representation oftwo mathematical graphs or networks ... .
73 87
3.2 Diagrammatic summary of the steps involved in our spatial network method ... . 3.3 Adjusted R2 values for simulated landscapes with 0, 10 and 20% changes by our spatial network method (SNM) and MEM method ... . 3.4 Type I error (range = 0) and power (range from 1 to 30) measured as
proportion ofrejections (alpha=0.05) per 500 tests ... . 3.5 Contrast between MSSN and MEM methods on the basis of adjusted
R2 values obtained from real ecological data sets (72 fish
lX
88
98
99
metacommunttJes)... .. ... ... . .. ... .. . .. . . . .. .. ... . . .. . . ... . . .. . . .. . . ... 100 3.6 Bubble plot maps for lakes oftwo fish metacommunities (watersheds)
representing their levels of COimectivity with the other lakes within
watersheds. .. . .. .. . .... .. . . .. . . . ... .. . . .. . .. .. . . ... .. . . .. . . .. .. ... 101 4.1 A simple example of a metacommunity represented as a network.
Numbered circles are local communities and the !ines connecting the
circles are the representations of species dispersal... Ill 4.2 A diagrammatic representation of the steps involved in our g
raph-theoretical connectivity measure methodology... .. . .. . . .. . . ... . .. . . 113 4.3 Correlation results between our metric and closeness centrality
measures for regular networks... .. . .. 119 4.4 Correlation results between our metric and closeness centrality
measures for random networks... .. . . .. . . 120 4.3 Correlation results between our metric and closeness centrality
measures for exponential networks ... . 4.3 Correlation resu1ts between our metric and closeness centrality
measures for scale-free networks ... . 8.1 Finding the dispersal direction of newly added edges ... .
120
121 144
LIST OF TABLES
201 Terminology adopted in this article to draw parallels between the HGT (horiwntal gene transfer) detection and DSDN (directional species
dispersal network) methods 0 0 0 0 0 0 0 0 0 0 0 0 0 0 0 0 0 0 0 0 0 0 0 0 0 0 0 0 0 0 0 0 0 0 0 0 0 0 0 0 0 0 0 0 0 0 0 0 0 0 0 0 0 . . 0 68 202 . Nu li mode! results (Z-score and probability values) for the Ontario fish
RESUMÉ
Notre vision de l'écologie et de l'évolution a beaucoup changé au cours des dernières décennies due aux découvertes des mécanismes complexes gouvernant les différents aspects de la vie, des cellules, aux populations, aux espèces et encore, aux communautés et métacommunautés. Par contre, l'analyse de ces phénomènes complexes nécessite le développement de nouveaux concepts de même que de nouveaux outils informatiques rapides et fiables. Un de ces nouveaux concepts, la théorie des graphes, gagne rapidement en popularité dans les domaines de l'écologie et de l'évolution grâce à des avancées théoriques et infonnatiques. L'objectif principal de ce doctorat est de développer un cadre d'étude basé sur la théorie des graphes afin de résoudre des problèmes possédant des caractéristiques de réseaux en écologie et en évolution (p. ex., évolution réticulée ou connectivité spatiale entre des communautés). Dans cette thèse, quatre problèmes différents sont abordés. Bien que les entités biologiques diffèrent entre les problèmes (variant des espèces aux communautés), ceux-ci peuvent tous être approchés par des approches de réseaux similaires. Ces quatre problèmes (un par chapitre) représentent chacun une contribution originale dans l'application méthodologique des réseaux : 1) construire des réseaux phylogénétiques consensus à partir de données contenant des signaux évolutifs contradictoires ; 2) retracer l'historique de dispersion des espèces ; 3) explorer l'hétérogénéité spatiale des metacommunautés ; et 4) mesurer la connectivité dans des réseaux de métacommunautés. Les résultats obtenus de l'application de ces méthodologies sur des données empiriques et/ou simulées démontrent que la complexité inhérente à plusieurs problèmes en écologie et en évolution peut être explorée et résolue à l'aide d'approches basées sur la théorie des graphes. Ainsi, la théorie des graphes, un outil flexible et robuste pour l'analyse de problèmes complexes, a un grand potentiel pour améliorer notre compréhension des systèmes en écologie et en évolution.
ABSlRACT
Our vision of ecology and evolutionary biology has changed significantly during the past few decades due to the discovery of a plethora of complex mechanisms goveming the various aspects of !ife, from cells to populations to species to even more complex ecological entities (communities and metacommunities). However, the analysis and exploration of such complex problems needs new concepts, as weil as reliable as faster computational tools. One of the relatively new and increasingly popular concepts in ecological and evolutionary biology studies is graph theory owing to the recent advances in computer technology. The main objective of this doctoral thesis is to develop frameworks based on graph theory to tackle complex ecological and evolutionary biology problems involving network characteristics ( e.g., reticulated evolution, spatial connectivity across ecological communities). ln this thesis, I have chosen four different problems involving ecological and evolutionary networks. The biological entities are different (from species to ecological communities) but they can be ali tackled by related network approaches. These problems were tackled by four chapters that represent each novel network applications: 1) building consensus phylogenetic networks from datasets containing conflicting evolutionary signais, 2) retracing dispersal history of species, 3) exploring the spatial heterogeneity of metacommunities, and 4) measuring the connectivity of metacommunity networks. The results obtained from the application of these methodologies on real and/or simulated datasets showed that the inherent complexity of many ecological and evolutionary biology problems can be successfully explored, explained and resolved by using graph-theoretical approaches. Network theory has the potential to significantly improve our understanding of ecological systems and evolution because it is a flexible and robust tool to tackle most problems in these fields.
INTRODUCTION
0.1 Background
One of the outstanding characteristics of biological systems (ecological and evolutionary) is that they are complex in both structure and ftmctions due to their dynamic nature, compositional variability and their ability to reproduce and self-organize. In the ecological context, one of the main factors contributing to this biological complexity is species interacting with one another and with their surrounding environment. For example, we have just started to understand the relationship between humans and their intestinal bacterial and archaeal flora, which involves many interactions and regulations between the host and symbiont genes (Gill et al., 2006). On the other hand, the recent advances in molecular biology and high-throughput analyses have dramatically changed our vision of evolutionary biology. There are numero us mechanisms con tribu ting to the complexity of molecular biology, such as alternative splicing, post-translational modifications and the presence of micro RNAs and interference RNAs, just to name a few examples. These mechanisms are also likely to play an important role in molecular evolution, thus contributing to its complexity.
The interactions between the components of complex biological systems can be well represented as networks. For example, metabolic networks of biochemical reactions (Karp et al., 2005; Ravas.z et al., 2002); protein-protein interaction networks of the physical interactions between proteins (Giot et al., 2003; Li et al., 2004); and the transcriptional (or gene) regulatory networks of the regulatory interactions between various genes (Ihmels et al., 2002; Salgado et al., 2006; Shen-Orr et al., 2002) are among the most well-known biological networks. The above-mentioned biological networks have numerous potential applications within the fields of Biology and
2
Medicine, such as determining the evolution and functions of the unknown pro teins or genes, identifying potential drug targets, unravelling complex biochemical regulatory . pathways, and understanding the range and mechanisms of infectious diseases outbreaks (Eubank et al., 2004; Jeong et al., 2003; Samanta and Liang, 2003).
In fact, networks exist at all scales ofbiological organization, from single cells to large metacommunities and, traditionally, graph theory is the frrst choice and the most capable tool to investigate such complex networks. Interestingly, many initial efforts to model biological systems involved the use of random graphs (Barabasi and Albert, 1999). However, it is too simplistic to think of real networks (i.e., as opposed to artificial or anthropogenic networks such as social networks on the internet) behind such diverse complex systems as random graphs. lfthese biological networks are not random, then we need to develop tools, measures and frameworks to study and analyze their organization, characteristics and behaviour. Fortunately, the recent technological ad van ces in computer sciences have led to a dramatic growth in the use of graph theory to investigate biological networks.
In this thesis, however, the focus is on two particular types of biological networks: ecological networks and phylogenetic networks. The main goal here is to take advantage of the exceptional potentials of graph theory and computer science as weil as available data in arder to design and develop novel efficient computational tools and frameworks for tackling sorne of the complex issues in the fields of ecology and evolutionary biology. Moreover, by using problems from these two fields, one is able to observe how different problems often converge to somewhat similar solutions.
Based on these premises, four different ecological and evolutionary biology questions have been chosen to be addressed using graph-theoretical approaches. These problems included 1) resolving gene tree discordancy and detecting unorthodox evolutionary pathways (e.g., horizontal gene transfers, recombination events); 2) retracing species dispersal history; 3) detecting spatial variability in metacommunities; and 4) estimating
-3
the connectivity of b~ological networks. In common, they share the 'transfer' as a common theme; the trans fer of genes among species and the trans fer of species among large biogeographie zones and small local ecological communities. The reason for selecting these four seemingly unrelated problems was to showcase the potential and the versatility ofnetwork theory in solving complex biological issues across the fields of ecolo gy and evolutionary biology. With the rise of network applications in medicine, social sciences and computer sciences, among others, it seems inevitable for ecologists and evolutionary biologists to take network thinking more seriously (May, 2006) . . Following the advances in other fields and mainly to keep pace with advances in life sciences and information technologies, we must be on track to design and develop similar tools to tackle the large-scale data problems we face now. In arder to understand, organize, madel and study large-scale data we need tools far more powerful and complex than classic methods. Moreover, because different ecological and evolutionary problems often require similar computational solutions, my attempt here is also to demonstrate the flexibility of the network based approaches developed in this thesis. This flexibility is particularly useful in the age of data revolution where having access to multi-purpose tools will save us time and money.
Networks are excellent tools to represent many features and processes of ecological and evolutionary systems. Specifically, their incomparable value becomes apparent in cases where the problem in volves large datasets in arder to reveal patterns behind sm ali and large-scale ecological and evolutionary proc ss s (Proulx et al., 2005). Moreo er, the need to move away from a purely reductionist approach in favour of an integrative, systems-oriented approach has been recently promoted by many researchers (see Masan and Verwoerd, 2007 for a review). Since ail biological systems are, indeed, sets
of interacting components, the application of network theory becomes a p.atural way to tackle scientific questions within such complex systems. Therefore, this thesis is aimed
at contributing to the graph-theoretical toolbox of ecologists and evolutionary
biologists and promoting the application of network theory (i.e., network thinking) in
---4
these fields.
In the following sections, brief descriptions of ecological and phylogenetic networks are given. In addition, some of the foundational concepts underlying the four chapters of the thesis are presented. Finally, at the end of the Introduction section an outline of the main four chapters of this thesis is provided.
0.2 Phylogenetic networks
One of the main goals of evolutionary biology is to reconstruct phylogenetic trees which accurately represent the evolutionary history of a group of species. In phylogenetic trees, each leafrepresents an existing species, white the internai vertices correspond to hypothetical ancestors, and edges (also called branches) show the relationships between ancestors and their descendants.
Vast progress in the field of molecular biology in the last few decades has profoundly changed the nature of the datasets used in ph y logenetic analysis. Initially, the only available data for building evolutionary trees were morphological characters, but nowadays, biological sequence data (nucleotide or amino acid sequences) are mostly used to infer the history of !ife. These data sets are produced with the aid of efficient DNA and protein sequencing technologies and the comprehensive computer-based analysis of the results. These data are maintained in huge freely available and publicly accessible databases such as GenBank and EMBL among others. Given that the amount of data available in these databases are growing exponentially, it is vital to analyze these data in a fast, efficient, and accurate manner in order to make use oftheir results to tackle both theoretical and applied questions in evolutionary biology and ecological and societal contemporary problems.
5
In phylogenetics, this means that algorithms and applications have to be developed with the aim of analyzing and modelling the diverse and complex processes that have occurred during the evolution of any given set of current species. So far, many efforts have been made to develop efficient methods in order to reconstruct ph y logenies that best represent the evolutionary history for different sets of taxa. Sin ce evolution just occurred once in the past, there is no direct observational or experin1ental study that may be used in phylogenetic reconstruction. Moreover, the fossil record is often incomplete and ambiguous. Therefore, evolutionary biologists have to mostly rely upon mathematical and statistical models for analyzing the sequence data of existing species in order to infer phylogenetic trees and understand past events that led to speciation and other evolutionary patterns (Wiens, 2009).
Essentially, there are three types of methods for ph y logenetic tree reconstruction: ( 1) distance-based methods like UPGMA (unweighted pair group method with arithmetic mean) and neighbor-joining, (2) parsimony-based methods like maximum parsimony, and (3) statistical-based methods like maximum likelihood and the closely related Bayesian method. A detailed description of ph y logeny reconstruction methods can be found in Felsenstein (2004).
Phylogenetic networks are a generalization of evolutionary trees that make possible the simultaneous visualization of severa! conflicting or alternating histories of life. In a phylogenetic network, each conflicting or alternative history event is usually represented as an extra bran ch (or a link between two species or clades invo lved in the event) added to the phylogenetic tree. Thus, these extra branches or links (also called reticulation events) convert a simple phylogenetic tree, which at best can only represents one dominant hypothesis, to a phylogenetic network which can represent multiple conflicting or alternative historical hypotheses. Indeed, there are severa! types of events that lead to histories that are not adequately modelled by a single tree (Huson and Bryant, 2006; Legendre and Makarenkov, 2002): (1) horizontal gene transfer in
-6
bacterial evolution; (2) hybridization between species, including allopolyploidy in plants; (3) micro-evolution of local populations within a species, involving genetic differentiation ofallopatric populations, gene exchange through migration, or both; (4) homoplasy, the portion of phylogenetic similarity resulting from evolutionary convergence (e.g., parallel evolution and reversais), which cari be represented by reticulation branches added to a phylogenetic tree; and non-phylogenetic situations, such as (5) host-parasite relationships involving host transfer and (6) vicariance and dispersal biogeography.
Even if the relationships between species are tree-like, phenomena like sampling error, parallel evolution, or mode! heterogeneity can also generate difficulties in representing evolution by a single tree (Gascuel, 2005). Generally speaking, there exist two fundamental types of phylogenetic networks, namely: (1) explicit networks that provide a concrete scenario of reticulate evolution and (2) implicit networks that are intended to represent incompatible signais in a data set (see Figure 3 in Huson and Bryant, 2006). An explicit network is generally depicted as a phylogenetic tree with additional edges. The internai nod es in such a network represent ancestral species, and nades with more than two parents correspond to reticulate events such as hybridization or recombination. Explicit networks mode! non-tree-like evolution and their purpose is to point out which lineages have undergone reticulation events. Implicit approaches, on the other band, are often based on split networks which represent ail splits contained in a set of gene trees. Each parallelogram of the resulting network corresponds to two incompatible splits. To be able .to accommodate incompatible splits, it is often necessary that a split network contains nades that do not represent ancestral species. Th us, split networks provide only an "implicit" representation of evolutionary history. Phylogenetic networks will be discussed in detail in Chapters I and II.
7
In ecology, the components (i.e., biotic and abiotic objects or entities) that construct a system show varying degrees of interactions. These interactions can be represented as an ecological network in which the components are indicated as nodes (i.e., vertices in graph terminology) and the interactions are depicted as links between the nodes (i.e., edges in graph terminology). These interactions, among other types, can be trophic, competitive, symbiotic, social and geographie connectivity. Ecological networks are very useful models to describe, analyze and compare the structure of ecological systems. For example, they are often used to investigate the effects ofnetwork structure (i.e., topology) on the properties of ecological systems such as their stability (Dunne et al., 2002).
Traditionally, ecological networks were frrst developed and used to model trophic relationships within food webs (Lindeman, 1942; Odum, 1965). Food webs are important components of every ecological system due to the feeding is essential for organisms' survival. In food webs organisms are connected directly through feeding. Networks have been used to mode! food webs, explore their stability and determine if
certain network properties result in more stable networks (MacArthur, 1955). Given that the local extinction of a species within a given ecological system may result in an unstable food web, network analysis have been used to determine how removal of species do influence food webs as a whole (Dunne et al., 2002).
Another type of ecological network is species interaction networks which consist of pairwise interactions between individuals of one or more species. Network analysis of species interactions allows quantifying the associations between individuals and inferring details about the network as a whole. Moreover, the power and flexibility of network approaches allow for the study of various types of interactions ( e.g., social, competitive, predatory, cooperative and mutualistic interactions) using the same general approach. As such, ecological networks are useful in analyzing numerous
8
complex interactions within most ecologie al systems (Krause et al., 2009; Ryder et al., 2008).
Additional applications of ecological networks include exploring complex interactions at the multi-species levels in terms of both species dispersion and coevolution of pairs of species. In this thesis, network models were developed to study metacommunities, which are particularly complex given their relative large geographie extent, their heterogeneous landscapes and their multi-species composition. Since metacommunities involve large scale problems, there is no direct observational or experimental study that may be used to understand sorne of the processes (e.g., dispersal history) underlying their structure. These applications are further discussed in Chapters II, III and IV.
0.4 Biogeography
Historical biogeography studies show how ecological processes that happen over long periods of time influence the distributional patterns of living organisms (Cox and Moore, 1993). Conversely, studying the same processes acting in short periods oftime is called ecological biogeography. Biogeography as a whole is a multidisciplinary science with a long history. Indeed, the study of plant and animal distributions has a his tory as long as bio lo gy itself.
It is accepted that the scientific theory ofbiogeography likely grew out of the work o:f Alfred Russel Wallace (1823-1913) and other early evolutionary scientists. Wallace studied the distribution of flora and fauna of the Malay Archipelago in the 19th century. One of the interesting subjects in historical biogeography has been the study of the effects of Pleistocene glaciations on the distribution of living organisms. However, sorne authors place this subject between ecological and historical biogeography,
9
because the processes involved acted for only several thousand years which 1s not considered a long period oftime in geography (Myers and Giller, 1988).
The aim ofbiogeography is to reveal where species live, why, and at what abundances through the study of the distribution of biodiversity over space and time (Martiny et al., 2006). One of the most impressive features of our planet is the sheer diversity of organisms it contains, and one of the main problems facing scientists is how to explain this diversity, and the reas ons for the varying patterns of occurrence of different species over the surface of the planet or in particular large landscapes. Moreover, biogeography is about seeking general rules that can account for distributional patterns and provide a general framework to generate insights that can subsequently be used for predictions about the consequences ofupcoming phenomena.
Patterns of species distributions can be usually explained through a combination of historical factors such as speciation, extinction, continental drift, glaciation (and associated variations in sea level, river routes, among other factors), and river capture, in combination with the area and isolation of landmasses (geographie constraints) and available resources. All these factors are the results of the interaction between two great natural phenomena: evolution and plate tectonics. Although, nowadays, biogeography is an independent discipline with a core of accepted knowledge and methodological princip les, it is also an adjunct whose status is contingent on other areas of study such as ecology, evolution, taxonomy, molecular systematics, geography, geology, and palaeontology. For instance, phylogenetic networks in which the relations between regions within a landscape are represented by branches could be used to explore the hypothesis that multiple dispersal routes were used by a particular species of interest to migrate from one region to another. The application of network theory on biogeography is the focus of Chapter II.
10
0.5 Metacommunity
In ecology, a community is a group of populations of two or more different species occupying the same geographical area. Community ecology is primarily concerned with patterns of species distributions, abundance and interactions across different spatial and temporal scales. As an extension, an ecological metacommunity is consisted of a set of local interacting communities that are interconnected through dispersal (Leibold et al., 2004).
Metacommunities have been defmed and studied based on four major perspectives: 1) patch dynamics; 2) species sorting; 3) source-sink dynamics (or mass effect); and 4) neutra! model. These four theoretical frameworks were developed in order to explore specifie processes underlying community patterns. Patch dynamics models are mainly used to describe species composition among multiple habitat patches, such as islands. The focus in patch dynamics is on the possible coexistence due to competition-dispersal, competition-colonization or dispersal-fecundity trade-offs. Conversely, species sorting models try to link the variation in abundance and composition within the metacommunity to similar and differentiai responses of the species to environmental heterogeneity. Source-sink models, on the other hand, are based on the assumption that dispersal and environmental heterogeneity interact to determine local and regional ab un dance and composition. Finally, in the neutra! framework species are considered essentially equi aient in their competitive and dispersal abilities. Therefore, stochastic demographie processes and dispersal limitation are the primary factors determining the local and regional composition and abundance (Leibold et al., 2004). Spatial heterogeneity and connectivity ofmetacommunities will be further investigated using networks in Chapter III and Chapter IV, respectively.
11
0.6 Thesis outline
This thesis is comprised of the following four chapters:
Chapter I
Chapter II
Chapter III
Chapter IV
Inferring explicit weighted consensus networks to represent alternative evo lutionary histories
Using directed phylogenetic networks to retrace specres dispersal history
Spatial networks for inferring dispersal rn ecological
communities
A novel connectivity measure for metacomrmmity networks
Chapter I emphasizes the application of networks in evolutionary biology and phylogenetics. It is comprised of a novel weighted explicit method to construct consensus phylogenetic networks. Moreover, this method is capable of detecting different reticulation events such complete horizontal gene transfers, partial horizontal gene transfers, recombination and hybridizations. This method was also successfully tested and assessed by both empirical and sirnulated datasets. Chapter II is prirnarily concemed with the application ofnetworks in biogeography. Specifically, it includes a new network methodology that is developed to retrace species dispersal history. This new method was successfully applied on an empirical dataset in arder to reconstruct th historical dispersal e ents that occurred when fish species left southem refugia to recolonize the northem Ontario province after the last glaciation period. Chapter III focuses on the use of network theory to investigate the spatial heterogeneity within large multi-species ecological systems. In this chapter, a novel graph-theoretical method was developed to capture and explore the spatial variation within metacommunities. This new method was successfully tested on both empirical and sirnulated datasets. Finally, Chapter IV investigates the application of graph theory in detecting connectivity in metacommunities. In this chapter, a new connectivity
12
measure was developed to be specially applied on metacommunities. This connectivity measure was successfully tested on simulated datasets.
- - - - -- - -- - -
-CHAPTER 1
INFERRING EXPLICIT WEIGHTED CONSENSUS NETWORKS TO REPRESENT ALTERNATIVE EVOLUTIONAR Y HISTORIES
Mehdi Layeghifard, Pedro R. Peres-Neto and Vladimir Makarenkov Published in BMC Evolutionary Biology.
1.1 Summary
The advent of molecular biology techniques and constant increase in availability of genetic material have triggered the development of many phylogenetic tree inference methods. However, severa! reticulate evolution processes, such as horizontal gene transfer and hybridization, have been shawn to blur the species evolutionary history by causing discordance among ph y Jo genies inferred from different genes. To tackle this problem, we hereby describe a new method for inferring and representing alternative (reticulate) evolutionary histories of species as an explicit weighted consensus network which can be constructed from a collection of gene trees with or without prior knowledge of the species phylogeny. We provide a way of building a weighted phylogenetic network for each of the following reticulation mechanisms: diploid hybridization, intragenic recombination and complete or partial horizontal gene transfer. We successfully tested our method on sorne synthetic and real datasets to infer the above-mentioned evolutionary events which may have influenced the evolution of many species. Our weighted consensus network inference method allows one to infer, visualize and validate statistically major conflicting signais induced by the mechanisms of reticulate evolution. The results provided by the new method can be used to represent
the inferred conflicting signais by means of explicit and easy-to-interpret phylogenetic networks.
1.2 Introduction
Molecular data have played an instrumental, and usually indispensable, role in many ph y logenetic and evolutionary studies in the recent decades. The ir in creas ing availability is due to outstanding advances in the development of fast, efficient and affordable sequencing technologies (Pettersson et al., 2009). Although this growth has triggered the advancements of theoretical informatics aspects of phylogenetics and evolutionary biology via the development of new algorithms, statistical models and software, fast and effective analytical methods have yet to be designed to take advantage of this huge surplus of data. For instance, the field of phylogenetics still faces sorne key analytical challenges stemming from reticulate evolution. They include: 1) horizontal' gene transfer (e.g., in bacterial or viral evolution); 2) hybridization among species (e.g., allopolyploidy in plants); 3) genetic differentiation of allopatric populations and gene exchange through migration; 4) homoplasy (i.e., parallel evolution and reversais); 5) incomplete lineage sorting; and 6) recombination between genes (Huson and Bryant, 2006; Huson et al., 2010; Legendre and Makarenkov, 2002; Posada and Crandall, 2001). Ali these processes may lead to the incongruity among gene trees (Giribet et al., 2001; Grechko, 2013; Mason-Gamer and Kellogg, 1996; Rokas et al., 2003; Zou and Ge, 2008) inferred from the data affected by reticulate evolutionary mechanisms. Implicit or explicit phylogenetic networks should be used to represent these complex phenomena when the gene tree incongruity is observed (Huson et al., 2010; Makarenkov and Legendre, 2004). Implicit networks are better suited for a general representation of conflicting evolutionary signais present in the data, whereas explicit networks are used for depicting the precise reticulation
events, including their directionality and the species involved. The inference and validation of explicit phylogenetic networks is the main goal of the current study.
Another key factor that con tribu tes to the incompatibility among gene trees is stochastic errors resulting from analytical features such as choice of optimality criterion, taxon sampling and seqtlence evolution mode! (Graybeal, 1998; Huelsenbeck, 1995; Yang et al., 1994). These complications not only makes it difficult for researchers to fmd reliable estirnates of the true species phylogenies, but also obstruct such fields as comparative biology and community phylogenetics which rely on phylogenetic trees in their analyses (Harvey and Pagel, 1991; Peres-Neto, 2012; Webb, 2002).
Evidence from many studies conducted on different groups of species, from fruit flies to hominids (Burbrink and Pyron, 2011; Carstens and Knowles, 2007; Ebersberger et al., 2007; Grechko, 2013; Jennings and Edwards, 2005; Pollard et al., 2006; Sanchez -Gracia and Castresana, 2012; Syring et al., 2007; Takahashi et al., 2001), have shawn that gene tree discordance is a widespread phenomenon. These studies mostly concluded that rarely a predominate or consistent single-gene-based phylogeny could be perceived or reconstructed for a moderate to large set of species, regard Jess of the typeofphylogenetic data at hand. Among the traditional tree-like techniques developed to solve the gene tree incongruence problem there are two widely used approaches of
gene concatenation and consensus tree reconstruction, both of which result in the inference of a single phylogenetic tree as the most probable representation of the evolutionary history of species.
Although, there have been successful cases of using the concatenation approach to elucidate the ancestral relationships among certain groups of species (Baldauf et al.,
2000; Chen and Li, 2001; More ira et al., 2000; Soltis et al., 1999), multi-gene datasets
very rarely converge to the same phylogeny, more often providing results which are contradictory or inconsistent with well-known and highly reliable species tree (Giribet
et al., 2001; Hwang et al., 2001; Mossel and Vigoda, 2005; Naylor and Brown, 1998).
These statistical inconsistencies in estirnating phylogenetic trees using concatenated
datasets have been confmned by simulation studies (Kolaczkowski and Thomton,
2004; Kubatko and Degnan, 2007).
The main idea behind traditional consensus tree reconstruction methods is that each of
the phylogenetic trees from a given collection oftrees should contribute to a consensus
tree according to the presence of its clusters. Among the most known and widely used
consensus tree reconstruction methods are the majority rule consensus (Margush and McMorris, 1981) and Nelson (often called Nelson-Page) consensus approaches (Nelson, 1979; Page, 1989). The traditional strict majority rule consensus tree includes
all the clusters that occur in more than 50% of the considered trees. The major pitfall
of this method is that for a set of trees with a po or overall bootstrap support, the 50% cluster occurrence constraint leads to a very weakly resolved phylogeny. On the other
hand, in the extended majority rule consensus tree approach, a strict consensus tree is
first constructed and then the remaining compatible clusters are added to it following their overall frequency in the considered tree collection. For the collections of trees with a poor overall bootstrap support, the constraint of 50% used when inferring the majority rule and extended majority rule consensus trees can be often inconvenient.
Many existing software allow for clusters that are present in less than 50% of the trees. They work downwards in the frequency of the cluster occurrences as long as the new
clusters aid to resolve the consensus tree. The extended majority rule consensus method often provides solutions sirnilar to those of the Nelson consensus method, although not
necessarily identical to them (Nelson, 1979; Page, 1989). The Nelson consensus method, first described in (Nelson, 1979) and then generalized in (Page, 1989), relies
on the graph theory techniques to fmd maximum cliques of mutually compatible clusters. Its major drawback is that these cliques do not always contain enough compatible clusters to constitute a fully resolved phylogenetic tree (Bryant, 2003).
Moreover, the problem of fmding a maximum clique of compatible clusters has been shown to be NP-hard (Abello et al., 1999).
Phylogenetic networks should be used instead of consensus species trees or species trees inferred from concatenated sequences whenever reticulate evolutionary processes are studied (Huson et al., 2010; Legendre and Makarenkov, 2002; Makarenkov and Legendre, 2004). Here, we recall sorne of the existing ph y logenetic network building methods and software based on the cluster support. In an early attempt to build consensus phylogenetic networks, Holland et al. (2004) developed an irnplicit consensus network mo del based on the median network method (Bandelt et al., 1999) to visualize incompatibilities encompassed in the given collection oftrees. This method proceeds frrst by ranking all the splits according to their frequency and then builds a system of compatible splits by adding those splits to the network, one at a time, following their frequency ranking. Holland and colleagues (Holland et al., 2006)
further optirnized their original greedy consensus network method to incorporate weights from individual trees into the network inference process. Having the length of each split (i.e., branch length of the split branches) in different trees as well as the weights associated with those trees, this method computes an average length for each split and fmally selects compatible splits based on their weights to build a consensus network.
In another attempt, Huson (1998) and then Huson and Bryant (2006) have developed a
computer program called SplitsTree which reconstructs an unrooted splits graph from
a collection ofphylogenetic trees through selecting all the splits that are present in more than a ftxed percentage of all the trees (Holland et al., 2004). However this pro gram provides as result only implicit network structures; the inferred extra links do not usually directly correspond to the tree lineages and the number of nodes and edges of the resulting network can grow exponentially with the number of splits. To address
build a phylogenetic network from a collection of gene trees using a modified tree popping algorithm which they called network popping algorithm. To estimate the support of any reticulation edge, the average support of th at edge ( computed over ail trees) is divided by the average support of the alternative reticulation edges located at the same position and weighted by the average support of ali other tree edges (Huson and Rupp, 2008; Huson et al., 201 0). The latter authors stated however that no association between clusters and reticulation edges is provided by this method. For instance, the obtained cluster support was not shown in their network representations (Huson and Rupp, 2008). On the other hand, Abby et al. (201 0) proposed a horizontal gene transfer inference method called Prunier. Prunier needs a species tree and a gene tree as a reference and does not treat multiple gene trees. Prunier relies on a ranking of branches that are common to the species and gene trees based on the amount of conflicts that is reduced when the branch is removed. This amount of conflicts is a function that depends on the statistical support of the interna! branches of the gene tree. For a detailed review of the existing phylogenetic network reconstruction methods the reader is referred to (Huson et al., 201 0). Note that the results yielded by most of the existing consensus network building methods are implicit and generally not easy to interpret.
In this study, we present a new algorithm for the inference of explicit weighted consensus networks from a collection oftrees (e.g., multiple single-gene phylogenies), ith or ithout prior kno ledge of th sp ci s phylog ny. Such networks are capable of representing the main historical pattern of the species evolution (i.e., associated with the clusters present in the species tree) as well as the alternative evolutionary routes characterizing the species and genes under consideration. The main advantage of our method is that it allows for visualizing the species evolutionary relationships in a very clear and easy-to-interpret manner. Our algorithm takes advantage of the weights ( e.g., !east-square scores, posterior probabilities, maximum likelihood scores or p-values) assigned to the gene trees as well as the weights associated with the tree clusters ( e.g.,
cluster's bootstrap score or posterior probability) to infer the species dominant and alternative evolutionary histories. If a species tree is provided in addition to the collection of gene trees, our algorithm cons id ers it as the dominant evolutionary his tory (i.e., backbone structure) and uses the collection of gene trees to infer the most significant reticulation events. If only a collection of gene trees is given, the new algorithm frrst builds a weighted consensus tree as the main evolutionary pattern and then infers the most significant alternative events.
The rest of the article is organized as follows. In the Methods section, a description of the basic concepts of phylogenetic networks and a detailed presentation of our new algorithm are given, followed by the description of the simulation protocol and the three considered real datasets. In the Results section, the results and performances of the new algorithm obtained for both simulated and real data are reported. They are then discussed in detail in the fmal section ofthe article.
1.3 Methods
1.3 .1 Basic concepts
1.3 .1.1 Graph
A graph G (V, E) consists of a collection of vertices (V) which are connected by a collection of edges (E) in a pairwise manner. A path in a graph is a sequence of at least
two vertices (v1, v2, ... , Vk) such that, for alli E{1, 2, ... , k-1}, there exists an edge {v;,
V;+J} in E. A cycle in a graph is a path whose first and last vertices are the same, wh ile
1.3.1.2 Phylogenetic tree
A phylogenetic tree (1) is an acyclic connected graph whose leaves (i.e., vertices of
degree one) are labelled according to the given set oftaxa (i.e., species). Phylogenetic trees can be either bifurcating (i.e., ail the interna! nades have an indegree of one and an outdegree of two) or multifurcating (i.e., interna! no des can have an outdegree of
three and more). Phylogenetic trees can be rooted or unrooted, where the root is a node representing a co mm on ancestor of ail the species invo Ived in the analysis.
1.3 .1.3 Phylogenetic network
A phylogenetic network is a connected graph used either to visualize evolutionary
relationships between species or to display conflicting evolutionary signais without such limitations as being acy clic or having a flxed indegree or outdegree of its nades.
Phylogenetic networks can be implicit or explicit: irnplicit networks such as split
graphs are used to represent conflicting and ambiguous signais in a dataset using
parallel sets of edges, rather than single branches. These networks often con tain nades
that are not representing any ancestral species, hence providing only an implicit
representation of evolutionary histories (Huson and Bryant, 2006). In explicit
networks, in contrast, the interna! nodes represent ancestral species and nodes with
more than two parents correspond to reticulation events such as hybridization,
recombination or horizontal gene transfer. Such networks provide an explicit
representation of evolutionary history of species (see Huson et al., 2010 for more details). Here, we will frrst defme sorne basic princip les of the weighted consensus tree
1.3 .1.4 Bootstrap-based majority rule consensus tree
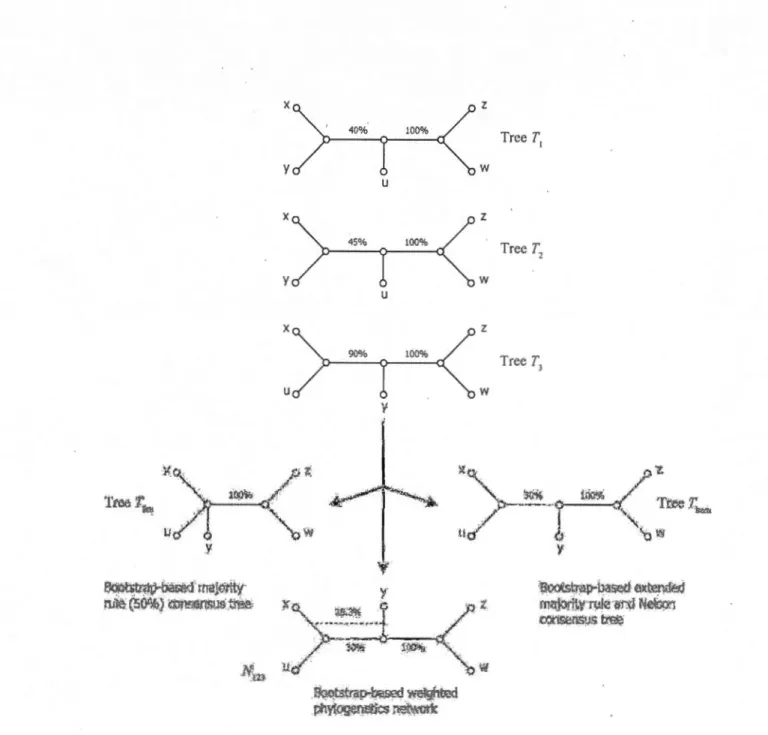
The main idea of our approach is that each phylogenetic tree from a given collection of trees should con tribu te to a consensus tree not sim ply by the presence, but also by the quality of its clusters (i.e., bipartitions or splits corresponding to the internai tree branches). The quality of a cluster within a given collection of trees can be defmed as the sum of bootstrap scores, taken over ali the trees in this collection, of the internai branches associated with ·this cluster. The traditional majority rule consensus tree in eludes only the clusters that exist in more than 50% of the considered trees (Margush and McMorris, 1981). Note that any other percentage between 50% and 100% can be also specified in most of the existing phylogenetic packages (e.g., in PHYLIP; Felsenstein, 1989). The bootstrap-based majority rule consensus tree will include any cluster whose average bootstrap support, i.e., total sum ofbootstrap scores, computed over ali the trees in the collection, divided by the number oftrees in this collection, is greater than 50% (e.g., tree Tbm in Figure 1.1 is the bootstrap-based majority rule
consensus tree, as weil as the strict majority rule consensus tree, oftrees T1, T2 and T3).
It is easy to prove that ail the clusters satis:fying such a rule will be pairwise compatible. For this, it will be sufficient to substitute each tree of the original tree collection by the set of its bootstrap repli ca tes (i.e., rep licated trees built wh en carrying out the bootstrap procedure) and then apply the traditional strict majority rule method on this extended set of replicated trees. Ali the clusters appearing in more than 50% of the replicated
trees will be mutually compatible.
1.3 .1. 5 Bootstrap-based extended majority rule consensus tree
Similar to the traditional extended majority rule method, as implemented in the CONSENS program ofthe PHYLIP package (Felsenstein, 1989), the bootstrap-based extended majority rule method is a two-stage procedure. First, any cluster whose
average bootstrap score is greater than 50% will be included in the consensus tree. Then, the method will consider the remaining clusters following the order oftheir total sums of bootstrap scores, computed over ail the trees in the collection, and gradually add to the consensus tree tho se that are compatible with the current consensus tree un til the tree is fully resolved or no more compatible clusters remains. For instance, tree Tbem in Figure 1.1 is the extended bootstrap-based majority rule consensus tree of trees TI,
T2 and TJ.
1.3.1.6 Bootstrap-based Nelson consensus tree
We also consider the following extension of the traditional Nelson method. To build the bootstrap-based Nelson consensus tree each clique will be assigned a score equal to the sum of scores of clusters included in it. The score of each cluster is defmed as a sum ofbootstrap scores associated with this cluster, computed over the given collection of trees. Unlike the method described by Page (1989), where only the replicated clusters can contribute to the clique scores, our procedure also takes into account the scores of ali unreplicated clusters. If a single clique with the highest total bootstrap score is found, the group of compatible clusters included in this clique will define the bootstrap-based Nelson consensus tree. lfthere exist more than one such clique, then the bootstrap-based Nelson consensus tree will contain only the clusters found in ali of the maximal replication cliques. In this case, clust rs found in som , but not ali, of the maximal-replication cliques can be classified as "ambiguous" (for more details see Felsenstein, 1989; Page, 1989; Swofford, 1991). In sorne cases, the bootstrap-based extended majority tree and Nelson consensus tree will be identical ( e.g., tree Tbem in Figure 1.1 is also the Nelson consensus tree oftrees TI, T2 and TJ), but this equivalence does not hold in general.
l{
CJ.
~
.
··
. . . ,w/
-
o
y ~~t:."?.P..oo~ ma~r;ty n.i~ (50%.} ~;r;ll'(1!\ls W.&\, x y x y x u u u \! .~tstrn~ wc.,'lg_hood p!'iyf®,~i~c.s r~t.,r..'Ork z w z w z w Trec T 1 Trec T 2 Tree T 3 :~XfS\:r<ltrlH~ o!\Ji.Wl?~ fnf'J..'1riWwk! ·(ji-:d N&..,g!j C!'..A.'k~l".tipS~Figure 1.1 Bootstrap-based consensus trees and networks. Bootstrap-based majorityrule consensus tree Tbm, bootstrap-based extended majority rule consensus tree Them and weighted implicit phylogenetic network Nm for a collection of three binary phylogenetic trees
r,,
T2 and T3 who se leaves are labelled by the set of 5 taxa (x, y, z, w and u). The bootstrap scores of the internai branches oftrees T1, T2 and T3 ar~ indicated. AJI the trees have the same weight.In Figure 1.1, a set ofthree trees is presented (Tt, T2 and T3), each of them containing two internai branches with the associated bootstrap scores. The right-hand internai bran ch ( connecting Ieaves "z" and "w" to the rest of the tree) has bootstrap support of
100% in all three trees. Therefore, it should be included in all consensus trees, or networks, regardless of the reconstruction method usèd. On the other hand, the left-hand internai bran ch connecting leaves "x" and "y" to the rest of the tree in Tt and T2 has different bootstrap scores in these trees (40 and 45% respectively). In tree T3, the left-hand internai bran ch connects leaves "x" and "u" to the rest of the tree. Its bootstrap
score, 90%, is higher than the sum of bootstrap scores of the corresponding bran ch in
Tt and T2. When using the bootstrap-based majority rule defmed above, we obtain a consensus tree (Tbm in Figure 1.1) th at do es not in elude the left-hand internai bran ch because neither the sum of scores of T1 and T2 nor the bootstrap score of T3 divided by the number of trees is greater than 50%. The application of the bootstrap-based
extended majority rule adds to the consensus tree (tree Tbem in Figure 1.1) the left-handed branch oftree T3, since 90% 1 3 = 30% > (40% + 45%) 1 3 = 28.3%. Tree Tbem
is also the bootstrap-based Nelson consensus tree of T1, T2 and TJ. Finally, the construction of the bootstrap-based consensus network (Nm in Figure 1.1) relies on the same principle as the bootstrap-based extended majority rule, except that it encompasses both left-hand internai branches (that from T1 and T2 and that from T3) characterized by their bootstrap support. Network Nm is an irnplicit consensus network. In this article we will show how such an irnplicit network can be transforrned
into explicit one depending on the evolutionary mechanism being studied.
1.3.2 Method description: consensus tree
The method we present and appiy here also takes into consideration the weights associated with the given phylogenetic trees in addition to bootstrap scores of the tree clusters (i.e., internai branches). Using one of the three equations presented in the
section "lnferring weights", the method defmes a weight of each cluster based on the weights of the trees containing this cluster and on the cluster' s bootstrap scores in these trees. Then, after ranking ail the clusters based on their weights, it regroups the
compatible clusters starting from the top of the list, until a fuily resolved consensus tree is built. This method is cailed here weight-based extended majority rule consensus tree inference.
1.3 .3 Method description: consensus network
Our consensus network inference method accepts two types of input: 1) a species phylogenetic tree and a set of gene phylogenetic trees defmed on the same set of
species, or 2) only a set of gene trees defmed on the same set of species. In phy logenetic studies, gene trees are usually characterized by their weights that reflect the quality of the reconstruction process. Such weights could be an average ofbootstrap scores of the tree's internai branches, a maximum parsimony or maximum likelihood score or a Bayesian posterior probability estimate. Thus, we assume that ail the phylogenies have bootstrap scores or posterior probabilities (or any other measure of support) for the ir
internai branches. Our algorithm frrst, breaks down ail the gene phylogenies into their
relevant clusters and calculates a weight for each cluster based on Equations 1.1, 1.2 or 1.3 presented in the foilowing section. Next, the algorithm ranks ali the clusters
based on their weights. For this typ of input, our algorithm u es the species tree as the
backbone of the network and graduaily adds to it the highly ranked clusters (i.e.,
represented by reticulation branches) of the gene phylogenies. For the frrst type of
input, the species tree is accepted as the dominant evolutionary history and the clusters of the gene trees are used to infer the reticulate (alternative) evolutionary events. For the second type of input, our algorithm reconstructs a consensus phylogenetic tree
using the weight-based extended majority rule consensus tree method described above
presented as reticulation branches. In the obtained consensus network, the weight -based consensus tree and .the reticulation branches can be regarded as the main and alternative evolutionary scenarios, respectively.
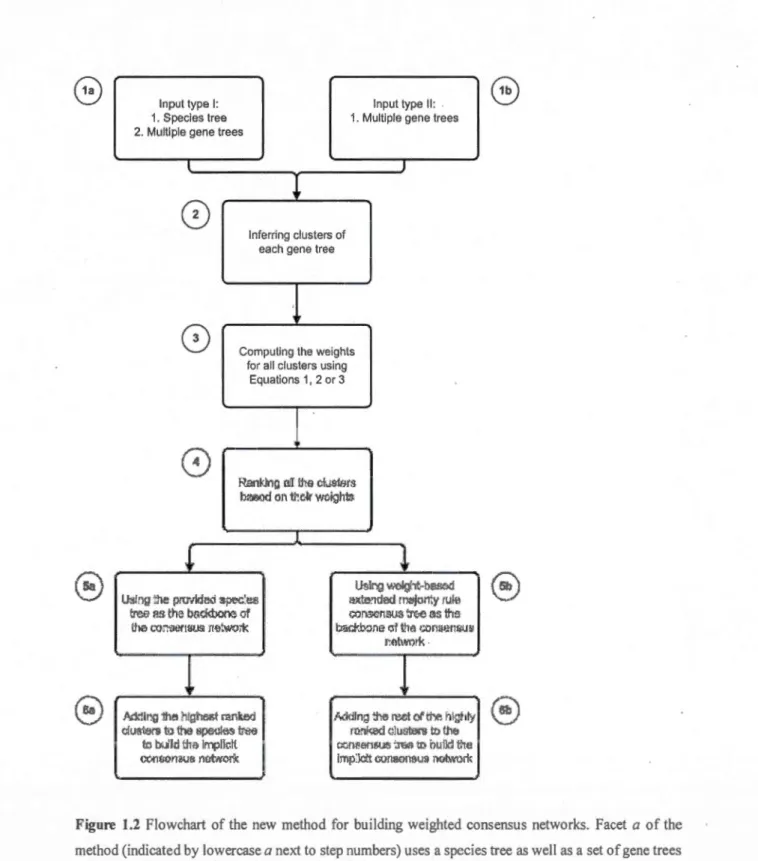
Regardless of the input type, the resulting representation is a weighted consensus phylogenetic network with a backbone tree structure and reticulation branches being chosen based on their weights which reflect the ir contribution to the clustering process. These two algorithmic facets are sch~matically presented in Figure 1.2, in which the steps depicted by letter a correspond to processing the frrst type of input and those depicted by letter b are related to the second type of input. Steps 2 to 4 are corn mon for bath types of input.
We present here three network building algorithms (Algorithms I, II and III), each of them being optiinized for detecting and representing a specifie evolutionary phenomenon. The first algorithm (Algorithm 1), which accepts the input of type 2 (a collection of gene trees inferred for various genes), is suitable for inferring either diploid or polyploidy hybridization events occurred among the observed species, or for fmding recombination events occurred at the chromosome level. Algorithm I frrst proceeds by building the weight-based extended majority rule consensus tree followed by fmding reticulation events and adding them to the consensus tree with proper direction in arder to build the explicit weighted consensus network. The tirne complexity of Algorithm I is O(n x m2 x (n + r)), where n is the number of gene trees in the considered gene tree collection r, mis the number ofleaves in each ofthese trees and r is the number of reticulation branches (i.e., reticulation events) added to the consensus tree. Note that the cluster inference procedure in Algorithm I (i.e., the frrst loop for in this algorithm) has the tune complexity of 0( n x m2) as we use an optimal algorithm for the tree cluster inference, originally described by Makarenkov and Leclerc (2000), in which each tree cluster is presented as a binary bipartition vector.
The weight computation procedure for the clusters from the gene tree collection r (i.e.,
the second loop for in Algorithm I) has the time complexity of O(n2 x m2). The time
complexity of the second loop white in this algorithm, where the reticulation branches
are added to the consensus tree, is O(r x n x m2). The function fi nd direction in the
same algorithm has the time complexity of O(n x m2). A group of clusters (i.e.,
bipartition vectors) is called compatible if altogether these clusters induce a unique phylogenetic tree. A cluster chas thefirst degree ofin'compatibility with a phylogenetic
tree T if there exists an SPR (Subtree Prune and Regraft) rn ove of the branches of T
induced by the cluster c that transforms Tinto another phylogenetic tree. For instance in Figure 1, cluster (xy) has the frrst degree ofincompatibility with tree T3. In the ,same
way, cluster (xyw) has the second degree of incompatibility with tree T3, as it requires
two SPR moves (i.e., two reticulation branches) to transform T3 into a tree where cluster
(xyw) is present. In the case of a directed phylogenetic network Nh inferred in
Algorithm I, cluster c will have the frrst degree of incompatibility with Nh if it has the
first degree of incompatibility with the tree T obtained from Nh after carrying out all
SPR moves corresponding to the reticulation branches included in Nh. Mention that in
all the three presented algorithms we only need to know whether a given cluster c has
Input type 1: Input type Il:
1. Species tree 1. Multiple gene trees 2. Multiple gene trees
l J
l
0
lnferring clusters ofeach gene tree
!
8
Computing the weightsfor ali clusters using Equations 1, 2 or 3
1
,...) ( 4 \.../ R.Ei:lll>.lnr, ruJ l:lts clL!Sft7m lw.JiJ<.ld on1r.e~r wdgh:bl. l!
l
(0
U~lrJQ ~·x..-lght··bS.'le.::llJ~!ng :he pn;rMe~ ~f,l'C' ... ù:s i ~xte!ldad roojorty 1Uitl
~ efl the badmooo of r.:arlSCnSLl<; ;r.."'e as !h:s
i:he t.'Q:1'i.lertS~.G· Jmtwo;'k ' bst-:ft:b::lne· cl ba •.:ortllP.rlWh' l':otwmk ·
p ~
1
Mllng iile htgb'le!>t mnked l'tddlng :he rut cl ti--e hlghly
ctu~rs t<l
!
oo
!lpe~~<:>..s L'$ rrmi',:ed <llut.rt..ers lt1 ·.ne ro wt th~ II'T1Jik:tt o::iO!!&l~.~ '.r€al> tl:! Ï'JUM t'teCC>I'lOOrt~!l nùt,vo~k imp:iclt o.:moonsu~ OOb.\'Urt.
Figure 1.2 Flowchart of the new method for building weighted consensus networks. Facet a of the method (indicated by lowercase a next to step numbers) uses a species tree as weil as a set of gene trees to infer the consensus network. Facet bof the method (indicated by lowercase b next to step numbers) uses only a set of gene trees to build the consensus network. Step numbers that do not conta in any letter
Algorithm II, on the other hand, is designed to infer intragenic recombination events or partial horizontal gene transfers which lead to the creation of mosaic genes. This algorithm accepts two types of input (a species tree and a multiple sequence alignment,
or only a multiple sequence alignment). In cases where a species tree is provided, Algorithm II uses it as a backbone of the network. A sliding window procedure is then carried out for fmding the aforementioned reticulation events and adding them to the backbone in order to build an explicit weighted consensus network. Otherwise, if only
a multiple sequence alignrnent is given, a weight-based extended majority rule consensus tree will be built from it and used as the backbone of the network. The time
complexity of Algorithm II isO(iSWi x(O(PhyllnjMeth)+nxm2x(n+r))), where
ISWI
is the cardinality of the set of MSA (multiple sequence alignment) fragmentsexamined by the sliding window procedure and O(PhyllnfMeth) is the running time
of the phylogeny inferençe method used to infer the tree T from the MSA fragment MSAJ.
Our third algorithm (Algorithm III) is intended for fmding complete horizontal gene
transfer events. It accepts as input a species tree in addition to one or more gene trees (or multiple sequence alignments). Algorithm III uses the species tree as the backbone for the network and adds toit the most significant clusters (i.e., horizontal gene transfer
events) obtained after computing the weights of the gene tree clusters in order to build
the weighted consensus horizontal gene transfer network. The time complexity of
Algorithm III is O(PhyllnjMeth) + O(n x m2 x (n + r)).
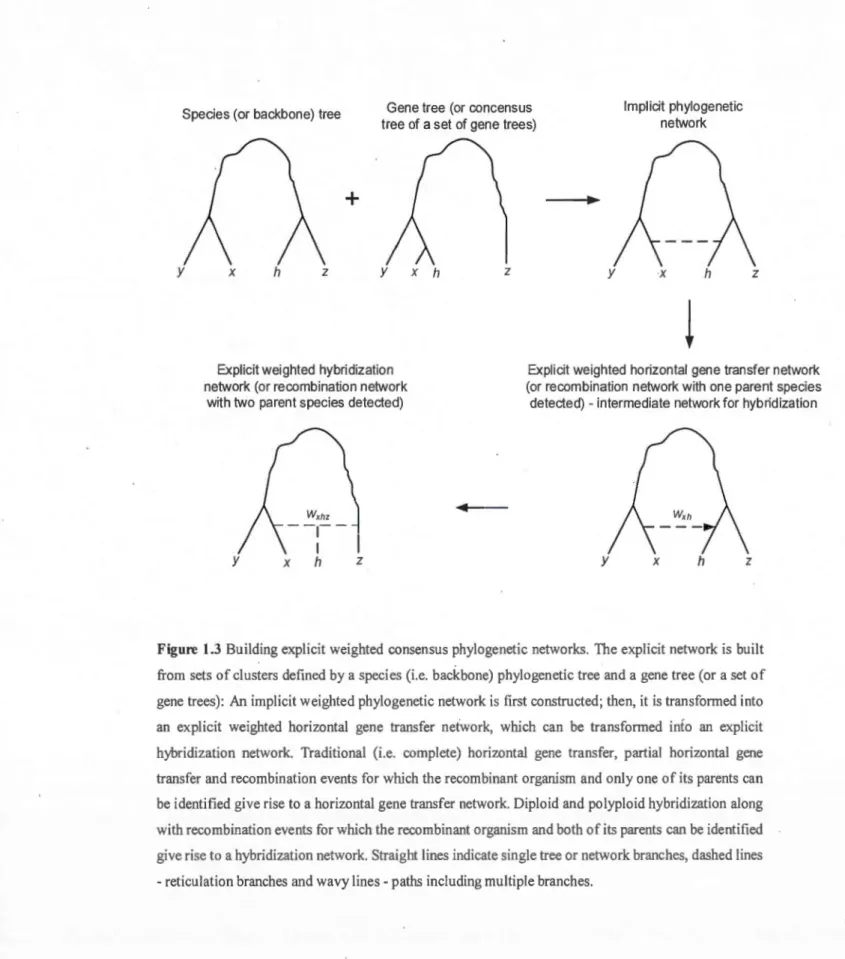
The resulting phylogenetic network, regardless of the algorithm used, will be an explicit (in the sense that it represents exactly the assumed evolutionary mechanism)
weighted and directed consensus network as shown in detail in Figure 1.3. The weight
estimates of the obtained backbone and reticulation branches provide statistical support