Page 1 of 15
Load on osseointegrated fixation of a transfemoral amputee during a fall:
determination of the time and duration of descent
Laurent Frossard1
1 Département de Kinanthropologie, Université du Québec à Montréal, Montréal, Canada
(Article as published in: Frossard L. Load on osseointegrated fixation of a transfemoral amputee during a fall: Determination of the time and duration of descent. 2010. Prosthetics and Orthotics International. 34 (4). p 472-487.DOI: 10.3109/03093646.2010.520057.
http://informahealthcare.com/doi/pdfplus/10.3109/03093646.2010.520057)
ABSTRACT
Mitigation of fall-related injuries for populations of transfemoral amputees fitted with a socket or an osseointegrated fixation is challenging. Wearing a protective device fitted within the prosthesis might be a possible solution, provided that issues with automated fall detection and time of deployment of the protective mechanism are solved. The first objective of this study was to give some examples of the times and durations of descent during a real forward fall of a transfemoral amputee that occurred inadvertently while attending a gait measurement session to assess the load applied on the residuum. The second objective was to present five semi-automated methods of detection of the time of descent using the load data. The load was measured directly at 200 Hz using a six-channel transducer. The average time and duration of descent were 242±42 ms [145 ms-310 ms] and 619±42 ms [550 ms -715 ms], respectively. This study demonstrated that the transition between walking and falling was characterised by times of descent that occurred sequentially. The sensitivity and specificity of an automated algorithm might be improved by combining several methods of detection based on the deviation of the loads measured from their own trends and from a template previously established.
KEYWORD
Gait, biomechanics, lower limb amputation, transfemoral amputation, forward fall, fall detection, loading
1 INTRODUCTION
Falling is a significant health issue for the vast majority of lower limb amputees. Several studies described the occurrence, the prevalence and risk factors of falling for amputees fitted with a socket (1-5). This information is only partially relevant to transfemoral amputees fitted with an osseointegrated fixation (6). In this case, the socket is replaced by a fixation directly inserted into the femur comprising an implant, an abutment and a retaining bolt (7-9). Fall-related information for this population is sparse. However, several studies reported that falls were responsible for damages on the fixation including the bending, and subsequent fractures, of the abutment (2, 7-10). These damages have personal, financial and clinical consequences that are currently perceived as a shortcoming, despite significant prosthetic benefits of this type of attachment (7-9, 11-12).
1.1 Ways to alleviate damages
Mitigation of damages for both populations of transfemoral amputees fitted with a socket or a fixation is challenging (13). However, it could be achieved by implementing safer rehabilitation and exercise programs (e.g., how to fall, walking abilities) (7, 11, 14) and conservative fitting of the prosthesis (e.g., choice of components, alignment of prosthesis)(15-16). These clinical initiatives could be combined with the refinement of the design of existing components (e.g., knees, shock absorbers, quick release mechanisms, abutment, motion-alarm device) along with the development of specific protective devices to be fitted within the prosthesis (e.g., air bag) (13).
1.2 Development of protective devices
As described in Figure 1, a typical protective device should include some generic features such as sensors gathering key variables (i.e., dynamics, kinematics, kinetic), protective mechanism that can be passive (e.g., pad (17)) or active (e.g., air bag (13)), and control circuit interfacing the sensor (e.g., monitoring) and the mechanism (e.g., triggering). Regardless of the design, the capacity of such a device to reduce fall-related damages to the residuum depends on:
• The efficacy of the algorithm that is implemented by the control circuit to detect automatically the time of descent using some sensors (e.g., accelerometers
(18-23), gyroscope (21, 24-25), load (26)) (18, 20, 24, 27-29). Here,
the term “time of descent” is defined as the moment when the amputees cease to have control over their movements leading their body to hit the ground. • The speed of deployment of the active mechanism
based upon prior knowledge of the duration of descent corresponding to the time between the beginning of the fall and the impact on the residuum
(30-31).
1.3 Determination of the time of descent
The recognition of the time of descent relies on a good understanding of the variations of the relevant dynamics, kinematic and kinetic parameters during a fall. By definition, a study providing representative and realistic kinetic data sets of falls is difficult to design (e.g., no random double-blind trials). Consequently, most studies looking at these parameters
Page 2 of 15
simulated a fall using various experiments (e.g., pelvis release experiment (32)). For instance, one of the most recent and comprehensive studies analysed the prosthetic knee motion patterns during tripping that was achieved by an investigator tugging on a cord at the shin at different angles of knee flexion. The ingenious mechanism would be a good representation of the buckling of the knee. Nonetheless, the participant’s loading pattern might be altered due to pre-emption of the pulling combined with the perception of the traction.
1.4 Need for real kinetic data
Frossard et al (2010) (31) have presented some snapshots of a transfemoral amputee as well as forces and moments applied on the three axes of the fixation during the loading, descent, impact and recovery phases of an actual forward fall (31). In particular, their study presented the sequence of events associated with the loading and descent phases, including heel contact (E1), flat prosthetic foot (E2), time of descent (E3), toe-off and sliding of sound toe (E4), beginning of descent of the prosthesis visible on video (E5) and beginning of impact (E6). Another study provided the highest load applied on the residuum during the impact phase (E7) occurring at 875 ms on FML (269 N), 925 ms on FAP (-554 N), 870 ms on FLG (1,144
N), 915 ms on MML (153 Nm), 910 ms on MAP (10 Nm) and
910 ms on MLG (30 Nm) after the heel contact (30). This
demonstrated that the impact was sequential and the main impact force and moment corresponded to 133%BW and 17%BWm, respectively.
Unfortunately, the time of descent was detected manually based on the decline in the curve of the resultant of forces. Consequently, this method of detection was too crude to provide accurate duration of the descent, let alone relevant information to design an automated fall detection algorithm. Thus, there is a need to further deepen the analysis of the load collected during this fall leading to a more systematic detection and accurate estimation of the time and duration of descent, respectively.
1.5 Purpose and objectives
The ultimate purpose of this study was to contribute to the design of an algorithm detecting the time of descent and the deployment of the protective mechanism that are required to develop future wearable devices.
The specific objectives were:
• To give some examples of the times and durations of descent for a transfemoral amputee during a real forward fall,
• To present, compare and contrast five semi-automated methods of detection of the time of descent.
1.6 Scrutinising unique data of a real fall
The unforeseen forward fall occurred inadvertently while recording the load applied on the fixation during activities of daily living (33). Initially, the participant was asked to walk with her prosthesis inside a 10 m wide semi-circle drawn on a concrete walkway. She was asked to walk five times at a self-selected speed with sufficient rest between trials to avoid fatigue. The five first trials were eventless. As detailed in
Frossard et al (2010) (31), the fall occurred unexpectedly at the farther end of the walkway after the prosthetic knee buckled during the last stride of the last trial. The participant suffered no injuries or bruises. The fall was attributed to a faulty knee on review of the prosthesis. It has been reported that 12% of falls are due to prosthetic components (2).
*** Insert Figure 1 here ***
2 METHODS
A comprehensive description of the participant and the apparatus has already been detailed in Frossard et al (2010)
(31). Consequently, only the most relevant information will be
presented here.
2.1 Participant
One fully rehabilitated and active female (34 yr, 1.70 m, 92.95 kg or 911.84 N) fitted with an osseointegrated fixation was asked to participate in this study. The amputation due to a trauma, the fitting of the fixation and the first walk with her prosthesis occurred 10, 4 and 2 years prior the recording, respectively. She was able to walk 200 m independently without walking aids, and reported no incidents six months prior to the recording (33). The research institution's human ethics committee approved this study. The participant provided informed written consent.
2.2 Apparatus
The prosthesis attached to the fixation included an adapter, a transducer, the participant’s usual knee (Mauch GaitMaster; Ossur, Aliso Viejo, CA, USA) and foot (Sure-Flex; Ossur, Aliso Viejo, CA, USA) fitted with a sock and a sandal. The three components of force and moment, referred to as the load, were measured with an accuracy better than 1 N and 1 Nm, respectively, using a six-channel transducer (Model 45E15A; JR3 Inc, Woodland, CA, USA) similar to one used in previous studies (26, 33-36). The load was recorded by a laptop at 200 Hz. The transducer was aligned in a way that its coordinate system was co-axial with the long (LG) axis of the fixation and the two other axes were mutually orthogonal. One of these axes corresponded to the antero-posterior axis (AP), where anterior was positive. The other corresponded to the medio-lateral axis (ML), where lateral was positive.
2.3 Data computing
Firstly, the time scale was reset to zero at the instant of heel contact (30-31). Thus, the time of descent was equal to the duration of loading making both terms interchangeable. Secondly, E3 expressed in milliseconds after heel contact, was determined using the five following methods:
• Method 1 corresponded to the method used by Frossard et al (2010) (31), where E3 was determined manually, based on the decline in loading pattern of the resultant of the forces between loading and descent phases. In this case, E3 was considered the same for the forces and moments along the three axes.
• Method 2 was similar to method 1, except that E3 was manually determined based on the change in individual loading pattern of force and moment on
Page 3 of 15
the medio-lateral (FML, MML), antero-posterior (FAP,
MAP) and long (FLG, MLG) axes. Identification of E3
for each axis might be needed since Frossard et al (2010) (31) demonstrated that the descent and impact were sequential.
• Method 3 was based on the principle that E3 occurred when the loading curves became deviant from their own linear progression (Figure 2). It is well established that the pattern of forces is an apparent straight line at the beginning a gait cycle, particularly on the long axis (37-39). First, a window of data was delimited manually by an initial (TI) and
final (TF) times corresponding to the beginning and
the end of the linear section of the loading curve, respectively. Then, a regression line of this section was calculated. The associated upper and lower lines corresponded to the regression plus and minus the absolute value of the maximum differences between the regression line and the measured load for the window of data, respectively. Finally, E3 was determined as the first point outside the upper or lower limit. This was repeated for force and moment along each axis. This method was characterised by TI
and TF, the duration of the window, the root mean
square (RMS) error between the regression line and the measured load, the slope of the regression line and delta. The slopes, corresponding to the difference in load divided by the difference in time between any two points on the line, were expressed in N/ms and Nm/ms, respectively. Negative and positive slopes indicated a downward and upward progression, respectively. Slopes with a magnitude close to zero indicated a steep loading rate. Delta was the difference between the regression line and the measured load at E3, expressed in percentage.
• Method 4 was similar to Method 3, except that the derived load was considered instead of the raw measured load. This method relied on the principle that E3 can be better detected since the derivation accentuates the changes of pattern. In this case, the slope of forces and moments were expressed in N.ms/ms and Nm.ms/ms, respectively.
• Method 5 was based on the principle that E3 occurred when the load profile during the loading phase became deviant from the typical gait pattern produced by the participant (Figure 2). In this case, the loading pattern is compared to a template. This method is supported by previous findings demonstrating low participant-to-participant variability (38-39). First, the five gait cycles performed before the fall were synchronised with respect to the heel contact and averaged to create a so-called typical pattern. Then, the typical and measured loads were plotted. A window of data delimited manually by the initial (TI) and final (TF) times corresponding to the
points where both data sets were clearly together and separated, respectively. Finally, E3 was determined as the first point of the measured load outside plus or minus one standard deviation of the typical load. This was repeated for force and moment along each axis.
This method was characterised by TI and TF, the
duration of the window and delta. This latter corresponded to the difference between the typical and the measured load at E3, expressed in percentage.
*** Insert Figure 2 here ***
Thirdly, the duration of the descent phase, expressed in milliseconds, was determined for each method. It corresponded to the difference between E3 and the beginning of the impact phase (E6) estimated at 860 ms, as presented in Frossard et al (2010) (31). E6 was preferred to the time when impact on the residuum was the highest (E7) since a protective device should be effective before the beginning of the impact phase.
2.4 Data analysis
Times and durations of descent were analysed in the following ways:
• Overall estimation. All E3 for the three forces and moments were pooled to allow calculation of the overall median, average and standard deviation. • Variable-to-variable comparison. Here, the six
variables referred to the three forces and moments. All the variables were ranked by chronological order for each method. Method 1 was excluded from this sequencing, since E3 was a constant for all the variables. E3 for each variable was characterised by the median and interquartile range.
• Method-to-method comparison. E3 obtained with each method were compared to those determined by Method 2, which were considered as the values of reference. A negative and positive difference indicated that E3 occurred before and after Method 2, respectively. The differences for all the variables were pooled for each method to allow the calculation of the RMS error of the difference with Method 2. The RMS errors were ranked by increasing order, so that the method with the smallest error was overall the most accurate one.
3 RESULTS
3.1 Overview of loading and descent phases
An overview of the forces and moments on the three axes of the fixation and the events from E1 to E6 (31) occurring during the loading and descent phases are presented in Figure 3.
*** Insert Figure 3 here ***
3.2 Characterisation of each method
By definition, Methods 1 and 2 were solely characterised by manually determining E3. The parameters characterising the determination of E3 for Methods 3, 4 and 5 are presented in Table 1. The parameters of the windows of data for Method 5 were only provided for the sake of completion, giving that the criterion to determine TI and TF were loose. These parameters
could vary largely while the method will still provide the same outcomes.
Page 4 of 15
*** Insert Table 1 here ***
3.3 Overall estimation
All methods and variables combined, E3 ranged from 145 ms to 310 ms with an average of 242±42 ms. The median E3 of all data sets including and excluding Method 1 was 240 ms and 250 ms, respectively. The duration of descent ranged from 550 ms to 715 ms with an average of 619±42 ms. Its median including and excluding Method 1 was 610 ms and 620 ms, respectively.
3.4 Variable-to-variable comparison
The durations of loading and descent phases for the force and moment on the three axes for each method are presented by chronological order of detection of E3 in Figure 4. The median (interquartile range) of E3 for the six variables were in the following order: MAP at 163 (30) ms, FAP at 208 (13) ms,
FLG at 240 (6) ms, FML at 260 (14) ms, MLG at 275 (30) ms and
MML at 295 (21) ms. This order was rather consistent for each
method, excluding Method 1 since E3 was a constant for all variables.
*** Insert Figure 4 here ***
3.5 Method-to-method comparison
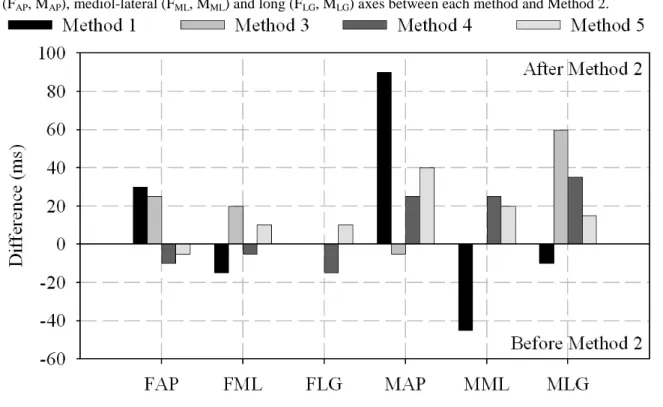
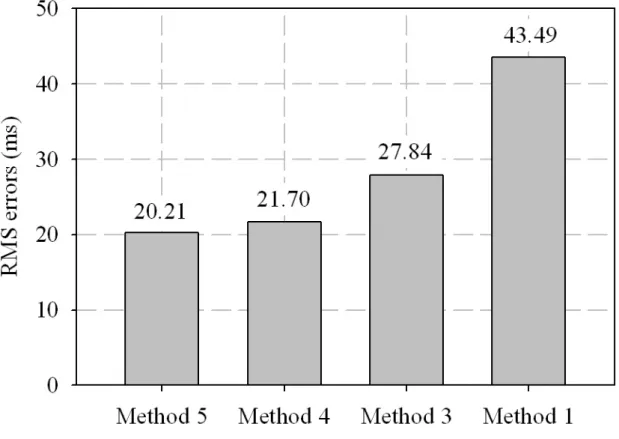
The differences in E3 for the load on the three axes between each method and Method 2 are plotted in Figure 5. The RMS errors of the difference in E3 across three forces and moments between each method and Method 2 ranked by increasing order are presented in Figure 6.
*** Insert Figure 5 and Figure 6 here ***
4 DISCUSSION 4.1 Limitations
This study highlighted the difficulty of achieving appropriate detection and assessment of time and duration of descent, respectively. Indeed, the interpretation and transfer of the results to other participants must be conducted with care mainly because of the intrinsic limitations associated with a retrospective single-case study, alike those presented in Frossard et al (2010) (31).
Thankfully, no injuries to the participant and damage to the fixation occurred indicating that the severity of the forward fall was low. Indeed, the maximum force on impact was approximately four times smaller than the force required for a femoral neck and intertrochantric fractures during sideways fall (40-44). Furthermore, the transition between loading and descent phases might present different patterns on each axis depending on the severity and type of fall (e.g., backward, sideways).
The sampling frequency of 200 Hz was sufficient to assess the lower limb kinetics during walking. Indeed, it was sufficient to measure differences between different methods of detection of E3. However, a sample frequency going up to 10,000 Hz might enable a more timely triggering and deployment of a protective mechanism such as an airbag when milliseconds are critical.
4.2 Time of descent
Frossard et al (2010) (31) demonstrated that the descent phase was characterised by sequential events (31). Each force and moment presented multiple linear sections with different slopes that were not synchronised. This study demonstrated that E3 was also a sequential event. Indeed, in the case of Method 2, the differences between the first (MAP) and the last
(MML) E3 was 135 ms with intermediate differences between
variables of 60 ms (FAP), 30 ms (FLG), 10 ms (MLG), 5 ms
(FML) and 30 ms (MML). The lack of synchronisation of E3 and
descent phase amongst all the variables makes the detection of the fall, and subsequent triggering a protective device, challenging.
4.3 Duration of descent
As expected, times and durations of descent were inversely proportional since the beginning of impact was the same for all the variables. Results associated with all the methods, except method 1, indicated that the duration of descent from the last variable detected until the beginning of impact was approximately 575 ms. This provided an estimation of the time required for a protective device to be triggered and deployed. It should be noted that this duration is about 200 ms longer than the ones presented in previous studies focusing on the falls detection of healthy adults using kinematic (19) and gyroscope (24) data.
4.4 Slope
The slopes were instrumental in the detection of E3. By definition, the values of the slopes and the windows of data alone were highly dependent on the loading pattern of this given participant. Previous studies focusing on temporal variables, local extrema of load, impulse of forces during both walking (34, 45) and activities of daily living (33) demonstrated a low intra-variability and high inter-variability. Consequently, the values would be particularly helpful to further studies of this participant. However, the slope values might be difficult to extend to other amputees due to the effects of confounders (e.g., length of residuum, alignment, speed of walking, height).
4.5 Delta
As expected, these results demonstrated that the deltas decreased with the steepness of the slope, particularly for Method 4 and the antero-posterior axis. In principle, some of comments made earlier about the slope apply to deltas. However, the values were expressed in percentage of the load, making them applicable to other participants and, therefore, more transferrable to a generic algorithm. The deltas obtained for Method 4 were difficult to grasp because the derivation tend to blow out of proportion some differences. However, it should be noted that the deltas of the forces obtained with Method 3, ranging from 3% to 5%, were approximately half of the ones obtained with Method 5, ranging from 9% to 20%.
4.6 Comparison of methods
The aim of numerous mathematical models relying on portable sensors (e.g., accelerometers, gyroscope) was to differentiate a fall from various activities of daily living for elderly with higher risks (18-25, 46-48). Another contribution of this study was to reveal aspects of each method that can, in
Page 5 of 15
principle, either facilitate or challenge the development of similar algorithms capable of detecting instantaneously a fall while monitoring in real-time the load applied on the residuum of transfemoral amputees during activities of daily living (36).
• Method 1 would be easy to implement as only one variable (resultant of forces) involving three channels (components of force) was required, provided that manual input could be systematized. However, it presented the worst results compare to the gold standard with an error nearly twofold greater compared to other methods. This demonstrated that a “one-fit-all” approach is not the most fruitful and each axis must be monitored and analysed individually.
• Method 2 was more likely to be the most accurate, considering it was selected as the method of reference. The manual selection of E3 was eased by the benefit of insight. By definition, it cannot be implemented in an algorithm as such because no quantitative criteria were considered. This justified developing other semi or fully automated methods. • Method 3 ranked third in terms of errors. It could be
easily implemented, as the boundaries of the regression line can be systematized for each variable. TI can be associated with a recognisable event (e.g.,
heel contact, toe-off) while TF progresses with the
signal. Then, the accuracy of the detection will depend on the signal itself, both in terms of duration and magnitude. This study showed that the RMS error, between the regression line and the measured load, increased as the window of data widened despite the manual detection of the curve that appeared the most linear. More importantly, the detection will depend on the ability of the algorithm to differentiate changes in loading associated with a fall from those deliberated and controlled involved in regular activities of daily living (36).
• Method 4 ranked second but with an error comparable to the most accurate method. This study demonstrated that, indeed, the derivation of the load made E3 more discernible due to the accentuation of the change of pattern. Most of the comments associated with Method 3 are applicable to this method. Furthermore, this method will increase computing time due to the signal processing associated with the filtering of the raw load to avoid amplification of the noise and the derivation itself. • Method 5 was the most accurate with the smallest
error. This method appeared the easiest to implement systematically relying on instant-by-instant comparison between a template and the signal. In this case, the capacity of the detection will rely on making a template that is generic but yet sufficiently representative of a gait cycle. Only five gait cycles were considered in this study. A more robust template might require more cycles. Nonetheless, here again, the issue will be to recognise variations from the template that are due to a fall rather than regular activities (36, 49).
The times of descent were detected using an artificial
construct. The benefit of insight allowed Methods 1 and 2 to rely only on manual inputs. The other methods were semi-automated as windows of data were determined manually. Clearly, not a single method seems to hold the solution for an efficient detection of E3. Instead, it appears that a combination of Methods 3, 4 and 5 might be more efficient to increase the specificity of the detection and, therefore, reduce the detection of false positive falls (27).
4.7 Future studies
The development of a fully automated fall detection algorithm for transfemoral amputees was outside the scope of this study. However, the possibilities for longitudinal studies are endless, particularly for the ones testing Methods 3, 4 and 5 independently or combined during continuous recording of activities of daily living (36, 49). The sensitivity (capacity to detect a fall) and the specificity (capacity to detect only a fall) analysis based on true and false positive detections (27) will be essential to characterise the behaviour of the methods presented here not only within and in-between inactivity, stationary loading and locomotion (36, 49) but also when input fall detection thresholds varies (e.g., delta, determining of upper and lower lines of regression).
The detection methods presented here will also facilitate cross-sectional studies of simulated falls associating the methods presented here with the biomechanical tests presented by Blumentritt et al (2009) (50) for a larger cohort of transfemoral amputees. This will provide a better understanding of the participant-to-participant and fall-to-fall (e.g., stoping abruptly, sidestepping abruptly, stepping onto an obstacle, tripping) variability, while completing the kinematic information of the lower limb currently known.
Both longitudinal and cross-sectional studies will be essential to further develop a systematic algorithm and prototype of protective device for lower limb amputees.
5 CONCLUSIONS
An insight into the determination of the time and duration of descent of a prosthetic lower limb during a real forward fall was provided for the first time. This included the presentation of five different methods of assessment of these variables as well as examples of values for an amputee fitted with an osseointegrated fixation.
The fall might appear sudden with a naked eye. However, this study demonstrated that a short transition between walking and falling was characterised by times of descent of the residuum that occurred sequentially on the three forces and moments. Also, the time of deployment of a protective device should have been within approximately 575 ms to be effective in the fall analysed in this study.
The sensitivity and specificity of an automated algorithm might be improved by combining several methods of detection based on the deviation of the loads measured from their own trends and from a template previously established. This work also highlighted that one of the challenges of this algorithm might be to differentiate deviations due to a real fall from those associated with normal changes of pattern between or within activities of daily living, including inactivity, stationary loading and locomotion.
Page 6 of 15
presented here could play a role in fall detection as the core instrument of an apparatus involving other complementary sensors (e.g., foot switch, accelerometer), signal processing (e.g., recognition of falling patterns) and protective device (e.g., air bag).
All together, this study provided key information to engineers and clinicians facing the challenge to design automated wearable fall protective equipment and, rehabilitation and exercise programs to restore safely the locomotion of lower limb amputees.
ACKNOWLEDGMENTS
The author wish to acknowledge Roy Tranberg, Roland Zûgner, Eva Häggström, Dr Kerstin Hagberg, Prof John Evans, Prof Mark Pearcy and Dr Rickard Brånemark for their valuable contribution to the data collection.
This study was partially funded by the Australian Research Council Discovery Project (DP0345667), Australian Research Council Linkage Grant (LP0455481), QUT Strategic Link with the Industry, QUT-IHIB Advanced Diagnosis in Medical Device Grant, and UQAM Kick-off grant.
DECLARATION OF INTEREST
The author reports no conflicts of interest. The author alone is responsible for the content and writing of the paper.
ABBREVIATIONS
E1: Time of heel contact E2: Time of flat prosthetic foot E3: Time of descent
E4: Time of toe-off and sliding of sound toe
E5: Beginning of descent of the prosthesis visible on video E6: Beginning of impact
E7: Time of impact BW: Body weight
BWm: Body weight per meter
FAP: Force applied on the antero-posterior axis
FML: Force applied on the mediol-lateral axis
FLG: Force applied on the long axis
MAP: Moment applied around the antero-posterior axis
MML: Moment applied around the mediol-lateral axis
MLG: Moment applied around the long axis
TI : Initial time delimitating regression line
TF: Final time delimitating regression line
REFERENCES
1. Miller WC, Speechley M, Deathe B. The prevalence and risk factors of falling and fear of falling among lower extremity amputees. Archives of Physical Medicine and Rehabilitation. 2001;82(8):1031-7.
2. Kulkarni J, Wright S, Toole C, Morris J, Hirons R. Falls in patients with lower limb amputations: prevalence and contributing factors. Physiotherapy. 1996;82(2):130-6. 3. Dite W, Connor HJ, Curtis HC. Clinical identification of
multiple fall risk early after unilateral transtibial amputation. Archives of Physical Medicine and Rehabilitation. 2007;88(1):109-14.
4. Vanicek N, Strike S, McNaughton L, Polman R. Postural responses to dynamic perturbations in amputee fallers versus nonfallers: A comparative study with able-bodied
subjects. Archives of Physical Medicine and Rehabilitation. 2009;90(6):1018-25.
5. Vanicek N, Strike S, McNaughton L, Polman R. Gait
patterns in transtibial amputee fallers vs. non-fallers: Biomechanical differences during level walking. Gait & Posture. 2009;29(3):415-20.
6. Pitkin M. On the way to total integration of prosthetic pylon with residuum. Journal of Rehabilitation Research & Development. 2009;46(3):345-60.
7. Sullivan J, Uden M, Robinson K, Sooriakumaran S.
Rehabilitation of the trans-femoral amputee with an osseointegrated prosthesis: the United Kingdom experience. Prosthetics and Orthotics International. 2003;27:114-20.
8. Robinson KP, Brånemark R, Ward D. Chapter 53: Future developments: Osseointegration in transfemoral amputees. In: Smith DG, Michael JW, Bowker JH, editors. Atlas of Amputations and Limb Deficiencies: Surgical, Prosthetic and Rehabilitation Principles - Third Edition: American Academy of Orthopaedic Surgeons; 2005. p. 673-81.
9. Ward D, Robinson KP. Chapter 24: Osseointegration for the skeletal fixation of limb prostheses in amputation at the trans-femoral level. In: Brånemark P-I, editor. The osseointegration book - From calvarium to calcaneus: Quintessenz Verlag - GmbH; 2005. p. 463-75.
10. Miller WC, Deathe AB, Speechley M, Koval J. The influence of falling, fear of falling, and balance confidence on prosthetic mobility and social activity among individuals with a lower extremity amputation. Archives of Physical Medicine and Rehabilitation. 2001;82(9):1238-44.
11. Hagberg K, Brånemark R. One hundred patients treated with osseointegrated transfemoral amputation prostheses - the rehabilitation perspective. Journal of Rehabilitation Research & Development. 2009;46(3):331-44.
12. Hagberg K, Branemark R, Gunterberg B, Rydevik B. Osseointegrated trans-femoral amputation prostheses: Prospective results of general and condition-specific quality of life in 18 patients at 2-year follow-up. Prosthetics and Orthotics International. 2008;32(1):29 - 41.
13. Rajendran P, Corcoran A, Kinosian B, Alwan M. Falls, fall prevention, and fall detection technologies. In: Alwan M, Felder R, editors. Aging medicine, eldercare technology for clinical practitioners Totowa: Humana Press; 2008.
14. Przybelski R, Mahoney J. Chapter 10: Best clinical practice models to reduce falls. Gait disorders - Evaluation and management: Taylor & Francis; 2005. p. 185-205.
15. Yang L, Solomonidis S, Spence W, Paul JP. The influence of the limb aligment on the gait of the above-knee amputees. Journal of Biomechanics. 1991;24(11):981-97.
16. Zahedi M, Spence W, Solomonidis S, Paul J. Alignment of lower-limb prostheses. Journal of Rehabilitation Research & Development 1986;23(2):2-19.
17. Robinovitch SN, Hayes WC, McMahon TA. Energy-shunting hip padding system attenuates femoral impact
Page 7 of 15
force in a simulated fall. Journal of Biomechanical Engineering. 1995;117(4):409-13.
18. Zhang T, Wang J, Liu P, Hou J. Fall detection by embedding an accelerometer in cellphone and using KFD algorithm. International Journal of Computer Science and Network Security. 2006;6(10):277-84.
19. Wu G. Distinguishing fall activities from normal activities by velocity characteristics. Journal of Biomechanics. 2000;33(11):1497-500.
20. Bourke AK, O'Brien JV, Lyons GM. Evaluation of a threshold-based tri-axial accelerometer fall detection algorithm. Gait & Posture. 2007;26(2):194-9.
21. Li Q, Stankovic J, Hanson M, Barth A, Lach J, G. Zhou G. Accurate, fast fall detection using gyroscopes and accelerometer-derived posture information. XIth international Workshop on Body Sensor Networks;
Washington, DC, USA:
http://www.citris-uc.org/events/bsn_2009#citris-presentation-6674; 2009. p. 138-43.
22. Oshima Y, Kawaguchi K, Tanaka S, Ohkawara K, Hikihara Y, Ishikawa-Takata K, Tabata I. Classifying household and locomotive activities using a triaxial accelerometer. Gait & Posture. 2010;31(3):370-4.
23. Nyan N, Etay F, Manimaran M, Seah K. Garment-based detection of falls and activities of daily living using 3-axis MEMS accelerometer. Journal of Physics. 2006;Conference Series 34:1059-67.
24. Bourke AK, Lyons GM. A threshold-based fall-detection algorithm using a bi-axial gyroscope sensor. Medical Engineering & Physics. 2008;30(1):84-90.
25. Estudillo-Valderrama MA, Roa LM, Reina-Tosina J, Naranjo-Hernandez D, editors. A proposal of a fall detection algorithm for a Multidevice Personal Intelligent Platform. BioInformatics and BioEngineering, 2008 BIBE 2008 8th IEEE International Conference on; 2008.
26. Frossard L, Beck J, Dillon M, Chappell M, Evans JH. Development and preliminary testing of a device for the direct measurement of forces and moments in the prosthetic limb of transfemoral amputees during activities of daily living. Journal of Prosthetics and Orthotics. 2003;15(4):135-42.
27. Noury N, Fleury A, Rumeau P, Bourke AK, Laighin GO, Rialle V, Lundy JE, editors. Fall detection - Principles and Methods. Engineering in Medicine and Biology Society, 2007 EMBS 2007 29th Annual International Conference of the IEEE; 2007.
28. Diaz A, Prado M, Roa LM, Reina-Tosina J, Sanchez G, editors. Preliminary evaluation of a full-time falling monitor for the elderly. Engineering in Medicine and Biology Society, 2004 IEMBS '04 26th Annual International Conference of the IEEE; 2004.
29. Lindemann U, Hock A, Stuber M, Keck W, Becker C. Evaluation of a fall detector based on accelerometers: a pilot study. Medical & Biological Engineering & Computing. 2005;43(5):548-51.
30. Frossard L, Tranberg R, Haggstrom E, Pearcy M, Branemark R. Fall of a transfemoral amputee fitted with osseointegrated fixation: loading impact on residuum. Gait and Posture. 2009;30(Supplement 2):S151-S2.
31. Frossard L, Tranberg R, Haggstrom E, Pearcy M, Brånemark R. Load on osseointegrated fixation of transfemoral amputee during a fall: loading, descent, impact and recovery analysis. Prosthetic and Orthotics International. 2010;34(1):85-97.
32. Choi WJ, Hoffer JA, Robinovitch SN. Effect of hip protectors, falling angle and body mass index on pressure distribution over the hip during simulated falls. Clinical Biomechanics. 2009;25(1):63-9.
33. Lee W, Frossard L, Hagberg K, Haggstrom E, Brånemark R. Kinetics analysis of transfemoral amputees fitted with osseointegrated fixation performing common activities of daily living. Clinical Biomechanics. 2007;22(6):665-73.
34. Lee W, Frossard L, Hagberg K, Haggstrom E, Gow DL, Gray S, Branemark R. Magnitude and variability of loading on the osseointegrated implant of transfemoral amputees during walking. Medical Engineering & Physics. 2008;30:825-33.
35. Frossard L, Hagberg K, Haggstrom E, Branemark R. Load-relief of walking aids on osseointegrated fixation: Instrument for evidence-based practice. Neural Systems and Rehabilitation Engineering, IEEE Transactions on. 2009;17(1):9-14.
36. Frossard L, Stevenson N, Smeathers J, Häggström E, Hagberg K, Sullivan J, Ewins D, Lee Gow D, Gray S, Brånemark R. Monitoring of the load regime applied on the osseointegrated fixation of a transfemoral amputee: a tool for evidence-based practice. Prosthetic and Orthotics International. 2008;32(1):68-78.
37. Dumas R, Cheze L, Frossard L. Loading applied on prosthetic knee of transfemoral amputee: Comparison of inverse dynamics and direct measurements. Gait & Posture. 2009;30(4):560-2.
38. Lee w, Frossard L, Cairns N, Brånemark R, Evans J, Adam C, Pearcy M. Finite element modeling to Aid in Refining the Rehabilitation of Amputees Using Osseointegrated Prostheses. 12th International Conference on Human-Computer Interaction; Beijing, China 2007.
39. Beebe K, Song KJ, Ross E, Tuy B, Patterson F, Benevenia J. Functional Outcomes After Limb-Salvage Surgery and Endoprosthetic Reconstruction With an Expandable Prosthesis: A Report of 4 Cases. Archives of Physical Medicine and Rehabilitation. 2009;90(6):1039-47.
40. Laing A, Robinovitch S. Effect of soft shell hip protectors on pressure distribution to the hip during sideways falls. Osteoporosis International. 2008;19(7):1067-75.
41. Sandler R, Robinovitch S. An analysis of the effect of lower extremity strength on impact severity during a backward fall. Journal of Biomechanical Engineering. 2001;123(6):590-8.
42. Robinovitch SN, Hayes WC, McMahon TA. Prediction of femoral impact forces in falls on the hip. Journal of Biomechanical Engineering. 1991;113(4):366-74. 43. Casalena JA, Badre-Alam A, Ovaert TC, Cavanagh PR,
Page 8 of 15
of fall-related peak impact forces on the femur. Journal of Biomechanical Engineering. 1998;120(4):527-32. 44. de Bakker PM, Manske SL, Ebacher V, Oxland TR,
Cripton PA, Guy P. During sideways falls proximal femur fractures initiate in the superolateral cortex: Evidence from high-speed video of simulated fractures. Journal of Biomechanics. 2009;42(12):1917-25.
45. Frossard L, Hagberg K, Haggstrom E, Lee Gow D, Branemark R, Pearcy M. Functional outcome of transfemoral amputees fitted with an osseointegrated fixation: Temporal gait characteristics. Journal of Prosthetics and Orthotics. 2010;22(1):11-20.
46. Suhuai L, Qingmao H, editors. A dynamic motion pattern analysis approach to fall detection. Biomedical Circuits and Systems, 2004 IEEE International Workshop on; 2004.
47. Xinguo Y, editor. Approaches and principles of fall detection for elderly and patient. e-health Networking,
Applications and Services, 2008 HealthCom 2008 10th International Conference on; 2008.
48. Ghoussayni S, Stevens C, Durham S, Ewins D. Assessment and validation of a simple automated method for the detection of gait events and intervals. Gait & Posture. 2004;20(3):266-72.
49. Frossard L, Stevenson N, Smeathers J, Lee Gow D, Gray S, Sullivan J, Daniel C, Häggström E, Hagberg K, Brånemark R. Daily activities of a transfemoral amputee fitted with osseointegrated fixation: continuous recording of the loading for an evidence-based practice. Kinesitherapie Revue. 2006;6(56-57):53-62.
50. Blumentritt S, Schmalz T, Jarasch R. The safety of C-Leg: Biomechanical tests. Journal of Prosthetics and Orthotics. 2009;21(1):2-15.
Page 9 of 15
LIST OF TABLES
Table 1: Parameters associated with the determination of time of descent (E3) of the load on the three axes for Methods 3, 4 and 5. TI and TF corresponded to the initial and final time defining the window of data values, respectively. Units Medio-lateral axis Antero-posterior axis Long axis Units Medio-lateral axis Antero-posterior axis Long axis Method 3 TI (ms) 30 100 30 (ms) 240 45 240 TF (ms) 240 225 225 (ms) 280 140 295 Window (ms) 210 125 195 (ms) 40 95 55 RMS error (N) 1.81 1.40 5.11 (Nm) 0.12 0.53 0.13 Slope (N/ms) 2.148 -4.188 0.343 (Nm/ms) -11.347 -7.727 -12.315 Delta (%) 4.40 4.18 2.90 (%) 21.77 6.55 32.04 Method 4 TI (ms) 90 85 65 (ms) 210 60 215 TF (ms) 235 190 220 (ms) 280 170 275 Window (ms) 145 105 155 (ms) 70 110 60 RMS error (N) 66.44 51.96 148.29 (Nm) 6.91 10.07 4.36 Slope (N.ms/ms) 0.904 0.285 1.820 (Nm.ms/ms) -0.504 0.696 -0.621 Delta (%) 76.87 138.00 21.80 (%) 22.34 942.77 25.11 Method 5 TI (ms) 200 160 200 (ms) 285 125 245 TF (ms) 335 335 335 (ms) 335 335 335 Window (ms) 135 175 135 (ms) 50 210 90 Delta (%) 10.61 20.02 9.36 (%) 72.32 19.24 36.74 Forces Moments
Page 10 of 15
LIST OF FIGURES
Figure 1. Overview of the generic features of a protective device, including the sensor (1A), control (1B) and mechanism (1C) participating in the detection of fall (2A) and protection of the residuum (2B), with an emphasis on the areas developed in this study. F: forces, M: moments, R: resultant of the forces.
Page 11 of 15
Figure 2. Example of determination of the time of descent (E3) for the force applied on the antero-posterior axis (FAP). The left view presents the initial (TI) and final (TF) times defining the window data for Methods 3 (i.e.,
slope) and 5 (i.e., typical pattern). The right view presents the parameters (i.e., slope, delta) characterising each method.
Page 12 of 15
Figure 3. Overview of resultant and three components of the forces and moments on the medio-lateral (ML), antero-posterior (AP) and long (LG) axes of the fixation during the loading (L) and descent (D) phases of the forward fall as determined by the sequence of events (E1 to E6). E3 corresponded to the time of descent as determined by Method 1 in Frossard et al (2010) (31).
Page 13 of 15
Figure 4. Duration of loading (between E1 and E3) and descent (between E3 and E6) phases for the force (F) and moment (M) along the medio-lateral (ML), antero-posterior (AP) and long (LG) axis for each method presented by chronological order of detection of E3. E1, E3 and E6 corresponded to heel contact, time of descent and beginning of impact, respectively.
Page 14 of 15
Figure 5. Differences in determination of time of descent for the forces and moments on the antero-posterior (FAP, MAP), mediol-lateral (FML, MML) and long (FLG, MLG) axes between each method and Method 2.
Page 15 of 15
Figure 6. Root mean square (RMS) error of the difference in time of descent across the three forces and moments between each method and Method 2 ranked by increasing order.