Study of the ecology, population structure and dynamic of
the macroalgae
Codium elisabethae in Faial (Azores) with
underwater visible imagery.
Damien SIRJACOBSLaboratory of Oceanology
Department of Sciences and Management of the Environment - ULG Department of Oceanography and Fisheries
University of the Azores
Laboratory of Algology, Mycology and Experimental Systematics Department of Life Sciences – ULG
Thesis submitted for the degree of Docteur en Sciences
Codium elisabethae O.C. Schmidt is a dark green globose macroalgae isolating an internal sea water volume in a lumen. Codium elisabethae is endemic to the Macaronesian region and is very similar to Codium bursa C. Agardh
whose distribution range spans the West-European, North-Western African and Mediterranean coasts and which was proposed as a potential indicator of coastal environmental changes based on the study of its ecology, revealing its long lifespan. Until recently, relatively little was known on Codium elisabethae as compared to the more widespread Codium bursa.
To fill this gap, the present research aimed at producing an accurate description of the ecology and population dynamics of Codium elisabethae occupying the rocky shores of the Monte da Guia Special Area of Conservation (SAC)/Natura 2000 network (Faial, Azores). To achieve this, two reference sites were selected for long term monitoring: a sheltered no-go reserve exhibiting a dense Codium elisabethae population (Caldeirinhas), and a location experiencing more exposed conditions holding a sparser population (Ponta Furada).
First, environmental conditions experimented by benthic organisms were extensively quantified and interpretated in regard to topographical particularities of each site. The study of reproduction dynamics showed a persistent summer fertility and an important vegetative reproduction. Important nutrient concentration ratio was found between the Codium elisabethae lumen water and surrounding sea water (mean ratios: nitrates: 5.7; ammonium: 3.4; phosphates: 3.1). In situ counting’s and size measurements revealed much higher densities of young recruits in the site of the Caldeirinhas (order of 20 ind/m²) than in the one of Ponta Furada (order of 1/m), for both summer and winter.
Secondly, underwater visible imagery was exploited as an efficient and non-invasive alternative to classical in
situ population estimation. Between August 2003 and November 2005, fifteen seabed photo coverages were
collected by scuba-divers. Subsequent image processing consisted in mosaicing, interactive identification, and automatic change detection methods. This allowed quantifying the seasonal fluctuations of population structures (density, percentage cover and biomass) and of population dynamics (growth, recruitment, mortality and primary production). Chi-square tests of image-derived estimates and in situ measurements confirmed the validity of a centimeter precision for the estimation of population structure of individuals above 4 cm diameter. Important variability of population structure and density was observed within the sites at small spatial scales. Significant differences of population structure and dynamics parameters are demonstrated between two close-by but contrasting coastal habitats. Population density showed a sharp reduction in autumn 2003 and did not recover fully in spring and summer 2004. During the following year, population of the protected site maintained density and biomass, while at the exposed site population density dropped. In contrast with conclusions from earlier studies on the Azorian Codium elisabethae and on the Mediterranean Codium bursa, the present study revealed higher biomass (34 - 730 g dry wt.m-²), growth
rates (up to 2.5 cm/month in summer) and primary production (0.53 – 11.5 g dry wt.m-².day-1), and
demonstrated the seasonal fluctuations of these parameters for the studied Azorian Codium elisabethae population. The lifespan of Codium elisabethae was estimated to reach at least 7 years in the SAC of Monte da Guia based on an integration of average seasonal growth rates measured by imagery on extended population samples.
This study demonstrates the high potential of registered underwater photomosaics time-series for long term surveys of macroalgae populations. This work provides also a strong framework to further developments and applicability to other species, which should be helpful to strengthen our current understanding of benthic ecosystem processes.
Résumé
Codium elisabethae O.C. Schmidt est une macroalgue sphérique dont le thalle vert foncé englobe et isole un
volume d'eau de mer dans un lumen. Codium elisabethae est endémique de la Macaronésie et est très semblable à Codium bursa C. Agardh dont l'aire de répartition couvre les côtes Ouest-Européennes, Nord-Ouest Africaines et Méditerranéennes et qui fut proposée comme indicateur potentiel de changements environnementaux côtiers sur base de l'étude de son écologie et de sa grande longévité. Jusqu'à récemment,
Codium elisabethae était mal connue en comparaison à l'algue plus commune Codium bursa.
Cette recherche vise une description précise de l’écologie et dynamique des populations de Codium
elisabethae au sein des habitats rocheux du site de Monte da Guia (SAC/ Réseau Natura 2000) (Faial, Azores).
Pour cela, deux sites de référence ont été sélectionnés pour une étude à long terme : une réserve en protection intégrale présentant une population dense (Caldeirinhas), et une zone plus exposée présentant une population plus éparse (Ponta Furada).
D'une part, les conditions environnementales subies par les organismes benthiques y sont quantifiées de façon détaillée et interprétées en fonction des particularités topographiques des sites. Une étude de dynamique de reproduction a démontré une fertilité persistante durant l’été et une reproduction végétative importante. Un important rapport de concentration en nutriments est mesuré entre l'eau contenue dans le lumen et l’eau environnante (rapports moyens: nitrates: 5.7; ammonium: 3.4; phosphates: 3.1). Des comptages in situ et des mesures de dimension ont clairement indiqué une densité plus élevé de jeunes recrues dans le site des Caldeirinhas (ordre de 20 indiv.m-²) que dans celui de Ponta Furada (ordre de 1 indiv.
m-²), été comme hiver.
D'autre part, l’imagerie visible sous-marine est exploitée en tant qu’alternative efficace et non intrusive à l’estimation classique de ces populations. Entre août 2003 et novembre 2005, quinze couvertures photographiques enregistrées en plongée dans les sites furent exploitées pour l'analyse de dynamique de population. La constitution de mosaïques d'images suivies d'identification interactive puis de détection automatique de changements ont permis de quantifier les fluctuations saisonnières des structures de population (densité, pourcentage de couverture, biomasse) et des dynamiques de population (croissance, recrutement, mortalité et production primaire). Des tests de contingence (Chi-carré) comparant estimations obtenues à partir d’images et mesures in situ confirment la validité d’une quantification au centimètre de la structure de population pour les individus d’un diamètre supérieur à 4 cm. Une importante variabilité de la structure de population et de la densité fut observée à l'intérieur des sites à petite échelle spatiale. Des différences significatives de structure et dynamique de population sont démontrées entre deux habitats côtiers proches mais différents. La densité de population chute fortement durant l’automne 2003 et n’a pas montré une complète récupération au cours du printemps et de l'été 2004. L’année suivante, densité et biomasse de la population du site protégé se sont maintenues, à l'inverse de la densité dans le site exposé. En comparaison aux conclusions des études précédentes concernant Codium elisabethae aux Azores et Codium
bursa en Méditerranée, l’étude actuelle révèle une biomasse (34 – 730 g m.s. m-²), un taux de croissance
(jusque 2.5cm par mois en été) et une production primaire (0.53 – 11.5 g m.s. m-².jour-1) plus élevés et a
démontré des fluctuations saisonnières de ces paramètres pour Codium elisabethae aux Açores. L'intégration des taux de croissance saisonniers mesurés par imagerie sur de larges échantillons de population a démontré que la durée de vie de Codium elisabethae pouvait atteindre au moins 7 ans dans le SAC de Monte da Guia.
Cette étude démontre le potentiel de séries temporelles de photos-mosaïques sous-marines géo-référencées pour le suivi à long terme de populations de macro algues. Ce travail constitue également
une base solide pour de futurs développements et applications à d'autres espèces, pouvant ainsi contribuer à une meilleure connaissance de l'écosystème benthique.
Ulg Members
Prof. Jean-Marie Beckers (president) Prof. Jean-Marie Bouquegneau (promotor) Prof. Vincent Demoulin
Prof. Jean-Paul Donnay Dr. Sylvie Gobert
External Members
Prof. Ricardo Serrão Santos (co-promotor) Department of Oceanography and Fisheries (DOP) University of the Azores, Portugal.
Prof. Alexandre Meinesz
Laboratoire « Environnement Marin Littoral EA « ECOMERS» Université de Nice Sophia-Antipolis, France.
Dr. Frederik Leliaert Phycology Research Group University of Gent, Belgium.
Acknowledgments
The following institutions are thanked for funding: the Belgian - Fonds pour la Recherche en Industrie et en Agriculture - FRIA, for the PhD grant; the Belgian National Funds for Scientific Research (FNRS) and the Belgian French Community (Communauté Française) for travel grants; the Portuguese Fundation for Science and Technology (FCT) for providing a frame and logistical
support for the present work within the context of the MAROV project (FCT - PDCTM/P/MAR/15249/1999).
I am specifically gratefull to Prof. Jean-Marie Bouquegneau (Laboratory of Oceanology - Uinversity of Liège) and Dr. Ricardo Serrão Santos (Department of Oceanography and Fisheries - University of the Azores) for giving me the possibility to realise this project, for welcoming me in their departments, for the orientation, trust, autonomy and everlasting support they offered me through everything.
I also thank most sincerely:
Sylvie Gobert, Frederico Cardigos and Fernando Tempera for supporting the idea and following the development of this project, for their multiple advises, sharing, and for keeping me on track in the most difficult moments.
Profs. J.M. Beckers and V. Demoulin for offering me the possibity to continue this work while learning more in their laboratories, for their numerous advises and mainly patience.
Prof. J. Nihoul and Marie-Laure Grégoire for the chance they gave me to join ULG and start learning ocean sciences within the Aral-Kum project, as the whole teams of the Laboratory of Oceanology and of the GeoHydrodynamics and Environmental Research departments.
Profs. A. Pascoal and J.P. Costeira (I.S.T., Portugal) for their hosting and enlightning orientation as support in exploring video mosaicking solutions.
Prof. J-P. Donnay (ULG, Belgium) for advises on statistical and geometric considerations. Jean Marie-Théate for teaching me the first bubbles of SCUBA-diving.
Renzo Biondo for so many tecnical solutions and for the nutrient analysis, as also Norberto Serpa and Renato Bettencourt for their permanent logistial support at sea and for making me laugh so much with their true words: « O maluco belga que queres contar todas as algas do Faial » (Norberto); and the terrible one « Vocês cientistas, são todos eguais » (Renato).
All the volunteer divers and skippers involved in this research for their countless help to reach the study sites and for underwater work: David Abecassis, Sergio Bairos, Hugo Diogo, Rita Costa, Mirko de Girolamo, Rogério Ferraz, Pedro Frade, Eva Giacomello, Vera Guerreiro, Paulo Martins, Alexander Penas, Rui Prieto, Vítor Rosa, Vanessa Santos, Marco Aurelio, Teresa Dias, Alexander Penas, Catherine Jadot, Annick Donnay, Jaen Nieto Amat, and all the ones I miss to mention now. At their turn, day after day, they didn’t hesitate to come to work and help me underwater, even in the middle of the winter waves. Grande abraço a todos!!
Bauduin, Yukiko and Thomas Van Cauwenberghe, as Prof. Marie-France Destain, for trusting me. Gaby Castillo for his various advises in the assistant work and Rosa Gago for her important support in final editing work.
Last but not least, I thank all my family and friends, particularly my parents Jacqueline Duhayon and Michel Sirjacobs, as my sister Laure, for their teaching, love, for being always there with complete support. My cousins Mecaël and David Yuan, Elisabeth and Michel for final readings, but also Philippe Deplechin and Armand Manenti for taking me early sailing at sea between storms. Michal Shimoni for having encouraged my idea to move towards ocean sciences at ULG.
David Monticelli (the reviewer champion), Sophie Collette (another Alexandra David-Neel), Regis Paumen (the quietening strength), Franck Velay (the philosophical happiness center) and Géraud Devred (the humanist) for more than 18 years of indefectible friendship.
And above all I thank my son, Noam, for his incredible understanding, patience, surprising words, as for helping by cooking sometimes in the last weeks...
To all of you, Thank you ! Merci! Obrigado!
“The backside of the moon is better known than the 70 % of our planet that are covered by
oceans. In order to meet the challenges of the next decade, major investments in marine science and technology are necessary. The future of the oceans is the future of mankind”
Chapter Contents....…………...……….I
Chapter 1 – Introduction……….……….…….……..…....I Chapter 2 - The environment of Monte da Guia SAC and selected study sites……….II Chapter 3 - The macroalga Codium elisabethae………II Chapter 4 - The potential of visible remote sensing for benthic ecological studies………..III Chapter 5 - Benthic environmental conditions………..…………...III Chapter 6 - Codium elisabethae in situ and laboratory studies………...IV Chapter 7 - Codium elisabethae population structure and dynamics inferred by seabed visible ...imagery………....IV Chapter 8 - General conclusions………...V Chapter 9 – Perspectives………...V Chapter 10 – Annexes………...V
List of illustrations and tables...…………...……VI
Chapter 1 ………...……….…….……..…...VI Chapter 2 ……….………...…..VI Chapter 3 ……….………VII Chapter 4 ……….VII Chapter 5 ………....VIII Chapter 6 ………...…………....IX Chapter 7 ………X Chapter 9 ………...………XI
Acronyms ... XII
Chapter Contents
Chapter 1 – Introduction
1 - Introduction ____________________________________________________________ 11.1 Specific objectives and document structure ___________________________________ 2 1.2 General context __________________________________________________________ 4
1.2.1 Importance of seabed habitats ____________________________________________________ 4
1.2.2 Benthic ecology dynamics requires spatial considerations ______________________________ 6
1.2.3 Importance of seaweed communities ______________________________________________ 7
1.3 Specific context of the thesis ________________________________________________ 7
1.3.1 The environment and European conservation status ___________________________________ 7
1.3.2 Importance of Codium elisabethae _______________________________________________ 10
1.3.3 Potential of macroalgae as bioindicators ___________________________________________ 11
1.3.4 Monitoring of Natura 2000 sites within MAROV project ______________________________ 12
1.3.5 Importance of underwater visible imagery for seaweed monitoring ______________________ 13
II
Chapter 2 - The environment of Monte da Guia SAC
and selected study sites
2 - The environment of Monte da Guia SAC and selected study sites _______________ 19
2.1 General surrounding hydrology ____________________________________________ 20 2.2 Physiography of the islands of the central group and Faial-Pico Channel _________ 21 2.3 The study sites within Monte da Guia SAC __________________________________ 22 2.4 The coastal hydrology ____________________________________________________ 24 2.5 The biotic environment ___________________________________________________ 26 2.6 The seaweed communities _________________________________________________ 27 2.7 The importance and distribution of Codium elisabethae populations _____________ 28 2.8 References _____________________________________________________________ 33
Chapter 3 - The macroalga Codium elisabethae
3 - The macroalga Codium elisabethae ______________________________________ 36
3.1 Systematics of the Codium elisabethae _______________________________________ 37
3.1.1 The Phylum: Chlorophyta _____________________________________________________ 37
3.1.2 The Class: Bryopsidophyceae ___________________________________________________ 37
3.1.3 The Order: Bryopsidales ______________________________________________________ 37
3.1.4 The Family: Codiaceae _______________________________________________________ 38
3.1.5 The Genus: Codium ___________________________________________________________ 38
3.1.6 The species Codium elisabethae O.C. Schmidt (1929) ________________________________ 39
3.2 Recent phylogenetic studies of the genus Codium ______________________________ 40 3.3 The genus Codium: scientific and economic interests___________________________ 40
3.3.1 Original genome and active speciation ____________________________________________ 40
3.3.2 Codium biogeography: a model for scientific research ________________________________ 40
3.3.3 Life cycle and reproduction _____________________________________________________ 41
3.3.4 Largest unicellular organism and variable growth forms ______________________________ 43
3.3.5 Codium growth patterns in response to environmental factors __________________________ 43
3.3.6 Biochemical properties ________________________________________________________ 44
3.3.7 Natural predators and human alimentary uses _______________________________________ 44
3.4 Codium elisabethae and Codium bursa: ecological interests ______________________ 45
3.4.1 An isolated seawater micro ecosystem ____________________________________________ 45
3.4.2 Biogeography _______________________________________________________________ 46
3.4.3 Habitat types ________________________________________________________________ 47
3.4.4 Interesting perspectives ________________________________________________________ 48
3.5 References______________________________________________________________ 49
4 - The potential of visible remote sensing for benthic ecological studies _________________ 56 4.1 Benthic ecology dynamics requires spatial considerations _______________________________ 57
4.1.1 Habitat mapping and Marine spatial ecology _________________________________________________ 57 4.1.2 Examples of marine spatial ecology approaches ______________________________________________ 58 4.1.3 Marine spatial ecology at a starting point but prone to rapid evolution _____________________________ 59
4.2 Synthetic history of benthic ecosystem mapping _______________________________________ 60
4.2.1 Early mapping experiences in the French Mediterranean coast ___________________________________ 60 4.2.2 Early exploitation of airborne and satellite imagery ___________________________________________ 62 4.2.3 Early exploitation of underwater imagery ___________________________________________________ 63 4.2.4 Benthic biota mapping experience in Calvi Bay (Corsica) ______________________________________ 63 4.2.5 Benthic biota mapping around Laing Island, Hansa bay (Papua New Guinea) _______________________ 65 4.2.6 Recent state of the art review _____________________________________________________________ 65
4.3 Overview of benthic biota optical remote sensing studies _______________________________ 66
4.3.1 Above surface remote sensing ____________________________________________________________ 66 4.3.2 Boat embarqued remote sensing __________________________________________________________ 68 4.3.3 Underwater optical remote sensing and imagery ______________________________________________ 69
4.4 Fast improving seabed visible imagery _______________________________________________ 73
4.4.1 Sensors ______________________________________________________________________________ 73 4.4.2 Underwater acquisition _________________________________________________________________ 74 4.4.3 Image geocoding, mosaicking and scaling ___________________________________________________ 75 4.4.4 Image analysis and classification __________________________________________________________ 75
4.5 The present study and exploitation of seabed imagery __________________________________ 76 4.6 References ______________________________________________________________________ 77
Chapter 5 - Benthic environmental conditions
5 - Benthic environmental conditions _______________________________________ 86 5.1 Introduction and objectives _______________________________________________ 87 5.2 Material and methods ____________________________________________________ 88
5.2.1 Sensor deployment and data gaps _________________________________________________ 88
5.2.2 Nutrient concentration in the seawater above seabed __________________________________ 89
5.3 Results and discussions ___________________________________________________ 90
5.3.1 Temperature _________________________________________________________________ 90
5.3.2 Currents _____________________________________________________________________ 94
5.3.3 Waves and instantaneous water movements ________________________________________ 101
5.3.4 Turbidity ___________________________________________________________________ 101
5.3.5 Photosynthetic Active Radiation (PAR) ___________________________________________ 103
5.3.6 Nutrients ___________________________________________________________________ 105
5.3.7 Salinity ____________________________________________________________________ 107
5.4 Conclusions ___________________________________________________________ 108 5.5 References ____________________________________________________________ 110
IV
Chapter 6 - Codium elisabethae in situ and laboratory studies
6 - Codium elisabethae in situ and laboratory studies _________________________ 1116.1 Introduction and objectives ______________________________________________ 112 6.2 Material and methods ___________________________________________________ 112
6.2.1 In situ countings and measurements _____________________________________________ 112
6.2.2 Codium elisabethae sampling __________________________________________________ 113
6.2.3 Morphology ________________________________________________________________ 113
6.2.4 Reproduction _______________________________________________________________ 114
6.2.5 Nutrient concentration within the lumen of Codium elisabethae _______________________ 115
6.2.6 Epiphytism on Codium elisabethae ______________________________________________ 115
6.3 Results and discussions __________________________________________________ 116
6.3.1 In situ countings and measurements _____________________________________________ 116
6.3.2 Morphology ________________________________________________________________ 118
6.3.3 Reproduction _______________________________________________________________ 121
6.3.4 Nutrient concentration within the lumen of Codium elisabethae _______________________ 128
6.3.5 Nutrient concentration ratio between lumen water and sea water _______________________ 132
6.3.6 Epiphytism on Codium elisabethae ______________________________________________ 135
6.4 Conclusions____________________________________________________________ 136 6.5 References_____________________________________________________________ 138
Chapter 7 - Codium elisabethae population structure and
dynamics inferred by seabed visible imagery
7 - Codium elisabethae population structure and dynamic inferred by seabed visible
imagery... 139
7.1 Introduction and objectives ... 140
7.2 Methods ... 141
7.2.1 Data collection ... 141
7.2.2 Data processing ... 144
7.2.3 Validation of population structure with in situ measurements ... 148
7.3 Results and discussions ... 150
7.3.1 Codium elisabethae biomass - size relation ... 150
7.3.2 Validation of the imagery approach developed ... 150
7.3.3 Population dynamics and inter-site differences ... 152
7.3.4 Comparison of information produced by imagery with previous knowledge concerning Codium elisabethae and Codium bursa ... 160
7.4 Conclusions... 164
8.1 Summary of new knowledge concerning Codium elisabethae and the selected seabed habitats of Monte da Guia SAC _________________________________________________ 169 8.2 Summary of interpretations and hypothesis concerning the observed populations structures and dynamics _______________________________________________________ 173 8.3 Suggestions concerning potential use of Codium elisabethae populations as
bio-indicators of environmental changes ______________________________________________ 177 8.4 Final conclusions _______________________________________________________ 178 8.5 References _____________________________________________________________ 179
Chapter 9 – Perspectives
9 - Perspectives ________________________________________________________ 180 9.1 Further exploitations of the compiled time series of seabed mosaics _____________ 181 9.2 Improvements of the imagery methodology _________________________________ 183 9.3 Priority questions concerning the population dynamic of Codium elisabethae _____ 183 9.4 Potential added value of underwater imagery for improving the maps of seaweeds habitat and rocky communities in Calvi Bay _______________________________________ 184 9.5 References_____________________________________________________________ 185
10 – Annexes
10 - Annexes ___________________________________________________________ 186 10.1 Sensors deployment periods ______________________________________________ 187 10.2 Variability of the density of utricles carrying gametangia on Codium elisabethae __ 188 10.3 Details of nutrient concentrations in the lumen water _________________________ 189 10.4 Videomosaic - Caldeirinhas ______________________________________________ 190 10.5 Photomosaic - Caldeirinhas (complete site)__________________________________ 191 10.6 Photomosaic - Caldeirinhas (half site - 09/10/03) _____________________________ 192 10.7 Topography considered in Ponta Furada ___________________________________ 193 10.8 Complete photomosaic of the site of Ponta Furada ___________________________ 194 10.9 Photomosaic - Ponta Furada (half site - 26/11/04) ____________________________ 195 10.10 Contingency tables: imagery versus in situ counting methodologies ___________ 196 10.11 Detection results in Caldeirinhas population ______________________________ 198 10.12 Detection results in Ponta Furada population _____________________________ 203
List of illustrations and tables
Chapter 1:
Figure 1 - Structure of the Thesis. ... 3
Figure 2 - Map of the biogeographical region of Macaronesia (adapted from Vanderpoorten et al., 2007). ... 8
Figure 3 - Map of the Azores archipelago (topography and bathymetry in meters). ... 9
Figure 4 - Codium elisabethae individuals from the Azores (© ImagDOP/Universidade dos Açores) ... 10
Chapter 2:
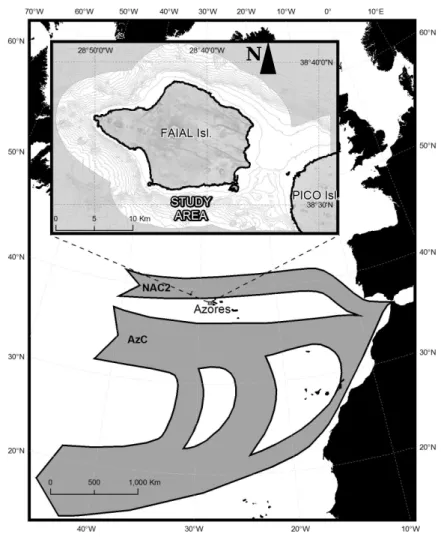
Figure 1 - Location of Faial Island within the general geostrophic surface transport showing North Atlantic Current southern branch (NAC2 ) and the Azores current (AzC) (Adapted by Tempera, 2009 from Siedler and Onken, 1996). ... 20Figure 2 - High resolution color coded bathymetry around Faial Island showing the shallow Faial-Pico Channel; every contour line represents 100 m (Tempera, 2009). ... 21
Figure 3 - Rocky seabed habitat identified within Faial shelf by acoustic methods, above the 100 m isobath (grey line) : black = rock; white = sand (Tempera, 2009). ... 21
Figure 4 - Localization of the SAC of Monte da Guia (one of 3 Natura 2000 sites shaded in blue around Faial), with indication of particular sites occupied by Codium elisabethae. ... 22
Figure 5 - Location and detailed bathymetry of the study sites Ponta Furada and Caldeirinhas within the “Monte da Guia” SAC (up) established at the southwestern Faial Island, Azores, North Atlantic (down)... 23
Figure 6 - Swell and wind statistics for Faial Island (adapted from Carvalho, 2003 and data from the Horta Meteorologic Observatory provided by Instituto de Meteorologia) ... 24
Figure 7 - Mean seasonal stratification of the water column around the Islands of Faial, Pico and São-Jorge (from CTD data courtesy of Bashmachnikov) ... 25
Figure 8 - Density anomalies (kg.m-3) from a South (left) to North (right) cross-section through Faial-Pico Channel. Blue shades are lower than average densities whilst warm colors are higher than average densities. White is for values around the average density. Points represent measurements along CTD casts used in the interpolation (Tempera, 2009). ... 25
Figure 9 - Spatial distribution of Codium elisabethae observations and respective SACFOR abundance score (Tempera, 2009) ... 28
Figure 10 - Approximate distribution of algal populations around the volcanic cone of Monte da Guia. Composition based on prospections carried out during summer 1999. Blue shades represent only the bathymetry (Tempera et al., 2001a); ... 29
Figure 11 - Approximate distribution of algal populations on rocky seabeds in a transect of the south-east coast of Faial island (Pasteleiro-Feteira). Composition based on prospections carried out during summer 1999. Blue shades represent only the bathymetry (Tempera et al., 2001a). ... 29
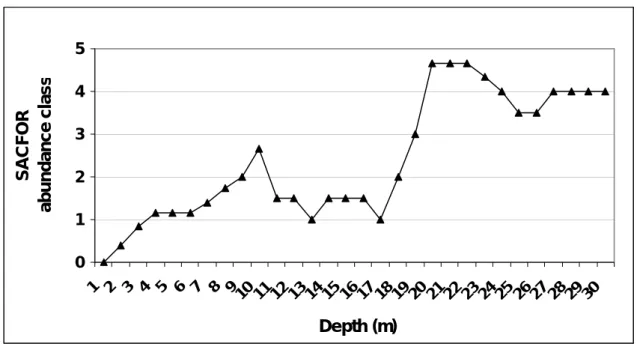
Figure 12 - Depth distribution of averaged SACFOR abundance class of Codium elisabethae around the coasts of Faial and Pico islands (Tempera, personal communication). ... 30
%, green= 75 to 100 %) (Tempera, 2009). ... 31
Figure 14 - Codium elisabethae: probability of the predicted abundance class (red = below 50%; yellow= 50 to 75 %, green= 75 to 100 %) (Tempera, 2009). ... 31
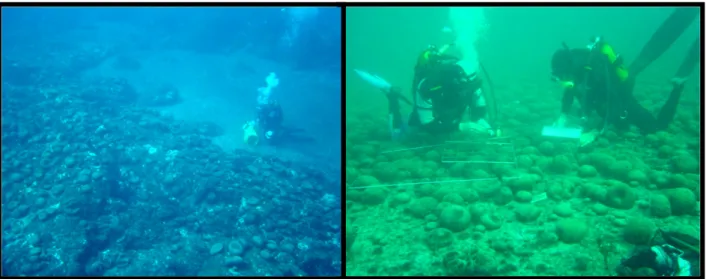
Figure 15 - Codium elisabethae stands within the sites of Ponta Furada (left) and Monte da Guia (right). ... 32
Table 1 – List of different macroalgae observed in the SAC of Monte da Guia (Tempera et al., 2001) ... 27
Chapter 3:
Figure 1 – Morphological diversity of Codium (extracted from Verbruggen et al., 2007). ... 39 Figure 2 – Codium genus typical life cycle (Lee, 1999) ... 42 Figure 3 – Synthetic distribution of Codium elisabethae and Codium bursa within the North-East Atlantic
and Western Mediterranean (adapted from Chacana 2002, with SST from Feldman et al., 2011). ... 47
Chapter 4:
Figure 1- Schematic relationship among traditional research fields, specific sub-disciplines and their relationship with biodiversity conservation (conservation biogeography and genetics). Rectangles represent broad and traditional research fields, from which, after the development and popularization of the use of molecular markers, originated the research programs listed in the ellipses (extracted from Diniz-Filho et al., 2008). ... 59 Figure 2- A) Digitized and gridded bathymetry across the Great Bahama Bank from 0 to 10 m; B)
Modelled net primary production (g.C m–2 yr–1) derived from SeaWiFS imagery over the entire Bahamas Banks; adapted from Dierssen et al. (2010). ... 67 Figure 3- A) High-resolution video mosaic obtained with ROV; B) Abundance and spatial distribution of
stony corals obtained by digitizing the boundaries of each coral colony. The coral cover obtained by this method (2.8%) was within the 95% confidence intervals of the values obtained by divers and from video mosaics using the point-count method (extracted from Lirman et al., 2007). ... 71 Figure 4- Upper surface of the massive coral Montastreaea annularis showing individual ramets and
patches of live tissue. Parts of two ramets have been delineated using black for the edge of dead coral (colonized by algae) and white for live coral. (Each grid cell measures 10 by10 cm; extracted from Mumby et al., 2005). ... 72 Figure 5- The Seabed AUV (top left) has been designed for high-resolution imaging close to the sea floor.
As illustrated by the mission depth profile (blue line, top center) following bathymetry (purple line) at a height of 3 m height in varied terrain (coral reef in the U.S.Virgin Islands), it can obtain high-resolution high-quality color imagery (bottom row); (extracted from Singh et al., 2004). ... 74
Chapter 5:
Figure 1 – Sensors installed on docking stations in Caldeirinhas (left: RCM9 current-meter and PAR sensor) and in Ponta Furada (right: Aquadopp 3D, PAR and OBS turbidity sensor). ... 88 Figure 2 – Seasonal evolution of 20 minutes averaged water temperature at seabed in the study sites of
Caldeirinhas (blue) and Ponta Furada (red). ... 90 Figure 3 – Seasonal evolution of monthly mean water temperature at seabed in the study sites of
Caldeirinhas (dotted line) and Ponta Furada (continuous), with monthly standard deviation. ... 91 Figure 4 – Clear influence of the tidal cycle on the bottom water temperature in the Caldeirinhas and
Ponta Furada sites, during the stratified summer period. ... 92 Figure 5 – Influence of the tidal cycle on the bottom water temperature in the Caldeirinhas and Ponta
Furada sites measured at 5 minutes interval (Minilogs). ... 93 Figure 6 - Difference of bottom temperature between Caldeirinhas and Ponta Furada benthic sites
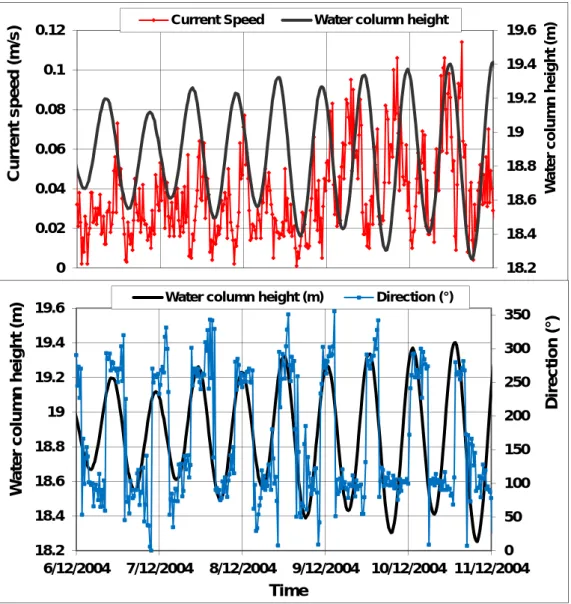
measured at 5 minuntes interval with Minilogs (red), and mean difference (light blue). ... 93 Figure 7 – Typical neap and tide currents in Ponta Furada site during calm conditions, showing clear tidal
phase of current direction (blue) with water level cycle (black). ... 94 Figure 8 – Installation of a bottom return current in the Caldeirinhas in relation with an intense NNE
swell: a) wind speed (red) and direction (blue) ; b) wave height (red) and direction (blue); c) current speed (red) and direction (blue); d) temperature tidal cycle (red) interrupted during 4 tidal cycles of water column height (blue). ... 96 Figure 9 – Monthly mean current speed at bottom in both sites (August 2004 – June 2005) ... 97 Figure 10 – Monthly maximum of 20 minutes averaged current speed at bottom in both sites
(August 2004 – June 2005) ... 98 Figure 11 – Hodographs (a and b) and current direction histograms (c and d) for the month of December
2004 in Caldeirinhas (blue, left) and Ponta Furada (red, right). ... 99 Figure 12 – Hodographs (a and b) and current direction histograms (c and d) for the month of August
2005 in Caldeirinhas (blue, left) and Ponta Furada (red, right). ... 100 Figure 13 – Correlation between maximal instantaneous speed at bottom and significant wave height
recorded in the site of Ponta Furada. ... 101 Figure 14 – Monthly mean turbidity observed in both sites from August 2004 to June 2005. ... 102 Figure 15 – Evolution of current speed (up) and turbidity (down) observed during a particular storm
event (23-27/03/2005) in the Caldeirinhas (blue, left) and in Ponta Furada (red, right). ... 102 Figure 16 – Comparison of winter and summer daily mean photon fluxes (left) and maximal instantaneous
photon fluxes (right) reaching seabed in the PAR waveband, for both sites. ... 103 Figure 17 – Comparison of typical winter (up) and summer (down) instantaneous PAR photon fluxes
reaching seabed, for both sites (year 2004). ... 104 Figure 18 – Mean summer and winter nitrate and ammonium concentrations in the seawater above
seabed, averaged for the sites of Ponta Furada (left) and Caldeirinhas (right); shown with 95% confidence intervals. ... 106 Figure 19 – Mean summer and winter Phosphate concentrations in the seawater above seabed, averaged
for the sites of Ponta Furada (left) and Caldeirinhas (right); shown with 95% confidence intervals. ... 106 Figure 20 – Illustration of occasional conductivity and salinity intense reductions measured in the
Figure 2 – Mean size histogram measured in august 2003 in Caldeirinhas and Ponta Furada sites by in situ
counting method. ... 116
Figure 3 – Synthesis of population structure evolution seen from in situ counting between August 2003 and February 2004 for both Caldeirinhas (C) and Ponta Furada (P) sites. ... 117
Figure 4 – Size histogram obtained from in situ counting on 6m² per site in July 2005. ... 118
Figure 5 – Double mucron at the tip of a Codium elisabethae utricle ... 119
Figure 6– Relation between mean horizontal diameter and height of C. elisabethae. ... 119
Figure 7 – Evolution of Codium elisabethae fresh biomass versus mean horizontal diameter and fitted polynomial used for biomass estimates from imagery. ... 120
Figure 8 – Total displaced and internal volume of Codium elisabethae versus mean horizontal diameter, for each site (blue=Caldeirinhas; red=Ponta Furada; volume of a sphere). ... 120
Figure 9 – Microscopy photography of gametangia observed in August 2003 on a Codium elisabethae from the Caldeirinhas site. ... 121
Figure 10 – Mean density of utricles with gametangia per site and observation period... 122
Figure 11 – Distribution of mean density of utricles carrying gametangia according to the algae size, site of Caldeirinhas... 123
Figure 12 – Distribution of mean density of utricles carrying gametangia according to the algae size, site of Ponta Furada. ... 123
Figure 13 – Proportion of gametangia carrying gametes, full per site and observation period. ... 124
Figure 14 – Codium elisabethae in intense vegetative reproduction process (diam. 15 cm) ... 125
Figure 15 – Detail of a small propagule and fixation filament (left), with its rooted shape lower extremity (right) ... 125
Figure 16 – Number of propagules per parent plant, site of the Caldeirinhas. ... 126
Figure 17 – Number of propagules per parent plant, site of Ponta Furada. ... 127
Figure 18 – Comparison of mean nutrient concentrations measured per site in the lumen of Codium elisabethae, for both winter (left column) and summer (right column) ... 128
Figure 19 – Comparison of mean nutrient concentrations measured per season in the lumen of Codium elisabethae, for both sites (Ponta Furada left column; Caldeirinhas right column). ... 129
Figure 20 – Nitrate concentrations in the lumen of Codium elisabethae versus algae class size, data aggregated over season and sites. ... 130
Figure 21 – Ammonium concentrations in the lumen of Codium elisabethae versus algae class size, data aggregated over season and sites. ... 131
Figure 22 – Phosphate concentrations in the lumen of Codium elisabethae versus algae class size, data aggregated over season and sites. ... 131
Figure 23 – Global nitrate concentrations in sea water and in Codium elisabethae lumen water, with ratio. ... 133
Figure 24 – Global ammonium concentrations in sea water and in Codium elisabethae lumen water, with ratio. ... 133
Figure 25 – Global phosphate concentrations in sea water and in Codium elisabethae lumen water, with ratio. ... 134
Figure 26 – Total epiphyte biomass on Codium elisabethae versus mean horizontal diameter, measured during winter (Feb 2004) and summer (July 2004) in both sites. ... 135
Table 1 – Number of Codium elisabethae exploited for studies on sexual reproduction……… ... 114 Table 2 – Mean nutrient concentrations, and concentration ratio between lumen of Codium elisabethae
and seawater………... ... 132
Chapter 7:
Figure 1 - Acrylic plate nailed in the rock as reference mark for geometric correction of seabed images (left and center: colonized; right: cleaned plate). ... 141 Figure 2 - General scheme of the installation of reference marks delineating study site; example of the
Caldeirinhas; green square = reference mark, red arrow = scuba diving passage 5 m above seabed; blue quadrat = individual image footage including 4 reference marks. ... 142 Figure 3- Illustration of relative reference marks positions reconstruction (red) by progressive compilation
of in situ horizontal distance measures (green lines and black circles) into a computer assisted drawing software (site of Caldeirinhas). ... 144 Figure 4- Coordinate selection scheme for the center of a reference marks (green square); taken as the
center of the polygon defined by intersections (red dots) of redundant distance measurements (blue arcs). ... 145 Figure 5 - a) Zoom into a mosaic build from video image showing dense fields of macroalga Codium
elisabethae, classical deformation zones appearing. b) Zoom into a mosaic build from still camera
image over the same zone and timing as in (a); both areas cover 2 by 4 meters. ... 146 Figure 6 - Illustration of Codium elisabethae detection result (red disks) for half of the site of Caldeirinhas
(left) and Ponta Furada (right), each picture (graduated in pixels) representing 4x4 meters (pixel resolution=0.2 cm). ... 148 Figure 7 - Illustration of the possibility to follow by image differences the evolution of individuals detected
(red disks) in successive mosaics (1 m² extracted from Caldeirinhas time series). ... 149 Figure 8 - Size histogram obtained from in situ and imagery counting in validation quadrats
(data aggregated over time and sites). ... 151
Figure 9 - Evolution of cover rate, density, mean diameter and biomass of Codium elisabethae population, site of Caldeirinhas ... 153
Figure 10 - Evolution of cover rate, density, mean diameter and biomass of Codium elisabethae population, site of Ponta Furada ... 153 Figure 11 – Seasonal growth rate of both Codium elisabethae populations (averaged over size, with
confidence interval) during 2 years period; ES = End Summer (September - mid October); A = Autumn (mid October - end December); W = Winter (January, February, March); SP = Spring
(April, May, June); S = Summer (July-August); 03 =2003; 04=2004; 05=2005. ... 154 Figure 12 - Seasonal growth rate of both Codium elisabethae populations (averaged over size over 2 years);
ES = End Summer (September - mid October); A = Autumn (mid October - end December); W = Winter (January, February, March); SP = Spring (April, May, June); S = Summer (July-August). ... 155 Figure 13 - Seasonal growth rate of both Codium elisabethae populations (averaged over both sites and all
seasons)... 156 Figure 14 - Mean summer growth rate of both Codium elisabethae population for the site of Caldeirinhas. ... 157 Figure 15 - Mean winter growth rate of both Codium elisabethae population for the site of Caldeirinhas. ... 157 Figure 16 - Mean horizontal diameter of Codium elisabethae versus age, simple model considering only
Table 1 – Date list of exploited imagery surveys ……… ... 143
Chapter 8:
Figure 1 – Codium elisabethae autecology synthetic life history phases proposed; based on the evolution of relative intensity (% of maximal values) of important parameters derived from imagery analysis and in situ measurements: global mean nutrient concentration in the lumen (blue) and growth rate (black); vegetative (green) and sexual reproduction (red) intensities for both study sites (full lines for Caldeirinhas and dashed lines for Ponta Furada). ... 176
Chapter 9:
Figure 1 - Illustration of high spectral and spatial resolution information available in the 2 meters distant image coverage recorded; and potential exploitability for complementary studies on Codium
Acronyms
ABISS Automated Benthic Image-Scaling SystemAUV Autonomous Underwater Vehicle
AzC Azores current
CASI Compact Airborne Spectrographic Imager
CALD site of Caldeinrinhas within Monte da Guia SAC, Faial, Azores.
C. elisabethae Codium elisabethae O.C. Schmidt
C. bursa Codium bursa C. Agardh
CCD Charged Coupled Device
DOP Departamento de Oceanografia e Pescas; Department of Oceanography and Fisheries - University of the Azores. http://www.dop.uac.pt/
DIVA Data Interpolating Variational Analysis GIS Geographic Information System
GPS Global Positioning System
LLSS Laser Line Scan Systems
MAROV Mapping of Marine Habitats of the Azores using Robotic Ocean-Vehicles. Research project funded by FCT, Fundation forSciences and Technology, Portugal.
MPA Marine Protected Area
NOAA National Oceanic and Atmospheric Administration, is a US federal agency focused on the condition of the oceans and the atmosphere. NAC2 North Atlantic Current southern branch
NATURA 2000 European wide network of nature protection areas established under the 1992 Habitats Directive
PAR Photosynthetic Active Radiation
PF site of Ponta Furada within Monte da Guia SAC, Faial, Azores.
ROV Remote Operated Vehicle
SAC Special Area of Conservation (NATURA 2000 Network)
SACFOR Scale of abundance : Abundant, Common, Frequent, Occasionnal, Rare SCI Site of Community Importance (NATURA 2000 Network)
SCUBA Self Contained Underwater Breathing Apparatus SPA Special Protected Area
STARESO Station de Recherches Océanographiques et Sous-marines http://www.stareso.ulg.ac.be/Stareso/Stareso.html
Table of contents
1 - Introduction ____________________________________________________________ 1
1.1 Specific objectives and document structure ___________________________________ 2 1.2 General context __________________________________________________________ 4
1.2.1 Importance of seabed habitats ____________________________________________________ 4 1.2.2 Benthic ecology dynamics requires spatial considerations ______________________________ 6 1.2.3 Importance of seaweed communities _______________________________________________ 7
1.3 Specific context of the thesis ________________________________________________ 7
1.3.1 The environment and European conservation status ___________________________________ 7 1.3.2 Importance of Codium elisabethae ________________________________________________ 10 1.3.3 Potential of macroalgae as bioindicators ___________________________________________ 11 1.3.4 Monitoring of Natura 2000 sites within MAROV project ______________________________ 12 1.3.5 Importance of underwater visible imagery for seaweed monitoring ______________________ 13
~ 2 ~
1.1 Specific objectives and document structure
Within the context described in section 1.2 and 1.3, the present research aims at producing a precise description of the population static parameters (size histograms, density, cover rate) and dynamic parameters (growth rate, primary production) of the macroalga Codium
elisabethae occupying the Special Area of Conservation of Monte da Guia, Faial, Açores.
This first precise quantitative evaluation of the Codium elisabethae life cycle, population dynamics and internal nutrient concentration is an important step in the evaluation of the ecological role of the species within this highly valued ecosystem, as toward the potential exploitation of Codium elisabethae as a bioindicator of coastal environmental changes. It is our hope that the present thesis will highlight the benefit and efficiency resulting from the use of an underwater image mosaicking approach for long term and spatially precise monitoring of benthic populations, thereby archiving a high level of spatial organizational information. This work will also propose explanations on how the local benthic habitat specificities (topography and induced hydrodynamic) do shape Codium elisabethae population dynamics and reproduction.
The specific objectives of the present thesis are:
to describe the physical dynamic of 2 benthic habitat sites occupied by contrasting structures of populations of C. elisabethae within Monte da Guia SAC.
to confirm and quantify the nutrient enrichment of the internal seawater of
C. elisabethae, as was demonstrated earlier for C. bursa.
to establish the seasonal dynamics of the sexual and vegetative reproduction of
C. elisabethae, and demonstrate the possible summer fertility.
to quantify the fluctuations of density, biomass, population structure, growth rate, primary production and lifespan of the studied C. elisabethae populations over a 2 year period, based on the analysis of seabed underwater imagery.
to analyse the possible links between the various information produced (physical habitat and status-environment-reproduction-population dynamic)
to conclude on: 1) the new information produced in regard to pre-existing knowledge on C. elisabethae and C.bursa; 2) their consequences on the potential exploitations of
C. elisabethae and C. bursa as complementary bioindicators of environmental changes
over the Macaronesian, Mediterranean, and European Atlantic coasts; 3) the high potential of underwater imagery as an efficient tool for expanding the possibilities of benthic ecology studies and monitoring over large spatio-temporal scales.
The structure of the document (Fig. 1) can be outlined as follows.
The general and specific contexts of the thesis are given in complement to the present introduction.
The first part consists of several literature reviews of the main topics addressed in the thesis. Chapter 2 gives a general description of the environment of the Monte da Guia SAC and of the selected study sites of Caldeirinhas and Ponta Furada located within the southern coast of Faial. A synthesis of the current knowledge of the macroalga C. elisabethae is provided in chapter 3, together with some general considerations about the Codium genus and useful comparisons with the sister species C. bursa. Chapter 4 underlines the requirements of new
in general and for seaweed ecology in particular.
The second part presents the methods, results, and discussions of the thesis. Chapter 5 gives a synthetic characterization of the environmental conditions existing within the two benthic habitat studied (temperature, currents, photosynthetic active radiation, turbidity, nutrients), based on the analysis of in situ water samples and of data sets produced by a battery of sensors deployed in situ during a complete year. Chapter 6 describes the results of in situ and laboratory measurements of the macroalga morphology, population structure, reproduction dynamics, and nutrient concentrations within the algae’s lumen (enclosed seawater volume). Quantification of population dynamics parameters, growth dynamics and biomass production are detailed in Chapter 7 together with the developed methodologies of submarine image acquisition and exploitation.
A third part consists of general discussions, conclusions and perspectives. A general conclusion (chapter 8) summarizes novel information produced, discusses and emphasizes interesting links between results and finally the main perspectives are summarized in chapter 9, focusing on the important points that need to be addressed to expand the limits of our knowledge concerning Codium elisabethae and the studied benthic habitats, as concerning future improvements and potential applications of the imagery method developed.
Figure 1 - Structure of the Thesis.
Chapter 1 - Introduction Bibliographic research
Chapter 2 - The environment of Monte da Guia SAC and selected study sites Chapter 3 – The macroalga Codium elisabethae
Chapter 4 - The potential of visible remote sensing for benthic ecological studies Material, methods, results and discussions
Chapter 5 - Benthic environmental conditions
Chapter 6 - Codium elisabethae in situ and laboratory studies
Chapter 7 - Codium elisabethae population structure and dynamics inferred by seabed visible imagery
Synthesis
Chapter 8 - General Conclusions Chapter 9 - Perspectives ******************************
~ 4 ~
1.2 General context
1.2.1 Importance of seabed habitats
1.2.1.1 Coastal seabed habitats
The oceans harbor a great diversity of organisms whose distribution and ecological preferences are often poorly understood (Tyberghein et al., 2011).
The notion of "Coastal Seabed Habitat" is very broad. It defines both "what is where" in terms of mineral and biological resources of the marine coastal zone, and "what happens where" in terms of environmental constraints on the living and geological processes. In this sense, "habitat" is not only the substrate and shelters encountered by the "inhabitants", but also the local dynamic "aquatic weather" they do benefit from and have to cope with. These notions are of high importance in the sense that they will define how productive is a specific area regarding particular primary producers, or how much important are small localized zones where conditions are favorable for the reproduction of other species which, at later life stages, disperse on the whole coastal zone we are interested about.
Biological communities are changing drastically in response to global climate change, changes in use by human populations, and invasive species. To study the impact of such changes on the marine environment, biologists require a detailed understanding of the diversity and distributions of marine organisms (Wiley et al., 2003). It is due to the integration of substrate, environmental dynamics, and biological communities notions that some benthic habitat can be understood as biodiversity hotspots (Ready et al., 2010) or refuges in face of anthropic pressures (Halpern et al., 2008), global climate changes (Thomas et al., 2004), or introduction of exotic species (Thuiller et al., 2005; Cardigos et
al., 2006). Such types of areas should certainly be given a specific attention (protection)
for the establishment of coastal marine management plans supposed to protect biodiversity as well as to optimize present and future exploitability of resources. Monitoring of key population dynamics, species distribution modelling (Tempera, 2009; Tyberghein et
al., 2011) and ecosystem modelling will increasingly contribute to improve ecological
knowledge and inform marine ecosystem management and conservation. 1.2.1.2 Importance of seabed habitats ecosystem services
The seabed is the most extensive habitat on the planet. It occupies at least 75% of the Earth’s surface, far more if the planar areas of the shelves and slopes are taken into account. It follows that fluxes of materials across the sediment–water interface, and the mechanisms that mediate and constrain those fluxes are likely to have global significance (Raffaelli et al., 2003). The global importance of seabed has been evaluated for nutrient cycling, which for marine shallow water systems is superior to 40,000 US$/(ha.year), representing 1.86% of the value of this service for all terrestrial and aquatic systems (Constanza et al., 1997, in Raffaelli et al., 2003). Benthic ecosystem equilibriums are known to have a very important impact on the bentho-pelagic coastal fisheries production as their dynamics are closely interrelated.
open ocean since there is a greater range of habitats near the coast (Gray, 1997). Losses of marine diversity are highest in coastal areas largely as a result of conflicting uses of coastal habitats. According to Gray (1997), the best way to conserve marine diversity is to conserve habitat and landscape diversity in the coastal area. This author suggests that marine protected areas (MPAs) are only a part of the conservation strategy needed and that the framework for coastal conservation is an integrated coastal area management where one of the primary goals is the sustainable use of coastal biodiversity.
The biodiversity is a sensitive key factor in the ecosystem services, in terrestrial (Hector and Bagchi, 2007) as in aquatic environments (Duarte, 2000; Schaffelke et al., 2006). Field studies of biodiversity fluctuations do require habitat structure information and will certainly increasingly require integrating a spatial ecology dynamic approach for any modelling attempt to answer practical management questions concerning natural resources. Indeed, Bulling et al. (2006) consider that the integration of spatial scales is one of the future challenges to allow ecosystem models to address the biodiversity–ecosystem functioning. However, they underlie that the first and greatest limitation in this progress is due to our lack of knowledge of the real scaling relationships that drive ecosystem dynamics, which confirms well the imperative need to develop new methods to explore seabed habitat structures and monitor their changes at larger spatio-temporal extents and with enhanced resolutions.
1.2.1.3 Increasing damages to benthos ecosystems
The example of the French Mediterranean shore. The marine littoral of the Region “Provence-Alpes-Côte d’Azur” suffered during a long period of multiple degradations (Meinesz et al., 1981, 1982 and 1985) of which mainly (i) irreversible destruction of shallow habitats (0-20 m) by artificial land reclamation over the sea, (ii) general degradation of ecosystems due to non-treated sewage outfalls and to the increasing turbidity of coastal waters and (iii) increasing professional and recreational overfishing.
Trawling impact. Among the problems affecting benthos ecosystems, Schmidt (1998) as well as Malakoff (1998) summarized important researcher’s interrogations and progresses concerning the impact of trawling on seabed. Particularly, Watling and Norse (1998) compared the habitat damage caused by trawling with forest clear-cutting (long denounced by biologists as a major threat to biodiversity). Thrush and Dayton (2002) underlined the importance of being able to consider correctly the spatio-temporal scales of disturbances in regard to the extent of habitat and its recovery time.
Decline of coral reef communities. Similarly, the recent decline in the condition of coral reef communities worldwide has fuelled the need to develop innovative assessment tools to document coral abundance and distribution rapidly and effectively. While most monitoring programs rely primarily on data collected in situ by trained divers, digital photographs and video are used increasingly to extract ecological indicators, to provide a permanent visual record of reef condition, and to reduce the time that divers spend underwater (Lirman et al., 2007).
The importance of ecologically sensitive, degraded and over-exploited seabed ecosystems raises the need to monitor them frequently, over a large scale, and in a cost-efficient and spatially explicit manner.
~ 6 ~
1.2.2 Benthic ecology dynamics requires spatial considerations
Coastal biodiversity and biological resources management depend on a fundamental knowledge concerning habitats as distribution and dynamics of local populations and metapopulations (Kritzer and Sale, 2006). Their maintenance and variations are the results of complex interactions between the degree of connectivity of populations within their biogeographic range and the dynamics of forcing factors including changes in environmental and anthropic pressures (Kritzer and Sale, 2006). Greatly complex questions such as the process of designing marine protected areas for biodiversity or stock protection, or the estimation of the level of sustainable exploitability of benthic marine biological resources require complex spatialized considerations (seabed habitat maps, seabed habitat hydrodynamics, local population dynamic, genetic proximity between populations).
The whole coastal exploitation should be thought in the long term as an insertion, a fusion in the dynamics of natural ecological processes in order to be sustainable. Long term data acquisition and monitoring of coastal marine habitat status are required to confirm the potential consequences of the various coastal uses on specific changes of the environmental status and of economic productivities. It is only after a good knowledge of the distribution and dynamics of coastal marine life is acquired that an integrative analysis of economic and environmental pressures affecting natural processes will become possible. It is on the basis of such integrated understanding and with growing experience in each particular type of coastal areas that the definition of sound management plans will gain in efficiency.
In order to link realistically and at a large scale the marine habitat status with notions of sustainable development of marine coastal uses, new extensive surveying approaches are required in complement with the traditional approaches developed in localized benthic research. However, in the coastal environment, precise habitat description and population monitoring are particularly difficult to achieve. New emerging techniques are increasingly needed to allow more extensive, frequent, and precise monitoring. These techniques include processing of images (visible or acoustic) obtained from platform ranging from satellites in space down to underwater automated robots or handled in scuba-diving, as well as the permanent installation of seabed sensors. Still to be combined with classical field work monitoring, sampling and laboratory studies, such information can be integrated into spatialized environmental modelling
Extensive, precise and frequent seabed surveying constitutes an expensive monitoring work but is the price to pay to allow a rational management of resources without taking the risk of damaging them further. Yet, modern technology is progressively reducing these monitoring costs by expanding our abilities in term of imaging resolution, navigation automation and range, and subsequently in term of spatio-temporal coverage efficiency.
Modern seabed mapping becomes thus a basic requirement for the general study of marine ecosystem processes and changes, the implementation and long term monitoring of Marine Protected Areas (MPAs), the management of marine resources, and the monitoring and modelling of species’ distributional shifts.
Thus, the optimization and sustainable management of coastal uses require precise and frequent evaluation of the whole coastal habitats status, or at least of some well-designed sub sampled particular areas, chosen as indicators of the status of exploited zones and of protected areas.
Seaweeds can grow as individuals, but they more frequently live together in communities with other seaweed and animal species. Seaweed communities affect and are affected by the
environment, and are among the most productive marine plant communities on earth (Leliaert
and Coppejans, 2004). Together the intertidal and subtidal zones give rise to a narrow coastal
area that accounts for less than one per cent of the Earth’s surface (Leliaert and Coppejans,
2004). However the productivity of this region can equal or exceed that of most terrestrial
communities (Dawes, 1998).
In many coastal ecosystems, seaweeds play an important contribution: as primary producers feeding the basis of trophic chains (herbivorus and detritivorus), as contributors to the nutrient cycling (Alvera-Azcárate et al., 2003; Lepoint et al., 2004 and 2007), as sheltering and supports to other species. In their review on marine autotrophic production, Duarte and Cebrián (1996) produced general estimations of the fate of Net Primary Production (NPP) of
macroalgae as follows. Concerning the local ecosystem trophic chain, at least 40 % of
macroalgae NPP feed the local decomposition chain, while around 34 % is consumed by the herbivores. The NPP part which is not useful to the local ecosystem is estimated at 24 % (and up to 44%) for the exportation by advection out of the system, and from 0.4 till 6 % for the exportation by storage in sediments.
Within benthic ecosystems, seaweed communities are an important component and indicator of the coastal benthic equilibriums, and deserve as such a detailed attention.
As a consequence, an increasing number of coastal environmental monitoring programs
include an estimation of seabed primary producers, and macroalgae in particular. For instance,
after underlining that coral reef monitoring programs often focus narrowly on hard corals despite the low coral abundance but high macroalga abundance on many coral reefs worldwide, Miller et al. (2003) advocated the inclusion and standardization of the estimation of reef macroalga abundance as a contribution to improve and coordinate coral reef monitoring at a large scale.
1.3 Specific context of the thesis
1.3.1 The environment and European conservation status
Natura 2000 is a European ecological network composed of sites designated under the Birds Directive (Special Protection Areas, SPAs) and the Habitats Directive (Sites of Community Importance, SCIs, and Special Areas of Conservation, SACs). It aims at preserving biodiversity by conserving natural habitats, wild flora and fauna in the European Union territory. It is composed of sites classified as Special Protection Areas (SPA), by the Council Directive 79/409/EEC of 2 April 1979 on the conservation of wild birds, including the migratory species and the habitats where they occur. A Site of Community Importance (SCI) is defined in the European Commission Habitats Directive (92/43/EEC) as a site which, in the biogeographical region or regions to which it belongs, contributes significantly to the