DOI: 10.1126/scitranslmed.3006294
, 198ra105 (2013);
5
Sci Transl Med
et al.
Adenauer G. Casali
Processing and Behavior
Editor's Summary
a prerequisite for deployment in the clinic.
robust measure that distinguishes conscious from unconscious states well enough to be used on an individual basis, appears to be a
et al.
of being derived from a simple noninvasive measurement. The new index reported by Casali
The validity of PCI for clinical application will need to be assessed in prospective trials, but it has the advantage conscious state showing intermediate values (0.32 to 0.49).
unconscious (0.19 to 0.31), the two with locked-in syndrome clearly aware (0.51 to 0.62), and those in a minimally patients clearly reflected the state of their consciousness, with the six patients in a vegetative state clearly
in a vegetative state or minimally conscious state, or exhibited locked-in syndrome. The PCI values from these from stroke or trauma. Here, too, the authors found promising results in those who had emerged from coma but were conventional assessment methods? In these people, consciousness varies widely, as does the underlying damage
However, what about patients who suffer brain damage and who exhibit various levels of consciousness by 0.31.
''unconscious'' values for the PCI: midazolam deep sedation, 0.23 to 0.31; propofol, 0.13 to 0.30; and xenon, 0.12 to patients given various amounts of the anesthetics midazolam, xenon, and propofol. These agents too caused low completely different way of inducing unconsciousness had the same effect on PCI, the authors assessed data from awake healthy people, but fell to 0.18 to 0.28 during nonrapid eye movement (NREM) sleep. Then, to see whether a comparing the unique information in each, the authors derived PCI values. The values ranged from 0.44 to 0.67 in 32 brains with transcranial magnetic stimulation. By calculating the likely brain regional sources of the signals and then
The authors used data already collected from previous experiments, in which they had stimulated people's brain's response to a magnetic stimulus. The PCI could allow tracking of consciousness in individual patients. index of human consciousness [the perturbational complexity index (PCI)] that reflects the information content of the extended their previous work on electrical correlates of consciousness to define an electroencephalographic-derived
have
et al.
have locked-in syndrome (in which they are aware but cannot respond) are unconscious. Here, Casali
provide reliable reactions, and a more precise index is needed to avoid, for example, the conclusion that people who crudest of tools to detect when a person is not aware. The usual question or physical stimulus does not always
but physicians have only the −−
think anesthesia −−
Manipulation of consciousness is an everyday medical trick
Quantifying the Unquantifiable
NW, Washington, DC 20005. Copyright 2013 by the American Association for the Advancement of Science; all last week in December, by the American Association for the Advancement of Science, 1200 New York Avenue
(print ISSN 1946-6234; online ISSN 1946-6242) is published weekly, except the
Science Translational Medicine
on August 16, 2013
stm.sciencemag.org
http://stm.sciencemag.org/content/5/198/198ra105.full.html
can be found at:
http://stm.sciencemag.org/content/suppl/2013/08/12/5.198.198ra105.DC1.html
can be found in the online version of this article at:
Supplementary Material
http://stm.sciencemag.org/content/scitransmed/2/19/19ra13.full.html http://stm.sciencemag.org/content/scitransmed/3/110/110ec190.full.html http://stm.sciencemag.org/content/scitransmed/4/122/122ec31.full.html http://stm.sciencemag.org/content/scitransmed/4/131/131ec72.full.html
can be found online at:
Related Resources for this article
http://www.sciencemag.org/about/permissions.dtl
in whole or in part can be found at:
article
permission to reproduce this
of this article or about obtaining
reprints
Information about obtaining
last week in December, by the American Association for the Advancement of Science, 1200 New York Avenue (print ISSN 1946-6234; online ISSN 1946-6242) is published weekly, except the
Science Translational Medicine
on August 16, 2013
stm.sciencemag.org
C O N S C I O U S N E S S
A Theoretically Based Index of Consciousness
Independent of Sensory Processing and Behavior
Adenauer G. Casali,1*†Olivia Gosseries,2* Mario Rosanova,1Mélanie Boly,2‡ Simone Sarasso,1Karina R. Casali,1,3Silvia Casarotto,1Marie-Aurélie Bruno,2 Steven Laureys,2Giulio Tononi,4Marcello Massimini1,5§
One challenging aspect of the clinical assessment of brain-injured, unresponsive patients is the lack of an objective measure of consciousness that is independent of the subject’s ability to interact with the external environment. Theoretical considerations suggest that consciousness depends on the brain’s ability to support complex activity patterns that are, at once, distributed among interacting cortical areas (integrated) and differentiated in space and time (information-rich). We introduce and test a theory-driven index of the level of consciousness called the per-turbational complexity index (PCI). PCI is calculated by (i) perturbing the cortex with transcranial magnetic stimu-lation (TMS) to engage distributed interactions in the brain (integration) and (ii) compressing the spatiotemporal pattern of these electrocortical responses to measure their algorithmic complexity (information). We test PCI on a large data set of TMS-evoked potentials recorded in healthy subjects during wakefulness, dreaming, nonrapid eye movement sleep, and different levels of sedation induced by anesthetic agents (midazolam, xenon, and propofol), as well as in patients who had emerged from coma (vegetative state, minimally conscious state, and locked-in syn-drome). PCI reliably discriminated the level of consciousness in single individuals during wakefulness, sleep, and anesthesia, as well as in patients who had emerged from coma and recovered a minimal level of consciousness. PCI can potentially be used for objective determination of the level of consciousness at the bedside.
INTRODUCTION
A fundamental shortcoming of clinical practice is the lack of a reliable method to objectively assess the level of consciousness. Currently, the clinical evaluation of consciousness relies on the patient’s ability to interact with the surrounding environment and to demonstrate his or her subjective experience. Under some conditions, however, such as during surgical anesthesia or after severe brain injury, patients may be con-scious but disconnected from the external environment because their sensory, motor, or executive functions are impaired (1–3). Under these circumstances, an individual’s level of consciousness cannot be assessed. Here, we develop an index that aims to overcome this problem.
Phenomenologically, each conscious experience is both differentiated (that is, it has many specific features that distinguish it from a large repertoire of other experiences) and integrated (that is, it cannot be divided into discrete, independent components). Neurophysiologically, these fundamental properties of subjective experience rely on the ability of multiple, functionally specialized areas of the thalamocortical system to interact rapidly and effectively to form an integrated whole (4–7). Hence, an emerging idea in theoretical neuroscience is that conscious-ness requires an optimal balance between functional integration and functional differentiation in thalamocortical networks, otherwise defined
as brain complexity (8–11). This complexity should be high when con-sciousness is present and low whenever concon-sciousness is lost in sleep, anesthesia, or coma (10, 12, 13).
Theoretical indices based on this principle have been designed to assess the joint presence of differentiation and integration in neu-ral systems (14–16). These metrics are only applicable, however, to simple systems of simulated elements or under highly restrictive as-sumptions and have not been tested on human brains. Currently used empirical indices of consciousness, instead, are based either on inte-gration alone [as judged by the extent or synchronization of cortical activation (17, 18)] or on differentiation alone [as judged by entropy or spectral content (19, 20)], and do not reliably assess conscious-ness in individual patients or across many different conditions. In a recent series of experiments, we assessed the electroencephalographic (EEG) response to transcranial magnetic stimulation (TMS) during physiological (21, 22), pharmacological (23), and pathological (24) loss of consciousness. We found that, compared to responses of con-scious, wakeful individuals, brain responses of people who had lost consciousness became either local (suggesting a loss of integration) or global but stereotypical (suggesting a loss of differentiation). Never-theless, these studies did not allow us to quantify brain complexity across subjects and conditions, a requirement for a reliable, unified measure-ment scale.
Here, we introduce an empirical measure of brain complexity, the perturbational complexity index (PCI), which gauges the amount of in-formation contained in the integrated response of the thalamocortical system to a direct perturbation. We test PCI on a large data set of TMS-evoked potentials recorded from healthy subjects during wakefulness, dreaming, nonrapid eye movement (NREM) sleep, and different levels of sedation induced by different anesthetic agents (midazolam, xenon, and propofol), as well as from brain-injured patients who had emerged from coma (overall, 208 sessions in 52 subjects).
1
Department of Biomedical and Clinical Sciences‘Luigi Sacco’, University of Milan, 20157 Milan, Italy.2Coma Science Group, Cyclotron Research Centre and Neurology Department,
University and University Hospital of Liège, 4000 Liège, Belgium.3Institute of Science and
Technology, Federal University of São Paulo, 12231-280 São José dos Campos, Brazil.
4Department of Psychiatry, University of Wisconsin, Madison, WI 53719, USA.5Istituto Di
Ricovero e Cura a Carattere Scientifico, Fondazione Don Carlo Gnocchi, 20148 Milan, Italy. *These authors contributed equally to this work.
†Present address: Faculty of Medicine Clinics Hospital, University of São Paulo, 05403-000 São Paulo, Brazil.
‡Present address: Department of Psychiatry, University of Wisconsin, Madison, WI 53719, USA.
§Corresponding author. E-mail: [email protected]
on August 16, 2013
stm.sciencemag.org
RESULTS
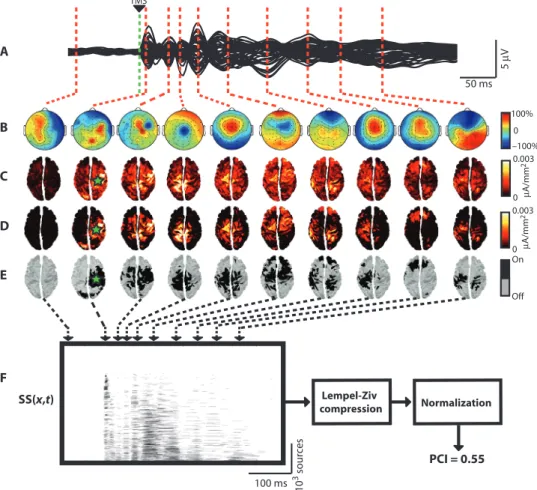
We determined the PCI in individual patients by performing several steps (Fig. 1): (i) recording the brain’s early reaction (within the first 300 ms) to a direct TMS-induced cortical perturbation with high-density electroencephalography (hd-EEG) (25); (ii) performing source mod-eling and nonparametric statistics to extract a binary matrix of signif-icant sources [SS(x,t)] that describes the spatiotemporal pattern of activation caused by the TMS perturbation (26); (iii) compressing this matrix to calculate its information content with algorithmic complex-ity measures, such as the Lempel-Ziv complexcomplex-ity index (27); and (iv) normalizing algorithmic complexity by the source entropy of SS(x,t)
(28). Thus, operationally, PCI is defined as the normalized Lempel-Ziv complexity of the spatiotemporal pattern of cortical activation trig-gered by a direct TMS perturbation (see the Supplementary Materials for details of these steps).
In practice, PCI is expected to be low if there is reduced interaction among cortical areas (loss of integration), because in this case, the matrix of activation engaged by TMS will be spatially restricted; PCI will also be low if many interacting areas all react to the perturbation in a stereotypic way (loss of differentiation) because the resulting matrix will be large but redundant and can be effectively compressed. PCI will be high only when the initial perturbation is transmitted to a large set of integrated areas that react differently, giving rise to a spatiotemporal pattern of activation that cannot be easily reduced.
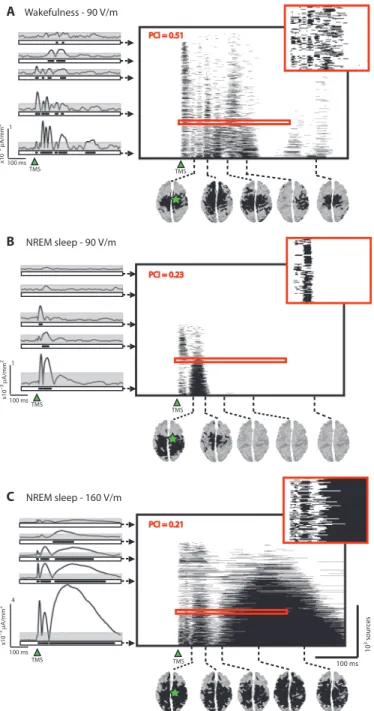
PCI reflects the joint presence of integration and differentiation An example of application of TMS and cal-culation of the resulting PCI in a healthy subject is shown in Fig. 2. Spatiotemporal patterns of TMS-evoked cortical activa-tion were obtained by calculating SS(x,t) matrices, which describe where (x) and when (t) TMS evokes significant cortical activity (26). In this case, we computed the SS(x,t) matrices during one session performed in wakefulness (stimulus inten-sity, 90 V/m) and two sessions obtained with different stimulation intensities (90 and 160 V/m) in NREM sleep early in the night, when consciousness tends to fade. In wake-fulness, TMS triggered a chain of significant responses in a distributed set of cortical areas, which became active at different la-tencies, resulting in an overall spatiotem-poral pattern of cortical activation that was both widespread and differentiated (Fig. 2A). TMS delivered with the same stimulation parameters during NREM sleep elicited a local, short-lasting response (Fig. 2B), whereas increasing the stimulation in-tensity during NREM sleep resulted in a typical slow wave (21) and a global cortical response in which many brain regions were steadily activated for a few hundred milliseconds (Fig. 2C). We then compressed these matrices, resulting in PCI values that were high in wakefulness, when cortical responses were both integrated and dif-ferentiated, and low in NREM sleep, irre-spectively of the amplitude and the extent of the response to TMS (fig. S1). PCI discriminates between
consciousness and unconsciousness in healthy individuals
We next tested the effects of stimulation site and intensity on PCI in healthy, awake A B C D E 5 µ V 50 ms 10 3 sour ces 100 ms SS(x,t) µ A/mm 2 100% 0 –100% On Off 0.003 0 TMS F Lempel-Ziv compression Normalization PCI = 0.55 µ A/mm 2 0 0.003
Fig. 1. The PCI is calculated from TMS-evoked potentials. (A) The black traces show the super-position of the averaged TMS-evoked potentials (150 trials) recorded from all EEG channels (butterfly plot of 60 channels) in one representative subject during wakefulness. (B) The color-coded maps show the instantaneous voltage distributions at selected latencies [auto-scaled between the maximum (+100%) and the minimum (−100%) instantaneous voltages]. (C) The corresponding distributions of cortical currents are calculated by means of a weighted minimum norm inverse solution applied to a three-sphere BERG forward model. (D) Significant TMS-evoked cortical currents are estimated by ap-plying a nonparametric bootstrap-based statistical procedure at the source level. (E) A binary spatio-temporal distribution of significant sources (SS) is extracted: SS(x,t) = 1 for significant sources (x) and time samples (t); SS(x,t) = 0 otherwise. The sources in the matrix SS(x,t) are sorted, from bottom to top, on the basis of their total activity during the post-stimulus period. (F) The information content of SS is estimated by calculating the Lempel-Ziv complexity measure (see fig. S3 for a diagram of the algorithm). PCI is defined as the information content of SS, normalized by the correspondent source entropy. Green star, site of TMS stimulation.
on August 16, 2013
stm.sciencemag.org
subjects. In these subjects, PCI varied within a relatively narrow range [between 0.44 and 0.67; mean ± SD, 0.55 ± 0.05; number of measure-ments (N) = 110] among different stimulation sites [superior occipital gyrus (BA19), middle superior frontal gyrus (BA08), superior parietal gyrus (BA07), rostral portion of the premotor cortex (BA06), and midline sensorimotor cortex (BA04)], different suprathreshold stimula-tion intensities (induced field on the cortical surface: 80 to 160 V/m), and different subjects [number of subjects (n) = 32] (Fig. 3A). When included as fixed factors in a linear mixed model (LMM) (see Mate-rials and Methods), stimulation sites and stimulation intensities did not have significant effects on PCI values (P = 0.4, F4,113.7= 1 for sites
and P = 0.4, F1,133.4= 0.73 for intensities). In addition, PCI values did
not depend on whether TMS was targeted to the left or right hemi-spheres or on whether alert subjects were lying with their eyes opened or closed during the experimental procedure (table S1). We then deter-mined PCI in the same group of subjects during NREM sleep or anes-thesia with various drugs (n = 24). PCI was reduced to values between 0.12 and 0.31 [mean ± SD, 0.23 ± 0.04; N = 42] when subjects lost consciousness, resulting in a clear-cut distinction between the distribu-tions of the conscious and unconscious groups (P = 10−21, F1,31= 561).
When all conditions were considered and main effects were compared (Fig. 3B), PCI values in wakefulness were significantly higher than those in NREM sleep (range, 0.18 to 0.28; mean ± SD, 0.24 ± 0.02; P = 10−19), after administration of midazolam deep sedation (range, 0.23 to 0.31; mean ± SD, 0.28 ± 0.03; P = 10−19), and during general anesthesia with
propofol (range, 0.13 to 0.30; mean ± SD, 0.23 ± 0.04; P = 10−13) or
xenon (range, 0.12 to 0.31; mean ± SD, 0.23 ± 0.06; P = 10−22). No sig-nificant differences were found among PCI values for subjects who experienced loss of consciousness. In addition, the time course of PCI was reproducible (Fig. 3C). During wakefulness, PCI grew substantially af-ter 100 ms, whereas in all situations where consciousness was lost, the PCI plateaued at around the same latency. The maximum divergence between the rate of growth of PCI in the conscious and the unconscious conditions
[DPCI(t)] occurred between 50 and 150 ms after TMS (Fig. 3C).
PCI is sensitive to graded changes in the level of consciousness
In the six subjects who had undergone propofol anesthesia, we also performed measurements at intermediate levels of sedation. Constant effect-site concentrations of propofol were obtained with a computer-controlled intravenous infusion (Alaris TIVA; CareFusion) and esti-mated with a three-compartment pharmacokinetic model (29). Loss of consciousness induced by anesthetic agents was graded with a score of 1 (no response to mild prodding/shaking) or 0 (no response to painful stimuli) as assessed by the Modified Observer’s Assessment of Alertness and Sedation (MOAAS) scale. In the intermediate condition, all subjects attained a MOAAS score between 3 (response only after name is called loudly and/or repeatedly) and 2 (response only to mild prodding/shaking), and the PCI showed intermediate values between 0.34 and 0.42 (mean ± SD, 0.39 ± 0.03; N = 6) that fell between the conscious and the un-conscious values (Fig. 4A). Repeated-measures analysis of variance (ANOVA) showed significant effects of sedation levels on complexity
as measured by PCI (P = 4 × 10⁻⁶, F2,10 = 54). PCI values at
in-termediate levels of propofol anesthesia were significantly lower than those during wakefulness (P = 0.001) and significantly higher than those obtained in deep sedation (P = 0.0004). In one subject in whom cortical responses to TMS could be recorded during all sleep stages (Fig. 4B), PCI had an intermediate value (0.39) during the transition from
x10 –3 µ A/mm 2 100 ms 10 3 sour ces TMS A B C PCI = 0.51 PCI = 0.21 PCI = 0.23 100 ms TMS TMS x10 –3 µ A/mm 2 100 ms 4 1 x10 –3 µ A/mm 2 100 ms 1 TMS TMS TMS Wakefulness - 90 V/m NREM sleep - 90 V/m NREM sleep - 160 V/m
Fig. 2. PCI simultaneously measures integration and differentiation. (A to C) The spatiotemporal matrices of significant sources [SS(x,t)] (within the black frames) for a representative subject stimulated with TMS during (A) alert wakefulness (stimulus at an intensity of 90 V/m), (B) NREM sleep (stimulus at an intensity of 90 V/m), and (C) NREM sleep (stimulus at an intensity of 160 V/m). In each matrix, sources are sorted from bottom to top according to their total amount of significant activation during the post-stimulus period. The insets within the red frames show an expanded portion of the SS matrix to highlight its spatiotemporal structure at a finer grain. The time series on the left of each SS matrix show TMS-evoked currents for some representative sources. The gray area indicates the statistical threshold (bootstrap statistics) applied to each source activity, whereas the black dots depicted below each time series are the time points when TMS triggered significant activations. The same time points constitute the corresponding rows of the SS matrix. The cortical topo-graphical maps below each SS matrix show the spatial extent of significant cortical activations at selected time points. Green star, site of TMS stimulation.
on August 16, 2013
stm.sciencemag.org
wakefulness to sleep (sleep stage 1) and a value (0.46) within the con-scious distribution during rapid eye movement (REM) sleep, upon awakening from which the subject reported having experienced a dream. PCI discriminates the level of consciousness
in brain-injured patients
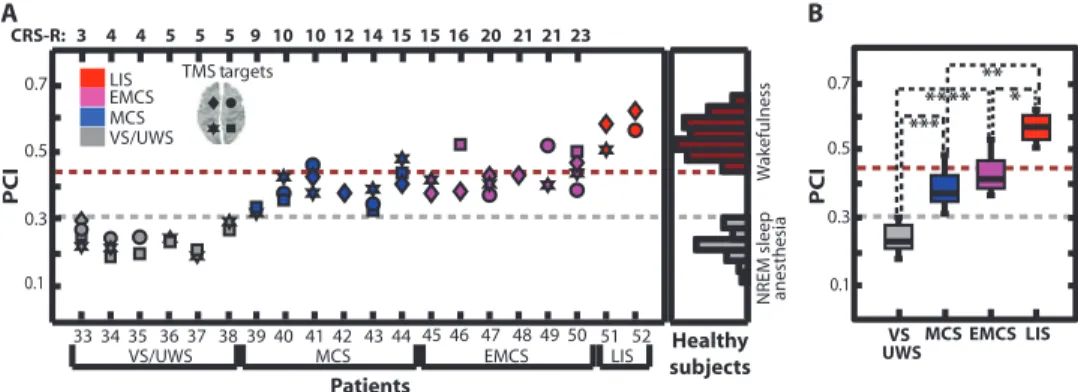
We directly compared the PCI values for individual TMS/hd-EEG sessions (N = 48 measurements) collected from 20 brain-injured pa-tients with the PCI values obtained from 32 individual healthy subjects (Fig. 5A). In six patients with a stable clinical diagnosis of vegetative
state [now called“unresponsive wakefulness syndrome” (VS/UWS)],
who were aroused but unaware, the PCI ranged from 0.19 to 0.31 (mean ± SD, 0.24 ± 0.04; N = 15), falling within the distribution (0.12 to 0.31)
observed in healthy subjects during NREM sleep and anesthesia. Con-versely, in two brain-injured patients who, at the time of recording, could communicate reliably only through vertical eye movements and who were diagnosed with locked-in syndrome (LIS), the PCI was as high as in healthy awake subjects (range, 0.51 to 0.62; mean ± SD, 0.57 ± 0.05; N = 4). We also calculated PCI in a group of 12 patients who had emerged from coma and attained an intermediate level of consciousness,
ac-cording to the coma recovery scale—revised (CRS-R) (30). Six of these
patients showed nonreflexive behaviors and satisfied the CRS-R criteria for a minimally conscious state (MCS), whereas another six patients recovered functional communication, despite severe motor and cog-nitive impairment, eventually emerging from the minimally conscious state (EMCS). PCI values in MCS patients ranged from 0.32 to 0.49 NREM sleep Midazolam
W
ak
efulness
NREM sleep anesthesia
A B TMS targets 80 165 TMS intensity Subjects (V/m) Xenon Propofol Wakefulness Conditions BA08 BA06 BA04 BA07 BA19 PCI PCI( t) Time (ms) C PCI( t) ∆ 0.4 0.6 0.2 Wakefulness NREM sleep/anesthesia Sessions (n) 1 2 3 4 5 6 7 8 9 10 11 12 13 14 15 16 17 18 19 20 0.4 0.6 21 22 23 24 25 26 27 28 29 30 31 32 0.2 50 100 150 200 250 5% 25% 15% 15 5 25 NREM sleep
Midazolam Xenon Propofol Wakefulness PCI 0.3 0.1 0.5 0.6 0.4 0.2 ∗∗ NREM sleep/anesthesia ∗∗ ∗ ∗ ∗ ∗ ∗ ∗∗∗
Fig. 3. PCI discriminates between consciousness and unconsciousness in healthy individuals. (A) PCI values for 152 sessions collected from 32 healthy subjects stimulated with TMS in various brain areas: superior occipital gyrus (BA19), middle superior frontal gyrus (BA08), superior parietal gyrus (BA07), rostral portion of the premotor cortex (BA06), and midline sensorimotor cortex (BA04) (represented by shape as indicated at bottom left) at differ-ent intensities (represdiffer-ented by color) and conditions (represdiffer-ented by the presence or absence of dark outline). The histograms on the right display the PCI distributions among subjects during alert wakefulness (dark gray bars) and loss of consciousness (light gray bars). (B) Box plots with the sta-tistical significance (asterisks) with respect to the wakefulness group (LMM:
*P = 10−13, **P = 10−19, ***P = 10−23). (C) The temporal evolution of PCI, PCI(t), was constructed by calculating the cumulative time series of the normalized Lempel-Ziv complexity of SS. The rate of complexity divergence between the conscious and unconscious groups,DPCI(t), was calculated from single-subject differences between the temporal evolution of PCI during wakefulness and loss of consciousness, with 25-ms time bins. Upper panel: Single-subject curves of PCI(t) calculated during both wakefulness (light red lines) and loss of con-sciousness (light gray lines). The dark gray and red lines represent averaged PCI(t). Lower panel: Percentages ofDPCI(t) generated in each temporal bin and the statistical significance (asterisks) with respect to the average value across bins (*P = 0.002, Mann-Whitney).
on August 16, 2013
stm.sciencemag.org
(mean ± SD, 0.39 ± 0.05; N = 15), and in all cases, PCI values were above the maximum values observed during physiological and pharmacological loss of consciousness. Similarly, in EMCS patients, PCI values were in-variably above the sleep/anesthesia–loss of consciousness distribution, with PCI ranging from 0.37 to 0.52 (mean ± SD, 0.43 ± 0.05; N = 14). We assessed the significance of the stimulation site and level of consciousness on PCI values (see Materials and Methods) and found that PCI was significantly affected by the patient’s level of conscious-ness (P = 3 × 10⁻⁸, F3,17.4= 42) and that there were no significant
effects of stimulation site on PCI values (P = 0.9, F3,37= 0.2). When
main effects were compared (Fig. 5B), MCS patients exhibited a mean PCI value significantly higher than that in VS/UWS patients (P = 2 × 10⁻⁵) and significantly lower than that in LIS patients (P = 0.0001). Similarly, PCI in EMCS patients was significantly higher than that
in VS/UWS patients (P = 8 × 10⁻⁷) and significantly lower than that
in LIS subjects (P = 0.002).
DISCUSSION
Here, we have developed and tested a theoretically based measure of consciousness, the PCI. Empirically, PCI provides a data-driven metric that can discriminate level of consciousness in single subjects under dif-ferent conditions: wakefulness; dreaming; the LIS; the MCS; the EMCS; intermediate levels of sedation; NREM sleep; midazolam-, xenon-, and propofol-induced loss of consciousness; and the vegetative/unresponsive wakefulness state.
Various brain-based empirical measures have been proposed as po-tential neurophysiological markers of the level of consciousness. These metrics belong to one of two general categories (13). The first embraces methods that aim to quantify the information or spectral content of brain signals, such as the approximate entropy (20), the spectral en-tropy (19), and the bispectral index [Aspect Medical System (31)]. The second category includes methods that evaluate the spatial extent or synchronization of brain activations, such as late event–related poten-tials (32), measures of effective connectivity derived from dynamic causal modeling analysis (33) or from TMS/EEG data (24, 34), and Granger causality and coherence analysis of electrophysiological (17) or metabolic time series (35). Although each of these metrics tends to show group-level differences between specific conditions in which con-sciousness is absent or present, they are less reliable when it comes to detecting reproducible and graded changes in single individuals under different conditions (sleep, anesthesia, and brain injury). For example, the bispectral index is widely variable among subjects and anesthetic agents (36) and cannot reliably discriminate between conscious and un-conscious brain-injured individuals (37); similarly, late event–related potentials, such as the mismatch negativity, P300 and P400, can be ab-sent in conscious subjects and preab-sent in unconscious subjects (38, 39). On the other hand, previous TMS/EEG measures of effective connec-tivity may discriminate between individual patients but are qualitative and insensitive to graded changes in the level of consciousness (24), whereas coherence and Granger causality can actually be increased during loss of consciousness induced by propofol anes-thesia (40, 41).
The index described here, PCI, gauges at once both the information content and the integration of the overall output of the corticothalamic system by measuring the algorithmic complexity of the brain’s response to a perturbation. Unlike other measures of complexity that are applied to spontaneous brain signals, PCI only assesses informa-tion that is generated through determinis-tic interactions within the thalamocordeterminis-tical system. In this way, the resulting measured complexity is minimally affected by ran-dom processes, such as noise and muscle activity, or by patterns that are not genu-inely integrated, such as those generated by isolated neuronal sources or common driv-ers. On the other hand, PCI is distinct
A Propofol anesthesia Sleep
PCI Subjects B Groups comparison Subject REM S1 NREM Wake 0.4 0.6 0.2 9 27 28 29 30 31 32 * ** Wakefulness Intermediate Deep
Fig. 4. PCI is sensitive to graded changes in the level of consciousness. (A) PCI calculated in six subjects (same subjects, 27 to 32, as Fig. 3A) during wakefulness, intermediate, and deep levels of anesthesia with propofol. Right: Box plots with the statistical significance between pairs of conditions (*P = 0.001, **P = 0.0004, repeated-measures ANOVA). (B) PCI calculated in one sub-ject (subsub-ject 9 in Fig. 3A) during wakefulness, sleep stage 1 (S1), NREM, and REM sleep. The gray and the red dashed lines represent the maximum complexity observed during unconsciousness (PCI = 0.31) and the minimum complexity observed during alert wakefulness (PCI = 0.44) across all subjects (Fig. 3A), respectively.
Healthy subjects A B TMS targets *** ** * Patients
VS/UWS MCS EMCS LIS
CRS-R: 3 4 4 5 5 5 9 10 10 12 14 15 15 16 20 21 21 23 LIS EMCS MCS VS/UWS W ak efulness NREM sleep VS MCS EMCS LIS PCI PCI **** 33 34 35 36 37 38 39 40 41 42 43 44 45 46 47 48 49 50 51 52 0.1 0.7 0.5 0.3 0.1 0.7 0.5 0.3 anesthesi a UWS
Fig. 5. PCI discriminates the level of consciousness in brain-injured patients. (A) PCI values for 48 TMS sessions collected from 20 severely brain-injured patients (TMS was targeted to both left and right BA08 and BA07, as indicated at top left). Right: Distribution of PCI values from healthy individuals. (B) Box plots for PCI in brain-injured patients with the statistical significance between pairs of conditions (LMM: *P = 0.002, **P = 0.0001, ***P = 2 × 10⁻⁵, ****P = 8 × 10⁻⁷). Gray and red dashed lines in (A) and (B) represent the maximum complexity observed during unconsciousness (PCI = 0.31) and the minimum complexity observed during alert wakefulness (PCI = 0.44) in healthy subjects, respectively.
on August 16, 2013
stm.sciencemag.org
from measures of integration that rely on the spread or synchroni-zation of neuronal activation because it is low when neural activa-tion is spatially extended but undifferentiated and stereotypical (Fig. 2). This aspect is relevant because hypersynchronous or widespread cor-tical activations can be observed when consciousness is lost during anesthesia (1, 41), NREM sleep (21, 42), and generalized seizures (43, 44).
As long as the initial perturbation triggered a significant response (fig. S2), PCI was reproducible within and across subjects and varied with the level of consciousness in a graded fashion (Figs. 3 and 4). PCI behaved in the same way whether loss of consciousness was caused by a physiological process (sleep) or by a pharmacological intervention with anesthetic agents (midazolam, xenon, and propofol) with differ-ent mechanisms of action, suggesting that our index captures a neural correlate of the level of consciousness that is general and reliable. No-tably, the rate at which PCI increased was reproducible within and across subjects and changed only when the level of consciousness was altered (Fig. 3C). Although immediately after TMS stimulation, PCI increased with similar rates in all consciousness states, values during wakefulness started to diverge from values during loss of consciousness about 100 ms after stimulation. These latencies are consistent with the time scale required to develop a conscious sensory experience (45) and with the time required to build up distributed causal interactions in thal-amocortical networks through feed-forward and reentrant connections (46, 47).
Many patients emerge from coma and exhibit signs of an interme-diate level of consciousness, ranging from simple visual fixation to a confused state in subjects with severe cognitive disability. Assessing consciousness in these patients can be particularly difficult because clinical signs are often fluctuating and unreliable and may be con-founded by reflexive motor activity (2, 48). Calculating PCI allowed comparison, in the same coordinate space, of individual brain-injured patients who emerged from coma with healthy subjects during con-scious wakefulness and loss of concon-sciousness (Fig. 5). In patients with a stable clinical diagnosis of a VS/UWS, PCI was as low as in healthy sleeping and anesthetized subjects, despite preserved levels of behav-ioral arousal. Conversely, PCI was as high as in healthy awake subjects in two brain-injured patients with LIS. Notably, the PCI in patients with MCS and EMCS tended to be lower than that observed in healthy awake subjects but was always above the highest value (0.31) found in conditions in which consciousness was unambiguously lost (NREM sleep, anesthesia, and VS). Thus, PCI differs from TMS/EEG measures of effective connectivity (24), which are unable to detect graded changes in the level of consciousness. On the other hand, the fact that PCI in MCS, EMCS, and LIS patients was invariably above the maximum val-ue detected during loss of consciousness distinguishes PCI from mea-sures of brain activation to sensory or verbal stimulation, which are characterized by a significant rate of false negatives in brain-injured pa-tients (18, 49, 50).
From a practical standpoint, PCI may permit the comparison of different subjects and different conditions within the same coordinate space. Most important, it can establish a reliable measurement scale by defining a range of values for various conditions in which conscious-ness is present (wakefulconscious-ness and dreaming) and absent (NREM sleep and different types of anesthesia). This is a key requirement for vali-dation of a neurophysiological marker that may then be applicable to single individuals whose level of consciousness is unknown, such as those with complete LIS, ambiguous noncommunicating brain-injured or
end-staged demented patients, catatonic psychiatric patients, and paralyzed subjects who are at risk of regaining awareness during surgical anes-thesia (1).
Although our study suggests that a high PCI value in a subject who is otherwise totally unable to interact with the external environment indicates that she or he is conscious, this conclusion is subject to lim-itations. One is the relatively small number of brain-injured patients (n = 20) that we have used for testing PCI. Further studies are needed to demonstrate that, in an independent, larger sample of patients who are clinically MCS, the PCI values are invariably distinguishable from those obtained from unconscious subjects. It will be equally important to verify in an independent sample that PCI values are high in subjects who are behaviorally unresponsive but conscious. Thus, PCI should be fur-ther tested in dissociated states, such as during dreaming and ketamine anesthesia, when subjects are conscious but temporarily disconnected from the external environment. PCI should also be validated in selected patients who are clinically VS but show consistent neural responses to verbal instructions (51).
An important caveat is that, although PCI does not depend on the cortical site of stimulation in healthy brains, it may be inaccurate in brain-injured patients when the TMS perturbation is applied to a struc-turally damaged portion of the cortical surface. PCI can be reliably calculated only if the TMS stimulation effectively elicits a significant cortical response (fig. S2). This problem can be avoided by using an imaging-guided TMS positioning system to avoid targeting damaged cortical sites.
Here, we have reported PCI, a potentially useful index of con-sciousness that evaluates the compressibility of the brain response to TMS, a perturbation that directly engages large portions of the thal-amocortical system (26, 52) without requiring the subjects to perform any sensory, motor, or cognitive task. In this way, the capacity for con-sciousness can be assessed on the basis of the complexity of cortical interactions, independent of the subjects’ capacity or willingness to re-act to external stimuli/commands. PCI is calculated from principles derived from theoretical neuroscience, and its apparent usefulness supports the notion that consciousness is linked to complexity, measured as the information content of distributed causal interac-tions in the brain (10, 15).
MATERIALS AND METHODS Study design
In this hypothesis-generating study, we tested a measure of complexity (PCI) based on 208 TMS/EEG measurements (N = 208) in 52 subjects (n = 52). To this aim, we adopted, in the first part of the study, a within-subject, open-label design to test for differences in PCI derived from TMS-EEG responses in healthy subjects. Here, we measured changes in PCI between the conscious (wakefulness) and the unconscious (sleep-and anesthesia-mediated loss of consciousness) conditions, thus creat-ing two reference data distributions obtained under systematically controlled conditions, in which the level of consciousness was known (n = 32; N = 152). In the second part of the study, we measured PCI differences in a cross-sectional, open-label design including different groups of chronic neurological patients (VS, MCS, EMCS, and LIS). Here, we assessed the reliability of the proposed index in discriminat-ing individuals with a stable clinical diagnosis (n = 20; N = 48) and compared the obtained results to the same frame of reference derived
on August 16, 2013
stm.sciencemag.org
from the first part of the study. For a detailed description of healthy subjects as well as patients’ selection criteria and group assignment, see the“Protocols” section.
Protocols
PCI was calculated on a data set recorded in previously published studies (24 subjects, 57 TMS/EEG measurements) as well as on a new-ly recorded data set (28 subjects, 151 TMS/EEG measurements). Spe-cifically, the data on sleep (subjects 9 to 14) were derived from studies by Massimini et al. (22, 53), the data on midazolam-induced loss of consciousness (subjects 15 to 20) were from a study by Ferrarelli et al. (23), and the data from brain-injured patients (patients 34 to 40, 42 to 44, and 51 to 52) were from a study by Rosanova et al. (24). Newly acquired data include control measurements during wakefulness (sub-jects 1 to 8); measurements during wakefulness and xenon anesthesia (subjects 21 to 26); measurements during wakefulness, propofol seda-tion, and anesthesia (subjects 27 to 32); and a subset of brain-injured patients (patients 33, 41, and 45 to 50). Below, we outline the specific protocols.
Control measurements in wakefulness (subjects 1 to 8). In
these experiments, performed on eight healthy subjects (three females, five males; age range, 23 to 46), several experimental parameters were varied systematically within and across individuals: site of stimulation, intensity of stimulation, and eyes opened/closed. In each subject, mul-tiple sessions of ~200 stimuli were collected with TMS targeted to the superior occipital gyrus (BA19), the middle superior frontal gyrus (BA08), the superior parietal gyrus (BA07), the rostral portion of the premotor cortex (BA06), and the midline sensorimotor cortex (BA04). The maximum electrical field at the cortical target was varied within the range 80 to 160 V/m. During the recordings, subjects were lying on an ergonomic chair and either looking at a fixation point on a screen (eyes open condition) or keeping their eyes closed. Data con-taminated by muscular artifacts or with a low signal-to-noise ratio were excluded, resulting in a total of 72 TMS sessions (see table S1, subjects 1 to 8). Protocol and informed consents were approved by the
local ethical committee (Ospedale“L. Sacco” in Milan, Italy).
Measurements in wakefulness and sleep (subjects 9 to 14). PCI was calculated on TMS/EEG data collected in six healthy subjects progressing from wakefulness to NREM sleep (22). In these experi-ments, the first TMS-EEG session (~250 stimuli) was acquired while the subjects were alert and relaxed, with their eyes opened. Stimuli were targeted to the rostral portion of the right premotor cortex (BA06), re-sulting in an electric field at the cortical target of about 90 V/m (see table S1, subjects 9 to 14). A second TMS-EEG session was collected, with the same stimulation intensity, after subjects entered a consolidated period (>5 min) of NREM sleep stage 3. In four of the six subjects, a third ses-sion was also recorded in which TMS was delivered at higher intensity (160 V/m) to the midline sensorimotor cortex (BA04). In one additional subject, TMS-evoked potentials were recorded during the transition from wakefulness through stage 1 to NREM (stages 2 and 3) and during REM sleep (53). Protocol and informed consents were approved by the local ethical committee (University of Wisconsin, Madison, WI).
Measurements in anesthesia (subjects 15 to 32).Midazolam
(subjects 15 to 20). PCI was calculated on TMS-evoked potentials ac-quired in six healthy subjects before and after midazolam-induced loss of consciousness (23). The first TMS-EEG session was collected in each subject before midazolam injection, with stimuli targeted to the rostral portion of the right premotor cortex (BA06) at an intensity of about
120 V/m while subjects were lying on a bed with eyes closed (see table S1, subjects 15 to 20). Midazolam was then given until the subject was un-responsive (level 1 of the MOAAS), with a maximum dose of 0.2 mg/kg. A second TMS session was then collected during loss of consciousness. Protocol and informed consents were approved by the local ethical com-mittee (University of Wisconsin, Madison, WI).
Xenon (subjects 21 to 26). Six healthy volunteers (two males, four females; mean age, 23; range, 18 to 28) participated in this study. The first TMS-EEG session was collected during wakefulness with stimuli targeted over the right motor cortex (BA04) at an intensity of about 100 V/m while subjects were lying on a bed with eyes open (see table S1, subjects 21 to 26). During a 40-min period, xenon was introduced pro-gressively by a certified anesthesiologist after performing a denitrogena-tion with 100% oxygen through a facial mask. Anesthesia was maintained with xenon (62.5 ± 2.5% in oxygen) with a closed-circuit anesthesia machine (PhysioFlex; Dräger Medical Deutschland GmbH). Subjects were ventilated with pressure control maintaining normocapnia and received between 24 and 32 liters of xenon in total. Stimulations with the same parameters as for wakefulness were then performed during loss of consciousness (level 1 of the MOAAS). Protocol and informed consents were approved by the local ethical committee of the Medi-cine Faculty of the University of Liège (Medical School of the Univer-sity of Liège, Belgium).
Propofol (subjects 27 to 32). Six healthy volunteers (three males, three females; mean age, 24; range, 20 to 27) participated in this study. In all subjects, TMS-EEG measurements were performed first during wake-fulness while subjects were lying on a bed with eyes open (see table S1, subjects 27 to 32) and then during an intermediate level of sedation (levels 2 to 3 of the MOAAS) followed by anesthesia with loss of con-sciousness (level 1 of the MOAAS). Across these conditions, TMS was targeted over the motor (BA04), premotor (BA06), parietal (BA07), and occipital (BA19) areas at an intensity of about 110 V/m. Propofol anes-thesia was induced by a certified anesthesiologist through an intra-venous catheter placed into a vein of the right hand or forearm. A second catheter was also placed into the opposite arm for blood sampling. Throughout the study, the subjects breathed spontaneously, and addi-tional oxygen (5 liters/min) was given through a loosely fitting plastic face mask. Anesthesia was obtained with a computer-controlled intra-venous infusion of propofol to obtain constant effect-site concentra-tions (Alaris TIVA; CareFusion). The propofol plasma and effect-site concentrations were estimated with a three-compartment pharmaco-kinetic model (29). Protocol and informed consents were approved by the local ethical committee of the Medicine Faculty of the University of Liège (Medical School of the University of Liège, Belgium).
Measurements in brain-injured patients (subjects 33 to 52). TMS/EEG measurements were performed in 20 brain-injured patients who, after a period in a coma, evolved toward various clinical condi-tions (table S2). These patients were repeatedly evaluated (four times, every other day) for a period of 1 week (evaluation week) by means of the CRS-R (30) to avoid diagnostic errors resulting from fluctuations in responsiveness and to obtain a stable clinical diagnosis. Six pa-tients showed only reflexive behavior and were diagnosed as being in a vegetative/unresponsive state (VS/UWS) during the four behavioral evaluations. Six patients were unable to communicate but showed signs of nonreflexive behaviors, such as visual tracking or responding to simple commands, and satisfied the CRS-R criteria for an MCS in at least three evaluations, including the one performed on the day of the TMS/EEG session. Six patients recovered functional communication, despite severe
on August 16, 2013
stm.sciencemag.org
motor and cognitive impairment, and were studied as they emerged from the minimally conscious state (EMCS). The two remaining patients could communicate reliably through eye movements and were diagnosed as affected by a LIS. In each patient, TMS was targeted to four cortical sites by means of the navigation system: the left and right medial third of the superior parietal gyrus (BA07) and the left and right medial third of the superior frontal gyrus (BA08). In practice, all four cortical sites were not always accessible in all subjects because of skull breaches and internal drain placement. In all cases, we avoided stimulating over cor-tical lesions that were clearly visible in computed tomography/magnetic resonance imaging scans because the EEG response of these areas may be absent or unreliable. The study was approved by the local ethical com-mittee of the Medicine Faculty of the University of Liège (Medical School of the University of Liège, Belgium) and by the local ethical committee of the European Foundation for Biomedical Research (FERB, Italy). Written informed consent was obtained by the patient’s legal surrogates as well as from the patients who retained functional communication. Extracting the deterministic patterns of cortical activation and calculating PCI
TMS-evoked potentials were recorded with a 60-channel TMS-compatible EEG amplifier, and stimuli were delivered by means of a Focal Bipulse 8-Coil, driven by a Mobile Stimulator Unit and combined with a
mag-netic resonance–guided navigation system as described (22, 26). The
primary electromagnetic sources of scalp EEG activity were localized by performing source modeling, and the responses of the brain were estimated by applying a nonparametric bootstrap-based statistical pro-cedure to TMS-evoked cortical currents (see the Supplementary Mate-rials for details on source modeling and statistics). In this way, a binary spatiotemporal distribution of significant sources [SS(x,t)] was calculated: SS(x,t) = 1 for significant sources (x) and time samples (t); SS(x,t) = 0 otherwise (Fig. 1). The matrix SS can be used to derive general indices of cortical responsiveness, such as the significant current density (SCD) and significant current scattering (SCS), estimating cortical reactivity and cortico-cortical connectivity, respectively (26). For the studies reported here, we applied the Lempel-Ziv measure of algorithmic complexity (27) to the binary matrix SS(x,t) to evaluate the information content of cortico-cortical causal interactions above and beyond the strength (SCD) or the
extent (SCS) of the response to TMS. The Lempel-Ziv complexity (cL)
approximates the amount of nonredundant information contained in a binary sequence of length L by estimating the minimal number of dif-ferent patterns necessary to describe the sequence. The asymptotic be-havior of this measure for random sequences is LH(L)/log2L, where H(L)
is the source entropy
HðLÞ ¼ −p1log2ðp1Þ − ð1 − p1Þlog2ð1 − p1Þ ð1Þ
and p1is the fraction of“1” contained in the binary sequence of length
L (27). We define the PCI as the normalized Lempel-Ziv complexity
cL¼ cL log2L
LHðLÞ ð2Þ
of the TMS-evoked spatiotemporal patterns of cortical activation, SS(x,t). The normalization of the Lempel-Ziv measure by the source entropy of SS(x,t) results in a complexity measure that is minimally
dependent on the total amount of significant activity and maximally dependent on the formation of patterns in the data. Asymptotically in L, PCI = 1 for maximally complex TMS-evoked potentials (see the Supplementary Materials for further details on calculating PCI). Statistical analysis
Statistical models. To assess significant effects on PCI values, the following models were implemented in SPSS v17.
Healthy subjects. Significant effects of the subject’s conditions and stimulation parameters on PCI values depicted in Fig. 3A were ac-cessed by LMMs. Estimation of fixed effects and covariance param-eters was performed with the restricted maximum likelihood (ReML) method. Null hypotheses were tested with type III F statistics and re-jected if P < 0.05. Main effects of multiple-level factors were compared, and normal-based 95% confidence intervals were adjusted with Bonferroni’s method. PCI values were initially modeled including fixed factors associated with stimulation site, stimulation intensity, and a binary classifier of subject’s conditions (wakefulness/loss of consciousness). The model also included a random factor associated with the intercept for each subject to handle the unbalanced repeated measures and a random subject-specific effect of loss of consciousness. This additional random factor allows the variance of PCI during wakefulness to differ from that during loss of consciousness. Finally, residual covariances were assumed to be diagonal and homogeneous. Because no significant effects of the stimulation parameters were observed, the model was restricted to the random factors and a single categorical fixed factor with one level for each condition: wakefulness, sleep, propofol, midazolam, and xenon (Fig. 3B).
Levels of propofol anesthesia. The balanced repeated-measures data depicted in Fig. 4A were analyzed by repeated-measures ANOVA to assess significant effects of different levels of propofol anesthesia. In ad-dition to normality, data were also tested for sphericity with Mauchly’s test (P = 0.3). Pairwise comparisons were adjusted with Bonferroni’s method.
Patients. PCI values in brain-injured patients (Fig. 5A) were mod-eled by an LMM, estimated by the ReML method and tested by type III F statistics. The model included a random intercept for each patient and two categorical fixed factors: stimulation site (BA08L, BA08R, BA07L,
and BA07R) and patient’s clinical diagnoses (VS, MCS, EMCS, and LIS).
Because no significant effect of site was observed, the model was restricted to the random intercept and the fixed factor associated to the clinical diagnoses (Fig. 5B). Main effects were compared, and normal-based 95% confidence intervals were adjusted with Bonferroni’s method.
All distributions of PCI values were tested for normality (P > 0.05) with the Shapiro-Wilk test.
Results.In the text, data are shown as means ± SD. In figures, box plots are depicted with sample minimum and maximum (vertical lines), lower and upper quartiles (boxes), and medians (horizontal lines).
SUPPLEMENTARY MATERIALS
www.sciencetranslationalmedicine.org/cgi/content/full/5/198/198ra105/DC1 Materials and Methods
Fig. S1. Strength, extent, and complexity of cortical responses to TMS. Fig. S2. Source entropy and signal-to-noise ratio for all TMS sessions. Fig. S3. Diagram of the Lempel-Ziv algorithm.
Fig. S4. TMS-evoked potentials in a single subject. Fig. S5. Correlation of PCI and PCIT.
on August 16, 2013
stm.sciencemag.org
Table S1. Stimulation parameters for TMS sessions during wakefulness. Table S2. Brain-injured patients.
References (54–61)
REFERENCES AND NOTES
1. M. T. Alkire, A. G. Hudetz, G. Tononi, Consciousness and anesthesia. Science 322, 876–880 (2008).
2. S. Laureys, A. M. Owen, N. D. Schiff, Brain function in coma, vegetative state, and related disorders. Lancet Neurol. 3, 537–546 (2004).
3. R. D. Sanders, G. Tononi, S. Laureys, J. W. Sleigh, Unresponsiveness≠ unconsciousness. Anesthesiology 116, 946–959 (2012).
4. S. Dehaene, J. P. Changeux, Experimental and theoretical approaches to conscious processing. Neuron 70, 200–227 (2011).
5. K. Friston, Beyond phrenology: What can neuroimaging tell us about distributed circuitry? Annu. Rev. Neurosci. 25, 221–250 (2002).
6. S. Laureys, The neural correlate of (un)awareness: Lessons from the vegetative state. Trends Cogn. Sci. 9, 556–559 (2005).
7. G. Tononi, C. Koch, The neural correlates of consciousness: An update. Ann. N. Y. Acad. Sci. 1124, 239–261 (2008).
8. A. K. Seth, E. Izhikevich, G. N. Reeke, G. M. Edelman, Theories and measures of consciousness: An extended framework. Proc. Natl. Acad. Sci. U.S.A. 103, 10799–10804 (2006).
9. O. Sporns, The human connectome: A complex network. Ann. N. Y. Acad. Sci. 1224, 109–125 (2011).
10. G. Tononi, An information integration theory of consciousness. BMC Neurosci. 5, 42 (2004). 11. G. Tononi, G. M. Edelman, Consciousness and complexity. Science 282, 1846–1851 (1998). 12. M. Boly, Measuring the fading consciousness in the human brain. Curr. Opin. Neurol. 24,
394–400 (2011).
13. A. K. Seth, Z. Dienes, A. Cleeremans, M. Overgaard, L. Pessoa, Measuring consciousness: Relating behavioural and neurophysiological approaches. Trends Cogn. Sci. 12, 314–321 (2008).
14. A. K. Seth, A. B. Barrett, L. Barnett, Causal density and integrated information as measures of conscious level. Philos. Trans. A Math. Phys. Eng. Sci. 369, 3748–3767 (2011). 15. G. Tononi, Consciousness as integrated information: A provisional manifesto. Biol. Bull.
215, 216–242 (2008).
16. G. Tononi, O. Sporns, G. M. Edelman, A measure for brain complexity: Relating functional segregation and integration in the nervous system. Proc. Natl. Acad. Sci. U.S.A. 91, 5033–5037 (1994).
17. A. K. Engel, W. Singer, Temporal binding and the neural correlates of sensory awareness. Trends Cogn. Sci. 5, 16–25 (2001).
18. B. Kotchoubey, Event-related potential measures of consciousness: Two equations with three unknowns. Prog. Brain Res. 150, 427–444 (2005).
19. R. W. Johnson, J. E. Shore, Relative-Entropy Minimization with Uncertain Constraints—Theory and
Application to Spectrum Analysis (Defense Technical Information Center, Washington, 1984). 20. S. M. Pincus, I. M. Gladstone, R. A. Ehrenkranz, A regularity statistic for medical data analysis.
J. Clin. Monit. 7, 335–345 (1991).
21. M. Massimini, F. Ferrarelli, S. K. Esser, B. A. Riedner, R. Huber, M. Murphy, M. J. Peterson, G. Tononi, Triggering sleep slow waves by transcranial magnetic stimulation. Proc. Natl. Acad. Sci. U.S.A. 104, 8496–8501 (2007).
22. M. Massimini, F. Ferrarelli, R. Huber, S. K. Esser, H. Singh, G. Tononi, Breakdown of cortical effective connectivity during sleep. Science 309, 2228–2232 (2005).
23. F. Ferrarelli, M. Massimini, S. Sarasso, A. Casali, B. A. Riedner, G. Angelini, G. Tononi, R. A. Pearce, Breakdown in cortical effective connectivity during midazolam-induced loss of consciousness. Proc. Natl. Acad. Sci. U.S.A. 107, 2681–2686 (2010).
24. M. Rosanova, O. Gosseries, S. Casarotto, M. Boly, A. G. Casali, M. A. Bruno, M. Mariotti, P. Boveroux, G. Tononi, S. Laureys, M. Massimini, Recovery of cortical effective connectivity and recovery of consciousness in vegetative patients. Brain 135, 1308–1320 (2012). 25. R. J. Ilmoniemi, J. Virtanen, J. Ruohonen, J. Karhu, H. J. Aronen, R. Näätänen, T. Katila, Neuronal
responses to magnetic stimulation reveal cortical reactivity and connectivity. Neuroreport 8, 3537–3540 (1997).
26. A. G. Casali, S. Casarotto, M. Rosanova, M. Mariotti, M. Massimini, General indices to charac-terize the electrical response of the cerebral cortex to TMS. Neuroimage 49, 1459–1468 (2010). 27. A. Lempel, J. Ziv, On the complexity of finite sequences. IEEE Trans. Inform. Theory 22, 75–81
(1976).
28. F. Kaspar, H. G. Schuster, Easily calculable measure for the complexity of spatiotemporal patterns. Phys. Rev. A 36, 842–848 (1987).
29. B. Marsh, M. White, N. Morton, G. N. Kenny, Pharmacokinetic model driven infusion of propofol in children. Br. J. Anaesth. 67, 41–48 (1991).
30. J. T. Giacino, K. Kalmar, J. Whyte, The JFK Coma Recovery Scale-Revised: Measurement characteristics and diagnostic utility. Arch. Phys. Med. Rehabil. 85, 2020–2029 (2004).
31. J. C. Sigl, N. G. Chamoun, An introduction to bispectral analysis for the electroencephalogram. J. Clin. Monit. 10, 392–404 (1994).
32. G. Plourde, T. W. Picton, Long-latency auditory evoked potentials during general anesthesia: N1 and P3 components. Anesth. Analg. 72, 342–350 (1991).
33. M. Boly, M. I. Garrido, O. Gosseries, M. A. Bruno, P. Boveroux, C. Schnakers, M. Massimini, V. Litvak, S. Laureys, K. Friston, Preserved feedforward but impaired top-down processes in the vegetative state. Science 332, 858–862 (2011).
34. A. Ragazzoni, C. Pirulli, D. Veniero, M. Feurra, M. Cincotta, F. Giovannelli, R. Chiaramonti, M. Lino, S. Rossi, C. Miniussi, Vegetative versus minimally conscious states: A study using TMS-EEG, sensory and event-related potentials. PLoS One 8, e57069 (2013). 35. A. Vanhaudenhuyse, Q. Noirhomme, L. J. Tshibanda, M. A. Bruno, P. Boveroux, C. Schnakers,
A. Soddu, V. Perlbarg, D. Ledoux, J. F. Brichant, G. Moonen, P. Maquet, M. D. Greicius, S. Laureys, M. Boly, Default network connectivity reflects the level of consciousness in non-communicative brain-damaged patients. Brain 133, 161–171 (2010).
36. K. Kaskinoro, A. Maksimow, J. Långsjö, R. Aantaa, S. Jääskeläinen, K. Kaisti, M. Särkelä, H. Scheinin, Wide inter-individual variability of bispectral index and spectral entropy at loss of consciousness during increasing concentrations of dexmedetomidine, propofol, and sevoflurane. Br. J. Anaesth. 107, 573–580 (2011).
37. C. Schnakers, S. Majerus, S. Laureys, Bispectral analysis of electroencephalogram signals during recovery from coma: Preliminary findings. Neuropsychol. Rehabil. 15, 381–388 (2005). 38. C. Fischer, J. Luaute, D. Morlet, Event-related potentials (MMN and novelty P3) in perma-nent vegetative or minimally conscious states. Clin. Neurophysiol. 121, 1032–1042 (2010). 39. Y. Höller, J. Bergmann, M. Kronbichler, J. S. Crone, E. V. Schmid, S. Golaszewski, G. Ladurner, Preserved oscillatory response but lack of mismatch negativity in patients with disorders of consciousness. Clin. Neurophysiol. 122, 1744–1754 (2011).
40. A. B. Barrett, M. Murphy, M. A. Bruno, Q. Noirhomme, M. Boly, S. Laureys, A. K. Seth, Granger causality analysis of steady-state electroencephalographic signals during propofol-induced an-aesthesia. PLoS One 7, e29072 (2012).
41. G. G. Supp, M. Siegel, J. F. Hipp, A. K. Engel, Cortical hypersynchrony predicts breakdown of sensory processing during loss of consciousness. Curr. Biol. 21, 1988–1993 (2011). 42. P. Achermann, A. A. Borbely, Temporal evolution of coherence and power in the human
sleep electroencephalogram. J. Sleep Res. 7 (Suppl. 1), 36–41 (1998).
43. M. Arthuis, L. Valton, J. Régis, P. Chauvel, F. Wendling, L. Naccache, C. Bernard, F. Bartolomei, Impaired consciousness during temporal lobe seizures is related to increased long-distance cortical–subcortical synchronization. Brain 132, 2091–2101 (2009).
44. H. Blumenfeld, M. Westerveld, R. B. Ostroff, S. D. Vanderhill, J. Freeman, A. Necochea, P. Uranga, T. Tanhehco, A. Smith, J. P. Seibyl, R. Stokking, C. Studholme, S. S. Spencer, I. G. Zubal, Selective frontal, parietal, and temporal networks in generalized seizures. Neuroimage 19, 1556–1566 (2003).
45. T. Bachmann, Microgenetic Approach to the Conscious Mind (John Benjamins, Amsterdam, 2000).
46. C. N. Boehler, M. A. Schoenfeld, H. J. Heinze, J. M. Hopf, Rapid recurrent processing gates awareness in primary visual cortex. Proc. Natl. Acad. Sci. U.S.A. 105, 8742–8747 (2008). 47. V. A. F. Lamme, P. R. Roelfsema, The distinct modes of vision offered by feedforward and
recurrent processing. Trends Neurosci. 23, 571–579 (2000).
48. S. Majerus, H. Gill-Thwaites, K. Andrews, S. Laureys, Behavioral evaluation of consciousness in severe brain damage. Prog. Brain Res. 150, 397–413 (2005).
49. J. C. Bardin, J. J. Fins, D. I. Katz, J. Hersh, L. A. Heier, K. Tabelow, J. P. Dyke, D. J. Ballon, N. D. Schiff, H. U. Voss, Dissociations between behavioural and functional magnetic resonance imaging-based evaluations of cognitive function after brain injury. Brain 134, 769–782 (2011). 50. M. M. Monti, M. R. Coleman, A. M. Owen, Neuroimaging and the vegetative state: Resolving
the behavioral assessment dilemma? Ann. N. Y. Acad. Sci. 1157, 81–89 (2009).
51. A. M. Owen, M. R. Coleman, M. Boly, M. H. Davis, S. Laureys, J. D. Pickard, Detecting aware-ness in the vegetative state. Science 313, 1402 (2006).
52. M. Rosanova, A. Casali, V. Bellina, F. Resta, M. Mariotti, M. Massimini, Natural frequencies of human corticothalamic circuits. J. Neurosci. 29, 7679–7685 (2009).
53. M. Massimini, F. Ferrarelli, M. Murphy, R. Huber, B. Riedner, S. Casarotto, G. Tononi, Cortical reactivity and effective connectivity during REM sleep in humans. Cogn. Neurosci. 1, 176–183 (2010).
54. P. Berg, M. Scherg, A fast method for forward computation of multiple-shell spherical head models. Electroencephalogr. Clin. Neurophysiol. 90, 58–64 (1994).
55. Z. Zhang, A fast method to compute surface potentials generated by dipoles within mul-tilayer anisotropic spheres. Phys. Med. Biol. 40, 335–349 (1995).
56. K. Friston, R. Henson, C. Phillips, J. Mattout, Bayesian estimation of evoked and induced responses. Hum. Brain Mapp. 27, 722–735 (2006).
57. J. Mattout, C. Phillips, W. D. Penny, M. D. Rugg, K. J. Friston, MEG source localization under multiple constraints: An extended Bayesian framework. Neuroimage 30, 753–767 (2006). 58. C. Phillips, J. Mattout, M. D. Rugg, P. Maquet, K. J. Friston, An empirical Bayesian solution to
the source reconstruction problem in EEG. Neuroimage 24, 997–1011 (2005). 59. J. Lv, D. M. Simpson, S. L. Bell, Objective detection of evoked potentials using a bootstrap
technique. Med. Eng. Phys. 29, 191–198 (2007).
on August 16, 2013
stm.sciencemag.org
60. D. Pantazis, T. E. Nichols, S. Baillet, R. M. Leahy, A comparison of random field theory and permutation methods for the statistical analysis of MEG data. Neuroimage 25, 383–394 (2005). 61. M. Li, P. Vitányi, An Introduction to Kolmogorov Complexity and Its Applications (Springer,
New York, ed. 3, 2008).
Acknowledgments: We thank T. D’Oliveira Silva for technical contributions and suggestions for the implementation of the Lempel-Ziv algorithm, M. Mariotti for administrative supervision of control experiments in healthy subjects, J.-F. Brichant for administrative supervision of propofol and xenon studies, P. Boveroux and D. Ledoux for their help in patients’ medical assist-ance during the experiments, S. Rex and R. Rossaint for providing xenon material, and F. Ferrarelli for his contribution in the acquisition of midazolam data. Funding: This study was funded by the Belgian National Funds for Scientific Research (FNRS), EU grant FP7-ICT-2011-9, n. 600806“Corticonics”; PUR 2009 and“Dote ricerca”: FSE, Regione Lombardia (University of Milan); Prin2008 (Italian Gov-ernment); Fonds Léon Fredericq, James S. McDonnell Foundation; Mind Science Foundation; European Commission (Mindbridge, DISCOS, DECODER & COST); Concerted Research Action (ARC 06/11-340); Public Utility Foundation“Université Européenne du Travail”; and “Fondazione Europea di Ricerca Biomedica.” O.G., M.B., and M.-A.B. are Postdoctoral Fellows and S.L. is Research Director
at FNRS. Author contributions: Conception and design of PCI: A.G.C. and M.M.; experimental design for sleep and midazolam: G.T. and M.M.; experimental design for propofol, xenon, and pa-tients: O.G., M.R., S.L., and M.M.; clinical evaluation of papa-tients: O.G.; experimental execution for sleep and midazolam: S.S., G.T., and M.M.; experimental execution for propofol, xenon, and pa-tients: O.G., M.R., M.B., S.C., M.-A.B., S.L., and M.M.; data analysis: A.G.C., O.G., M.R., M.B., S.S., K.R.C., and S.C.; wrote the paper: A.G.C., G.T., and M.M. Competing interests: The authors declare that they have no competing interests.
Submitted 3 April 2013 Accepted 10 June 2013 Published 14 August 2013 10.1126/scitranslmed.3006294
Citation: A. G. Casali, O. Gosseries, M. Rosanova, M. Boly, S. Sarasso, K. R. Casali, S. Casarotto, M.-A. Bruno, S. Laureys, G. Tononi, M. Massimini, A theoretically based index of consciousness independent of sensory processing and behavior. Sci. Transl. Med. 5, 198ra105 (2013).
on August 16, 2013
stm.sciencemag.org