V
IBRATION-B
ASEDD
AMAGED
ETECTIONU
NDERC
HANGINGE
NVIRONMENTALC
ONDITIONSA.M. Yan, G. Kerschen, P. De Boe, J.C Golinval
University of Liège, Liège, Belgium [email protected] [email protected] Abstract
A method is proposed to perform structural health monitoring under varying environmental and operational conditions. The method is based on principal component analysis (PCA) applied to a data set containing vibration characteristics identified during the monitoring of the structure. The advantage of the method is that it does not require the measurement of environmental parameters that are taken into account as embedded variables. As the influence of environmental effects may be effectively eliminated, the residual error of the PCA prediction model remains small if the structure is healthy, and increases significantly when structural damage occurs. Novelty analysis on the residual errors provides a statistical indication of damage. The PCA-based damage detection method is illustrated using experimental data. It will also be shown that when the relationship between the vibration characteristics becomes nonlinear, PCA is advantageously replaced by one of its nonlinear generalizations.
Introduction
Vibration-based structural health monitoring consists in detecting damage in structures from changes in some of their features that are extracted from vibration data. For example, damage may be characterized by changes in the modal parameters, i.e. natural frequencies, modal damping ratios and mode shapes. There is also a large amount of research using other damage-sensitive features without the need to identify the modal parameters, such as novelty analysis with auto-regressive models (Worden
et al., 2000; Sohn and Farrar, 2000), χ²-test based on realization analysis (Basseville et al., 2000), and more recently a novelty analysis based on a Kalman model (Yan et al., 2004a).
In most of the previous analyses, vibration characteristics of structures were estimated with the assumption of a constant environment. However, in practical situations, structures are often subject to changes in environmental and operational conditions (e.g. temperature, temperature gradients, humidity, wind, traffic, etc.), which may mask the changes caused by structural damages. If the effect of these environmental conditions is not taken into account in the damage detection process, false-positive or negative damage diagnosis may occur so that vibration-based health monitoring becomes unreliable. Accordingly, during the last years, structural dynamicists have become increasingly concerned with modal parameter variability due to environmental conditions (see for instance Wahab and De Roeck, 1997; Kullaa, 2001; Sohn et al., 2001; Ko et al., 2003)
Sohn et al. (2001) have trained an auto-associative neural network using data measured in varying environmental conditions. In this method, target outputs correspond to the inputs of the network, and the bottleneck layer captures the embedded environmental factors. The method has been used to analyze a simulated computer hard disk drive and the vibration features were chosen to be the coefficients
of the transfer function. Kullaa (2001) has applied a linear factor analysis consisting of an iterative process to eliminate environmental and operational effects from the health monitoring system. In this case, natural frequencies are taken as vibration features. The method was tested using simulated data and applied to a laboratory experiment. The key advantage of these two methodologies is that the measurement of the environmental variables is not required, and the underlying physical quantities do not need to be known. Instead, environmental effects are treated as embedded variables.
In this study, an alternative approach to the second method is proposed based upon principal component analysis (PCA). The basic idea is that the changes in the measured features due to environmental variations may be taken into account using PCA. A further assumption is that they are different from those due to structural damage; it is therefore possible to make a distinction between them. To this end, the prediction errors of the PCA model may serve as damage indicator, and novelty analysis is adopted to decide whether the features indicate departure from previously estimated normal conditions or not. It is noted that when the relationship between the vibration characteristics becomes nonlinear, PCA is advantageously replaced by one of its nonlinear generalizations called vector quantization principal component analysis (VQPCA).
Principal Component Analysis
Methodology
PCA is a multivariate statistical method, also known as Karhunen-Loève transform or proper orthogonal decomposition. In the present work, it will be shown that this technique is useful for eliminating environmental effects in a damage detection context.
Changes in environmental conditions (e.g. temperature, temperature gradients, humidity, wind, etc.) are known to have considerable effects on the measured vibration features. Most of the time, environmental variables are not measured but their effects are merely observed from the variation of the measured features. Let us denote by the n-dimensional vector yk a set of vibration features identified at time tk,
(k=1…N), N being the number of samplings. All the samples are collected in a (nxN) matrix Y. If the natural frequencies are chosen as features, n represents the number of selected modes. PCA provides a linear mapping of data from the original dimension n to a lower dimension m:
=
X T Y (1)
where X (mxN) is called the score matrix and T (mxn) the loading matrix; the dimension m may be thought as the physical order of the system which corresponds here to the number of combined environmental factors that affect the features. Such a dimension reduction process forces the system to learn the inherent variables driving changes of the features and to capture the embedded relation between the environmental factors and the features.
Generally, matrix T may be calculated by extracting m eigenvectors of the covariance matrix of Y which are associated with the largest eigenvalues. Alternatively, a more practical method is to perform singular value decomposition of the covariance matrix:
where T = Σ2 YY U UT 1 2 0 0 ⎡Σ ⎤ Σ = ⎢ Σ ⎥ ⎣ ⎦ (2)
where U is an orthonormal matrix, the columns of which define the principal components and form a subspace spanning the data; the singular values given by the diagonal terms of matrix Σ represent the active energy of the associated principal components. By definition,
Σ
1=diag (σ
1,σ
2,, …,σ
m) andΣ
2=diag (σ
m+1,σ
m+2, …,σ
n)and the singular values are written in decreasing order
σ1 ≥ σ2≥ …≥ σm >> σm+1 ≥ …≥σn → 0 (3)
In most practical situations, the elements of
Σ
2 are assumed to be small with respect tothe elements of
Σ
1, but they are not equal to zero due to the effect of noise and/or tothe presence of nonlinearity. The reason is that among all the possible environmental factors, only a few of them, say m factors, have a strong influence on the vibration features and have to be considered. The other factors whose influence is negligible (e.g. noise) may be discarded. In practice, temperature might be the only significant environmental factor, which means that m is equal to 1.
According to PCA, the vibration features of the structure mainly vary along the directions of the principal components associated with the highest energies. In other words, the vibration features approximately remain in the hyperplane defined by the
m principal components adopted. However, the selection of an appropriate dimension
m is not so critical as it appears. As we are considering the relative change of this hyperplane from the reference to the current state, it is possible to obtain stable monitoring results with different values of the order m. In practical applications where the number of environmental factors is not known a priori or difficult to find by observing the singular values, the procedure can be repeated for several values of m. From the above analysis, the first m columns of U may be used to build matrix T in equation (1) in order to project the measured features onto the environmental-factor characterized space. The loss of information in the projection can be assessed by re-mapping the projected data back to the original space
T T
ˆ = =
Y T X T T Y (4)
The residual error matrix E is estimated as ˆ =
-E Y Y (5)
In the present work, the residual errors are used as damage indicator. From the prediction error vector Ek obtained at time tk, the Novelty Index (NI) (see Worden et
E
k
NI = Ek (6)
or the Mahalanobis norm
M T 1
k k
NI = E R E−
k (7)
where R=YYT/N is the covariance matrix of the features. If it is further assumed that
the Euclidean or Mahalanobis indices are normally distributed, statistical analysis may be performed. Defining NI and σ as the mean value and standard deviation of
NI for the prediction in the reference state, an X-bar control chart (Sohn and Farrar,
2000) is constructed by drawing a centerline (CL) at NI and two additional horizontal lines corresponding to the upper and lower control limits (UCL and LCL) versus the identification numbers. In the present work, the control limits are defined as follows:
CL NI= (8)
UCL NI= + ασ (9)
LCL NI= − ασ (10)
where coefficient α is taken equal to 3, which corresponds to a confidence interval of 99.7% if a normal distribution is assumed. Outlier statistics allows to count how many prediction errors (in percentage of the total number of identifications) overpass the upper limit. In the absence of damage, the vibration features corresponding to the current data should lie in the hyperplane spanned by the vibration features corresponding to the reference data. The outlier statistics value of the current data should thus remain at the same level as for the reference data. Conversely, structural damage should cause a departure from the original hyperplane, and the outlier statistics of the damaged state should increase significantly. In addition, the ratio
NId/NIr (d and r denote the damaged and reference states, respectively) may also be
used as a quantitative indicator of damage level. Whereas NId/NIr →1 means no
damage, a relatively large ratio NId/NIr corresponds to the opposite situation.
Geometric Interpretation
To illustrate the method, a geometric interpretation is presented in the two-dimensional (n=2) case, i.e. when two features y1 and y2 are considered. As shown in
Figure 1, the features for the reference data set (represented by circles) are distributed around their geometric center (point O’). It is assumed here that environmental variations are responsible for the dispersion of the features. The application of PCA to this data set gives two principal components, namely PC-I and PC-II. PC-I is associated to the highest level of energy and is responsible for the biggest variation of the features; it corresponds to the main environmental factor or to a combined effect of several factors. PC-II represents the effect of secondary factors.
If point Y is considered, the first step is to project it according to equation (1) onto the one-dimensional space spanned by PC-I. The result is a scalar equal to the length of segment OX1. Re-mapping this data point back to the original two-dimensional space
results in point Y1, and the corresponding residual error is measured by the length of
segment .
Let us now examine the features identified from a damaged structure (indicated by a
1
symbol ‘×’). It is emphasized that the changes due to structural damage are assumed to be different from those due to environmental effects; some overlapping, however, is possible as illustrated in Figure 1. Taking point Z as an example, it can be observed that the residual error ( ) increases significantly with respect to . In such a comparison between healthy and damaged states, the effect of the environmental factors has been approximately eliminated.
It should be pointed out that the application of PCA generally requires a data normalization procedure in order to deal with variables with a zero-mean and a unitary standard deviation. The normalization should not be performed in the present case; the reader is referred to Yan et al. (2004b) for a more detailed discussion.
1
Y ZJJJG Y YJJJG1
Experimental Application: One year monitoring of the Z24 bridge
This in-situ experiment was conducted in the framework of the BRITE-EURAM program CT96 0277 SIMCES. The Z24-bridge is located in Switzerland; it is a classical post-tensioned concrete box girder bridge with a main span of 30 meters and 2 side-spans of 14 meters. The bridge was monitored during 305 days from November 1997 until September 1998. 49 sensors were used to capture various environmental parameters (temperature, wind characteristics, humidity, etc.). During the monitoring period, the bridge was subjected to a series of realistic damage cases. Vibration measurements were gathered every hour using accelerometers, and modal parameters were identified automatically and examined (see Peeters and De Roeck, 2000). A close look at the identified vibration features in Figure 2 reveals that the natural frequencies of the first four modes vary significantly with temperature, which is assumed to be the environmental factor responsible for most of the observed variation.
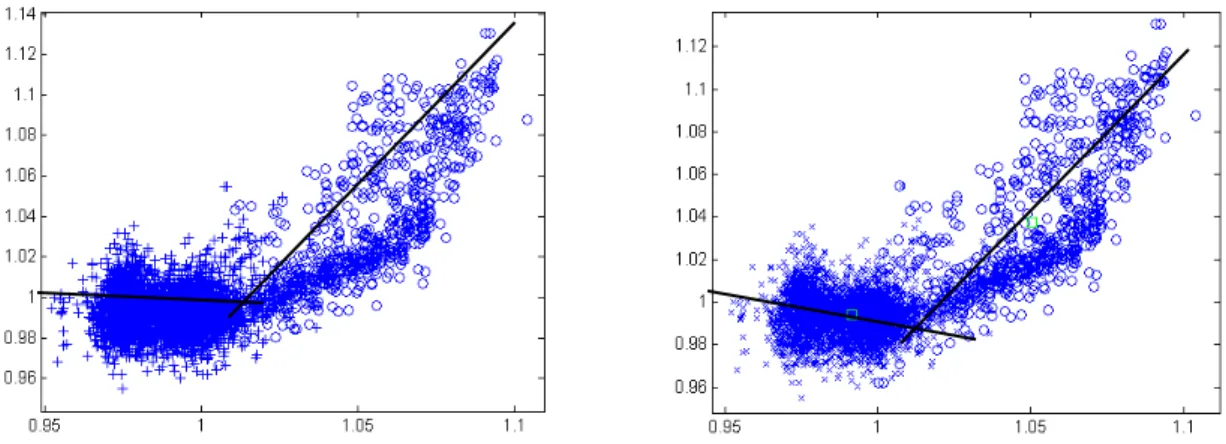
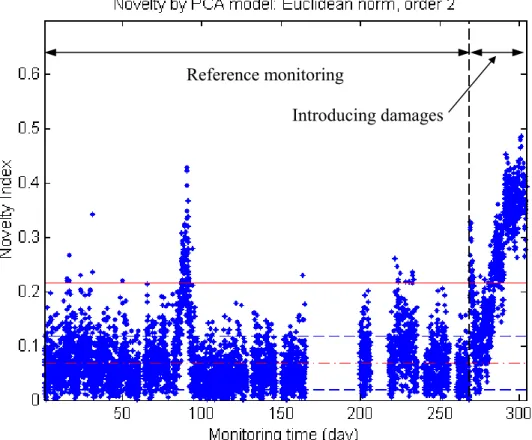
Let us now apply the proposed PCA-based damage detection method. Numerical tests showed that the choice of two principal components (i.e. m =2) is adequate. The results of damage detection are shown in Figures 4a and 4b. They are quite satisfactory as the introduced various damages are well detected. However, an abnormality appears between the 80th and 90th days, during which very cold weather caused freezing of the asphalt layer on the bridge surface. It was found that the asphalt layer behaves differently during warm and cold periods, which is responsible for the presence of nonlinear effects. The relationship between natural frequencies is almost bilinear as depicted in Figure 3, the inflexion point corresponding to a temperature near 0°C.
At this point, it is important to recall that PCA is in essence a linear technique, i.e. it minimizes the average squared distance between the original data and their reduced linear representation. To address this issue, researchers in statistics and in the neural network community have developed nonlinear extensions of PCA.
In order to improve the results given by PCA, our attention was then focused on a local variant of PCA called vector quantization principal component analysis (VQPCA). VQPCA involves a two-step procedure, namely a clustering of the data space into several regions and the application of PCA within each local region. The detailed description of this technique is beyond the scope of this paper, and the reader
is referred to Kambhatla and Leen (1997) or Kerschen and Golinval (2002) for a more detailed discussion.
Due to the bilinear characteristic of the data, the space containing the natural frequencies was divided in two regions, and PCA was performed within each sub-region. The results obtained using VQPCA are presented in Figures 5a and 5b. The comparison with PCA indicates two improvements:
• The abnormality which was appearing between the 80th and 90th days has disappeared as the nonlinearity is now taken into account by VQPCA;
• The damage detection method based upon VQPCA is more sensitive to potential damage. Indeed, the values of NI for the damage states (i.e. between the 269th and 305th days) are greater than those given by PCA for the same period.
Conclusions
The purpose of this paper was to perform structural damage diagnosis under changing environmental conditions. In a first step, PCA is applied to reference data assumed to be healthy in order to capture the implicit effects of environmental variation on the features. In a linear or weakly nonlinear case, the number of dominant principal components should approximately correspond to the number of independent and influent environmental factors. In a second step, PCA is applied to a data set representing the current structural state. Under the assumption that the changes due to structural damage are different from those due to environmental variation, the residual error should increase significantly in the presence of structural damage.
The advantage of the method relies in its simplicity and efficiency. The measurement of environmental parameters is not needed, which renders structural health monitoring very convenient. The application of the method to experimental data has shown that environmental effects were successfully eliminated and that the different levels of damage were well detected.
A possible limitation of PCA exists when the relationship between the measured features becomes nonlinear. In this case, PCA is advantageously replaced by one of its nonlinear generalizations called VQPCA.
Acknowledgements
This work is supported by a grant from the Walloon government of Belgium as part of the research convention n° 9613419. The author G. Kerschen is supported by a grant from the Belgian National Fund for Scientific Research (FNRS) which is gratefully acknowledged. The authors would like also to acknowledge Dr. Peeters (LMS International, Belgium) and Prof. De Roeck (K. U. Leuven, Belgium) for providing the experimental data on the Z24-bridge.
References
Basseville, M., M. Abdelghani, and A. Benveniste (2000), “Subspace-based Fault Detection Algorithms for Vibration Monitoring,” Automatica 36. 101-109.
Kambhatla, N., and T.K. Leen (1997), “Dimension reduction by local PCA,” Neural Computation, 9, 1-17.
Kerschen, G, and J. C. Golinval (2002), “Nonlinear Generalization of Principal Component Analysis: From a Global to a Local Approach,” Journal of Sound and Vibration, 254, 867-876.
Ko, J.M., K.K. Chak, J.Y. Wang, Y.Q. Ni, and T.H.T. Chan (2003) “Formulation of an Uncertainty Model Relating Modal Parameters and Environmental Factors by using Long-Term Monitoring Data,” Smart Systems and Nondestructive Evaluation for Civil Infrastructures, S.-C. Liu (ed.), SPIE Vol. 5057.
Kullaa, J. (2001), “Elimination of Environmental Influences from Damage-Sensitive Features in a Structural Health Monitoring System” Structural health monitoring – the demands and challenges, edited by Fu-Kuo Chang, CRC Press, 742-749.
Peeters, B., and G. De Roeck (2000), “One Year Monitoring of the Z24-bridge: Environmental Influences versus Damage Events,” Proceedings of IMAC XVIII, San Antonio, TX, 1570-1576. Sohn, H. and C.F. Farrar (2000), “Damage Diagnosis using Time Series Analysis of Vibration
Signals,” Smart Materials and Structures, 10, 1-6.
Sohn, H., K. Worden, and C.F. Farrar (2001), “Novelty Detection under Changing Environmental Conditions,” SPIE’s 8th Annual International Symposium on Smart Structures and Materials, Newport Beach, CA.
Wahab, A.M., and G. De Roeck (1997), “Effect of Temperature on Dynamic System Parameters of a Highway Bridge,” Structural Engineering International, 7, 266-270.
Worden, K., G. Manson, and N.R.J. Fieller (2000), “Damage Detection using Outlier Analysis,” Journal of Sound and Vibration, 229, 647-667.
Yan, A.M., P. De Boe, and J. C. Golinval (2004a), “Structural Damage Diagnosis by Kalman Model based on Stochastic Subspace Identification,” Accepted for publication in Structural Health Monitoring.
Yan, A.M., G. Kerschen, P. De Boe, and J. C. Golinval (2004b), “Structural Damage Diagnosis under Changing Environmental Conditions – Part I : Linear Analysis,” Submitted for publication in Mechanical Systems and Signal Processing.
Yan, A.M., G. Kerschen, P. De Boe, and J. C. Golinval (2004c), “Structural Damage Diagnosis under Changing Environmental Conditions – Part II : local PCA for nonlinear cases,” Submitted for publication in Mechanical Systems and Signal Processing.
O O’ Y X1 (Y1) X2
×
PC IIy2
Zy1
PC-I× ×
×
×
×
×
× ×
×
×
×
× ×
×
×
×
×
C B A×
Figure 1. Geometric interpretation
Mode 4 Mode 2
Mode 1
Mode 3
Figure 2. Time-variations of the natural frequencies of the first four modes
Figure 3. Projection on a two-dimensional plane of the space containing the natural frequencies
Figure 4a. PCA for damage detection of Z24-bridge Reference monitoring Introducing damages Reference Settlement Installation Settlement of Pier 2-9.5 cm Tilt of foundation Concrete spalling Landslide Anchor head failure Settlement removal Concrete hinge failure Outlier limit
Average and Variation (95% confidence) of ref. data
Reference monitoring
Introducing damages
Figure 5a. Local PCA for damage detection of Z24-bridge (two sub-regions)
Reference Settlement Installation Settlement of Pier 2-9.5 cm Tilt of foundation Concrete spalling Landslide Tendons rupture Settlement removal Concrete hinge failure Anchor head failure Outlier limit
Average and Variation (95% confidence) of ref. data