Université de Montréal
Localisation d’un locus pour trait quantitif pour l’hypertension sur le chromosome 2 du rat DahI.
Présenté par
Vasiliki Eliopoulos
Programme de biologie moléculaire Faculté des études supérieures
Mémoire présenté à la Faculté des études supérieures En vuede l’obtention du grade de Maître ès sciences (M.Sc.)
Mars2006
dl1
de Montréal
Direction des bibliothèques
AVIS
L’auteur a autorisé l’Université de Montréal à reproduire et diffuser, en totalité ou en partie, par quelque moyen que ce soit et sur quelque support que ce soit, et exclusivement à des fins non lucratives d’enseignement et de recherche, des copies de ce mémoire ou de cette thèse.
L’auteur et les coauteurs le cas échéant conservent la propriété du droit d’auteur et des droits moraux qui protègent ce document. Ni la thèse ou le mémoire, ni des extraits substantiels de ce document, ne doivent être imprimés ou autrement reproduits sans l’autorisation de l’auteur.
Afin de se conformer à la Loi canadienne sur la protection des renseignements personnels, quelques formulaires secondaires, coordonnées ou signatures intégrées au texte ont pu être enlevés de ce document. Bien que cela ait pu affecter la pagination, il n’y a aucun contenu manquant.
NOTICE
The author of this thesis or dissertation has granted a nonexclusive license allowing Université de Montréal to reptoduce and publish the document, in part or in whole, and in any format, solely for noncommercial educational and research purposes.
The author and co-authors if applicable retain copyright ownership and moral rights in this document. Neither the whole thesis or dissertation, nor substantial extracts from it, may be printed or otherwise reproduced without the author’s permission.
In compliance with the Canadian Privacy Act some supporting forms, contact information or signatures may have been removed from the document. While this may affect the document page count, it does flot represent any loss of content from the document.
Ce mémoire intitulé
Localisation d’un locus pour trait quantitif pour l’hypertension sur
le chromosome 2 du rat Dahi.
Présenté par
Vasiliki Eliopoulos
a été évalué par unjury composé des personnes suivantes:
Isabelle Royal président-rapporteur AlanY. Deng Directeur de Recherche John White Membre de jury
L’hypertension essentielle constitue un facteur de risque important pour les maladies cardiovasculaires et affecte aussi un grand pourcentage de la population humaine. La pression artérielle (PA) chez les animaux est influencée à la fois par des facteurs génétiques et environnementaux. L’hypertension est définie en génétique comme étant un trait quantitatif et multifactoriel sous contrôle polygénique. Nos études antérieures par analyse de liaison ont suggéré la présence d’un locus pour trait quantitatif (QTL) associé à la pression artérielle sur le chromosome 2. Notre objectif était de vérifier ces résultats à l’aide de modèles animaux congéniques.
Afin d’étudier l’hypertension dans un environnement homogène, nous utilisons des souches de rats co-sanguines, où tous les animaux sont génétiquement identiques. Des lignées congéniques sont construites par une série de croisements entre le rat S (Dahl sait-sensitive hypertendu) et le rat L (rat Lewis nonriotendu). Ceci résulte en une souche congénique dont le génome piovient de la souche hypertendue S, sauf pour une région qui est remplacée par la région homologue de la souche nonnotendue Lewis. Ces lignées permettent ainsi d’associer un changement potentiel de la PA sur le chromosome 2 lorsque comparée à la lignée S.
Nous avons obtenu des résultats pour 4 souches congéniques. Deux de ces quatre souches ont montré la même pression art &ielle moyenne (MAP) que le rat S. Donc, elles ne sont pas significativement différentes par rapport à S. La souche congénique C2S.L1 pourrait être classifiée comme une souche « hyper » hypertendue de S dû au fait que sa préssion artérielle était plus élevée que celle de S même si elle contient des allèles provenant de la souche normotendu Lewis. Les pressions artérielles systoliques et diastoliques varient de façon concordante avec les valeurs de MAP.
Donc, le chromosome 2 du rat Dahl contient un QTL pour la pression artérielle. La découverte de gènes pour ce QTL sur le chromosome 2 peut nous donner une idée des mécanismes qui contrôlent la pathogenèse de l’hypertension.
Mots clefs
Hypertension essentielle, pression artérielle, souche congénique, chromosome 2, rat DahI sait-sensitive, modèle animal rat
Résumé anglais
Essential hypertension is an important risk factor for many cardiovascular diseases and affects a large percentage of the hurnan population. Biood pressure (BP) in animais is influenced at the sarne tirne by enviromnental and genetic factors. In the study of genetics, hypertension is defined as being a muitifactorial quantitative trait under polygenic control. Our previous studies using linkage analysis have suggested the presence of a quantitative trait locus (QTL) associated to blood pressure on chromome 2. Our objective was to verify these resuits using congenic animal models.
In order to study hypertension in a hornogeneous environrnent, we used inbred rat strains where ail animais are genetically identical. Congenic strains were obtained by crossing the S rat (Dahi sait-sensitive hypertensive) and the L rat (Lewis nonnotensive rat). They are crossed until we obtained a genetic background ofthe S rat and the portion containing the QTL replaced by the homologous portion of the L rat. These strains will therefore permit to associate a potential change in arteriai pressure on chromosome 2 when compared to the S strain.
We obtained resuits for four congenic strains. Two of the four strains demonstrated the same mean arterial pressure (MAP) as the S rat. Therefore, they are flot significantly different to S. The C2S.Li strain could be classified as a hyper-hypertensive strain of S due to the fact that its MAP was higlier than that of the S strain even thought it contains alleles from the Lewis rat. The diastolic and systolic artenal pressures varied in the same manner as the MAP.
In conclusion, the Dahi rat chromosomes 2 contains a QTL for blood pressure. The discovery of genes for this QTL on rat chromosome 2 could help us to better understand the genetics of hypertension.
Key words
Essential hypertension, blood pressure, congenic strain, chromosome 2, Dahi sait sensitive rat, rat animal model
TABLE 0F CONTENTS
Résumé français ii
Résumé anglais iii
Table of contents iv
List ofabbreviations viii
Dedications x
INTRODUCTION
1
Chapter 1-The concept of hypertension 2
1.1 High blood pressure 2
1.1.1 Renin-angiotensin system (RAA) 4
1.2 flypertension 7
1.2.1 Épidémiologie 8
1.2.2 Monogenic Hypertesion 8
1.2.3 Essential Hypertension 11
1.3 Hypertension and environnement 12
1.3.1 Hypertension in industrialized populations 13
1.3.2 Hypertension and obesity 13
1.3.3 Consumptionofalcoholand hypertension 14
1.4 SaIt sensitivity and hypertension 14
1.4.1 Importance of ion transportation 15
1.4.2 Role of sodium 15
1.4.3 Role ofintracellular calcium 16
Chapter 2 - Genetic approach 17
2.1 Candidate gene approach 20
2.2 Linkage analysis studies 21
2.3 Association analysis 23
2.4 Comparative genomics 23
2.5 Genomic ressources 25
2.6 Animal models 26
METHODS
.30
Chapter 3- Study of genetic Iinkage analysïs .31
Chapter 4 - Coiigenic strains 35
Chapter 5 -QTL mapping 39
5.1 Microsatellites 40
5.2 Physical maps 43
î3 Hornology map 44
RESULTS
45
Chapter 6 -Previous studies
46
Chapter 7 -Project 4$
Article “Severe hypertension caused by alleles from normotensive
Lewis for a quantitative trait Iocus on Chromosome 2” 50
DISCUSSION
74
Chapter $- The influence of genetic and environ mental factors 75
8.1 Environmenatl factors 75
8.1.1 Sex ofthe animal 75
8.1.2 Age ofthe animal 76
8.1.3 Animal diet 76
8.1.4 Method ofmeasure ofarteriat pressure 76
8.2 Genetic factors 77
8.2.1 The position effect 78
Chapter 9— Discussion of present work. $1
CONCLUSION
$5
Chapter 10- Conclusion and Perspectives $6
LIST 0F FIGURES
Figure 1 Renin angiotensin system (RAA) 6
Figure 2 Gene environrnent interaction 12
Figure 3 Epistatic effect ofChr.2 BP QTL andChr.10 BP QTL 19
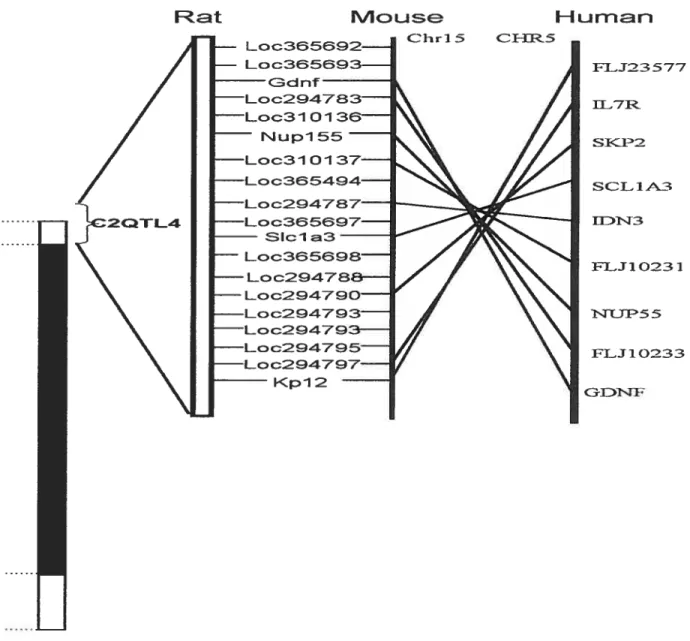
Figure 4 Hornology between rat, mouse and hurnan 24
Figure 5 Genetic tools using the rat 27
Figure 6 Co-segregation during linkage study 32
Figure 7 Schernatic representation ofthe construction ofcongenic strains 37
Figure 8 Method used to obtain rapid congenic strain (speedcongenies,) 38
Figure 9 Example of PCR genotyping 40
Figure 10 Previous linkage analysis studies 47
Figure 11 Telemetry 4$
Figures in article
Figure lB Fine mapping ofC2QTL4 71
Figure 23 Comparisons ofBPs between congenic strains and the DSS strain 72
Figure 3B Comparisons ofQTLs localized on Chr.2 73
LIST 0F TABLES
Table I Monogenic forms of hypertension 10
Table 11 Strains of rats selectively developped for the study of hypertension 29
Table III Examples ofinternet sites used to find marker infonnation 42
Table IV BP QTLs localized in the Dahisaitsensitive rat 80
List of abbreviations
ACE Angiotensin converting enzymeAME Apparent mineralocortecoid excess
Ang Angiotensin
ATP Adenosine triphopshate
BAC Bacterial Artificial Chromosome
BN Brown Norway
B? blood pressure
Ca2+ calcium ion
Chr chromosome
CHUM Centre Hospitalier de l’Université de Montréal
cM centimorgan
CNS Central Nervous System
Cpb Capping protein beta
cR centirad
DAP Diastolic arterial pressure
EST Expressed Sequence Tag
Hsp7O Heatshock protein 70
K+ potassium ion
kDa kiloDalton
kb kilobase
kg kilogram
LEW Lewis Rat
MAP Mean arterial pressure
Mb Megabase pairs
mg rnilligrain
rnmHg millimeter ofrnercury
MNS Milan Nomiotensive
MR Mineralocorticoid receptor
Na+ sodium ion
NCBI National Centre for Biotechnology Information
NHANES Third National Health and Nutrition Exarnination Survey
bp base pair
PCR Polymerase in Reacti on
QTL Quantitative Trait Locus or Loci
R Dahi Salt-Resistant rat
RFLP Restricted Fragmetn Length Polymorphism
S Dahi Sait-Sensitive rat SAP Systolic Arterial Pressure
sec. second
SHR Spontaneously hypertensive rat SNP Single Nucleotide Polyrnorphisrn
SSLP Simple Sequence Length Polymorphism
TNFΠTumor necrosis factor cL
VNTR Variable Number Tandem Repeat
Dedications
I dedicate this thesis to the memory ofmy mother who aiways pushed me to be a
better person and gave me strength to believe in myseif and my dreams...
I thankrny father for his love and support.
I wouÏd also like to thank the i-est ofmy family for being so proud and supportive
ofrny long joumey.
A big thanks to rnybest friend Ana who ismymentor and neyer gives up on me.
To the girls at the lab: Annie, Julie, Julie, Raphalle, Sophie and Chenda. You are tmly the definition ofteamwork and friendship and I feel privileged to have worked
by your sides.
To Dr. Deng who neyer gave up onme regardless of hard tirnes and showed me truc passion for genetics.
Torny brother Jimmy who was aiways there for me, lifiedrny spints and aiways made laugh.
And last but not least, to my love George, without your love and support this could have neyer been accornplished, you too inspiremeto believe in rny dreams...
o
o
The concept of hypertension
1.1 lligh Blood Pressure
Hypertension is a disease that causes organ damage throughout the body due to high blood pressure that is present flot only dunng physical activity but also at rest. The terrn “high blood pressure” adequately describes a temporary condition caused by stress and physical activity, whereas “hypertension” is a more suitable tenu for a persistent disease state(1). Diagnosis of essential hypertension includes exclusion of secondary hypertension such as that associated with endocnnological disease, renal disease and renovascular disease (2). A few monogenic diseases (inheritance hypertension) have been defined as unusual hypertension.
Although evidence strongly suggests that essential hypertension is a multifactorial inheritance disease (3), a clear causal gene of essential hypertension has flot yet been identified. There are rnany environrnental factors that affect essential hypertension including obesity, diabetes, drinking and smoking. Accounting for these effects is one of the issues that complicate isolation of susceptibility genes.
Blood pressure is the hydrostatic force that the blood exerts against the vessel walls, thus creating a cardiac cycle. Each cardiac cycle is cornprised of two altemate phases, the diastolic and the systolic phase. During the systolic phase, the cardiac muscle contracts which in tum creates a propulsion of blood from the cavities of the heart. This in tum supplies the organs of the body with the proper nutrients and essential oxygen. With every contraction of the heart, 70 ml ofblood is propelled into the arterial systemic system; this is called the systolic volume. During the diastolic phase, the ventricles fil with blood which is ready to be pumped throughout the body once again. Both the systolic and the diastolic phases have an approximate duration of 0.4 seconds each and induce a pulse of about 65 to 80 beats per minute.
Blood pressure is greater in arteries than in veins and reaches a peak in the arteries during the systolic phase while the heart is contracting; this is called the arterial systolic pressure. Variations ofblood pressure depend on cardiac output and the degree of peripheral resistance to the flow of out coming blood. If the volume ofblood is increased and the vascular resistance is also increased this in tum augments the pressure.
In medical terms, blood pressure is rneasured in two parts: systolic and diastolic. The systolic pressure corresponds to the pressure exerted by the blood on the walls right after the passing of blood. A resuit of typical biood pressure would be presented as such systolic pressure! diastolic pressure, using as unit millimeters of mercury (mmllg). Optimal pressure being situated around 1 20!80 mmHg.
The kidneys play a key role if not essential role in the control of blood pressure. There 11es a crucial balance between sait intake and peripherai resistance. for example, if the arnount of sait intake increases it will be followed by an increase of the extracellular volume and plasmatic volume. This increase in volumes results in escalation of the blood pressure which in tum increases the systolic volume. In the long run, the final effect of the auto regulating systems is increase of the peripheral resistance which brings the
systolic volume back to homeostasis. The augmentation of the peripheral resistance
could be substantial, this couid lead to hypertension. Nonual kidneys would minimize these rises in the extracellular fluid and the systolic volume, therefore minirnizing the elevations in blood pressure.
In the arteriai waiis ofthe body, we also find smooth muscles. The contractions of these srnooth muscles contract the arterioles which in tum increase the resistance and consequentiy increase the artenal pressure. Once the srnooth muscles release their pressure, the arterioles dilate and the arterial pressure drops. The muscles in the arterioles obey the signais given to them by nerves, hormones and other messengers.
Physical or ernotional stress can also elevate blood pressure by causing nerve end hormonal reactions which will compress the blood vessels. Many other mechanisrns also control blood pressure. Baroreceptors which are situated in the blood vessels detect large changes in blood pressure and send the information to the brain to be processed. The factors produced by the blood vessels influence the arterial rigidity and cause vasodiÏation or a vasoconstriction. Furtherrnore, atrial natriuretic peptides produced by the brain and the heart, in response to an elevation in pressure in these organs also oppose the vasoconstrictive effect of angiotensin and endothelin and the reabsorption of sodium which is started by the rennin-angiotensin system. These peptides also influence the re absorption of sodium which is induced by the renal angiotensin system (4).
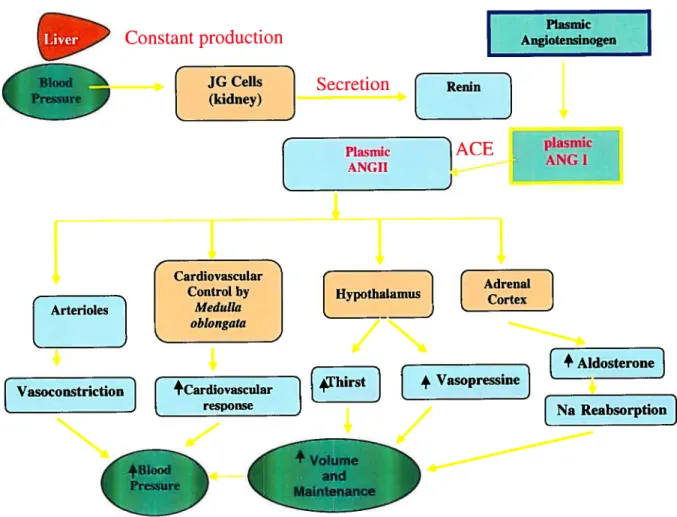
1.1.1 Renin-angiotensin aldosterone system (RAA)
The RAA (figurel) is vital to the preservation ofarterial pressure, horneostasis of the vascular volume and the balance of electrolytes, specifically during the loss of fluids or a drop in pressure. Renin was first isolated in 1898 from rabbit kidneys and was described as a substance that influenced blood pressure (5). This enzyme is released in
the circulation by the kidney under the control of multiple signais and acts on
angiotensinogen in the liver. Once angiotensinogen is cleaved by the renin protease,
angiotensinogen I (Ang 1) is created. Ang lis then converted to angiotensin II (Ang II) by the angiotensin conversion enzyme (ACE). Ang II is the principal vasoactive honnone of the RAA system. Its effects include vasoconstriction, the stimulation of aldosterone secretion and the re-absorption of sodium by the kidney. The RAA system acts in the circulation but also exists in many tissues and organs.
The action of Ang II is effective via it’s linking to specific receptors (AT1 and AT2). These receptors are part of a family of receptors coupled to Gi proteins and are expressed in rnany tissues but primarily in the brain, kidney, and the suprarenal glands. Two sub-types ofthe ATI, AT1a and AT1!3 receptors were identified in rodents (6).
These two receptors are the product of two genes (Agtrl a and Agtrl
F3)
and are differentÏy expressed and reguÏated. Il was demonstrated that the Alla receptor was rnostly implicated in the regulation of the peripheral vascular rigidity and the response to increased pressure in the central nervous system (SNC). The Ailf3
receptor is required for the agonistic response ofAngil in the SNC (7).The RAA system works along with other systems to monitor and maintain pressure and fluïds. One such system is the sympathetic nervous system. It constitutes a balance to the vasodilation systems. In the majonty of patients which suffer from essential hypertension, tEe arterial pressure drops when treated with ACE inhibitors or antagonists of the Angli receptor. There is also a drop in arterial pressure with certain treatments that activate the RAA system. Therefore one can understand that although it’s clear that the
RAA system does play a primordial role in controlling blood pressure, it does not constitute the prirnary cause of hypertension nor is it the only deterrninant of blood pressure in essential hypertension (8).
Ail systems controlling or regulating blood pressure act together in a complex fashion. TEe role of these systems bas been established in short terrn homeostatic responses. It’s difficuit to examine whether these pathways contribute to blood pressure detennination in the long terni Blood pressure must be measured in intact living organisms where ail these systems interact in a complex manner, thus making it very difficuit to distinguish pnrnary alterations versus adaptive secondary responses.
6 Plasmic Angiotensinogen Cardiovascular Control by Arterioles Meditila
t
J L
Plasmic I ANGII l%J
ACE r plasmicFigure 1. The renin angiotensin system (RAA)
This figure is a schematic representation of the control of arterial pressure on various components. This figure is based on a figure taken from Human Physiology figure 20-13 (5).
Liver Constant production
JG Celis
E
(kidney)]
SecretionE
ReninI
Adrenal[HYPothalamus_I
[ortexI
f
Vasoconstriction1
+Cardiovascular response[fhiJ
ood Pressure[
+Aldosterone7[
+ VasoPressiI] [Na Reabsorption]1.2 Hypertension
Hypertension (elevated blood pressure levels exceeding H0/90 rnmHg according to WHO criteria) is a common complex disorder which affects 15-20% of adult population in Western societies (8). It is classified as primary (essential) or secondary hypertension. The former type is used to describe hypertension without a known pathology. The diagnosis of essential hypertension is made when no other cause for increased blood pressure is found. This form of disease contnbutes about 90-95% of ail hypertension cases. Whereas in 5% of cases, the cause of hypertension is known to be secondary to conditions such as pheochromocytoma, prirnary hyperaldosteronism (Conn’s syndrome), Cushing’s syndrome (excessive g1ucocorticoids), renal disease or drug induced. This disease is considered to be a multifactorial disorder with many genetic, environmental and dernographic factors contributing to blood pressure variation. The complex nature of the involved mechanisrns makcs it difficuit to identify a single pathological system of prime importance in regulating blood pressure.
Hypertension is one ofthe rnost important risk factors for cardiovascular diseases. It is one of the principal independent nsk factors for stroke, myocardial infarction, and end-stage renal disease. Furthermore, it is associated with rnany other complications that affect vital body functions such as left ventricular hypertrophy, diastolic dysfunction, congestive heart failure, cerebral thrombosis, encephalopathy and retinopathy (9).
1.2.1 Epidemiology
As mentioned previously hypertension is a discase which is very present in our society. It affects about 50% ofthe population aged 65 and over (10). Also, a 55 year-old with normal blood pressure has a 90% chance of developing hypertension during his or her lifetime. According to the NHANES (Third National Health and Nutrition Examination Survey) only 53.6% of peopic suffering from hypertension are treated. Surprisingly, only 27.4% of those treated are treated successfully (blood pressure under 140/9OmrnHg). R is also clear from farnily and epidemiological studies that hypertension arises from a complex interplay between genetic and environrnental lifestyle exposures including dietary sodium intake, excess alcohol consumption and body weight (10).
1.2.2 Monogenic Hypertension (Mendelian)
Monogenic hypertension is responsible for approximately 5% of hypertension cases and is considered as a unique trait because it dernonstrates mendelian transmission. A single defective gene is responsible of the disease and its great variations in blood pressure. A lot of information obtained in the fielU of hypertension came from single gene disorders from which gene variants causing the trait were characterized (11).
Liddle’s syndrome
Liddle’s syndrome is an autosomal dominant disorder that leads to increased re absorption of sodium and water in the renal collecting tubules and hence leads to hypertension. The syndrome was found to be due to mutations in the genes coding for the 3 and ‘ subunits of ENaC (epithelial sodium channel).
Syndrome of apparent mineralocorticoid excess (AME)
AME is an autosomal recessive disorder charactenzed by an early onset of moderate to severe hypertension. Patients with AME1 have a deficit in 1 1 3-hydroxylase in their systern(12). As a resuit, 11 3-hydroxylase is under the control of the adrenocorticotropic hormone which wiii be secreted and lead to an increase in sait and water re-absorption as well as a risc in biood pressure.
Mineraiocorticoid receptor (MR) activating mutation
Substitution of leucine for senne at codon 810 (S81 OL) in the mineralocorticoid receptor causes early onset hypertension that is markedly exacerbated in pregnancy. This mutation resuits in constitutive MR activity and aiters receptor specificity. Ail steroids, including progesterone, that dispiay antagonists properties when bound to the wild type MR are able to activate the mutant receptor (L8 10).
Pseudohypoaldosteronism type II
Pseudohypoaldosteonism type II is an autosomal dominant disease characterized by severe hypertension, hyperaikernia and sensitivity to thiazide diuretics (12). This resuits from altering Na+C1- and K+ handiing. Mutations in two members of the WNK kinase family, WNK 1 and WNK 4, cause the disease. Both genes are highiy expressed in the kidney.
Names Mutations Hereditary Form
Liddle’s syndrome j3 ENaC Autosomal Dominant
y ENaC
AME 1 1 f3-hydroxyiase Autosomal Dominant
MR activating mutation S$1OL Autosomal Dominant
PHAII WNK 1 Autosomal Dominant
WNK4
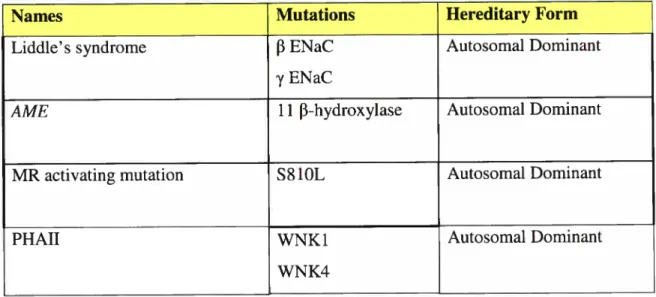
Table I- Monogenic forms of hypertension
Examples of monogenic forms of hypertension
Descriptions of diseases and table based on Tanira et al (2004) and Liflon et al (200])
The above mentioned forms of hypertension affect a common pathway via the control of sait reguiation and sait re-absorption in the iddney, which indicates a key role of the kidney in the pathophysiology of hypertension. Extensive data from experimental animais suggest that hypertension cannot be sustained without active participation of the kidney (13). In addition, marked elevation of biood pressure in response to increased dietary sait intake has been observed in humans, primates and rodents (14), indicating the importance of inherited variation in renal sait handiing. The relation between genetic variation and monogenic forms of hypertension provides insight into the more common forms of hypertension, especiaily in patients where the genetic defect has been characterized.
1.2.3 Essential Hypertension
Essential hypertension constitutes the vast rnajority of hypertension cases. It is a multifactorial forrn of the disease that implicates such determinants as genetics and
environrnent. Risk of hypertension tends to concentrate itself in farnilies and a strong
aggregation ofhigh blood pressure is observed in rnost ofthese farnilies. Given the fact that the sarne family flot only shares environment but their genes, it makes it very difficuit to separate these two influences. Moreover, blood pressure is a complex trait and the clinical phenotype of high blood pressure can be observed in a variety of pathophysiological rnechanisms.
It is now widely accepted that this type of hypertension is polygenic, this means that it is caused by a complex interaction between rnany genes. Essential hypertension would therefore be detenriined by the interaction of a few major genes or many minor genes. Depending on the combination ofgenes, different interactions would modulate the deterrnination ofblood pressure and the genetics would influence these interactions.
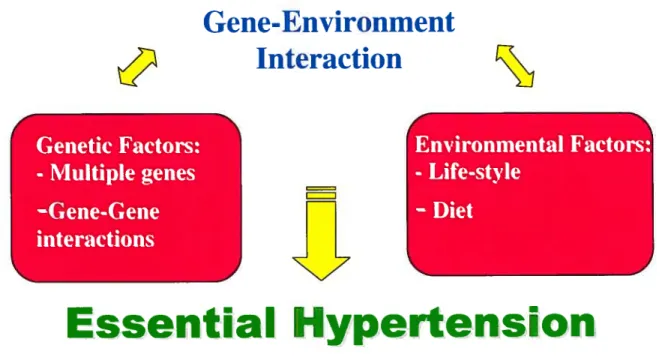
Most of the traits that have a significant impact on the health of a population implicate many genes which interact amongst themselves. Most of the time these genes are also influenced by environmental factors.(Figure 2) Very rarely do forrns of this disease implicate only one gene. Very ofien, forrns of this disease undergo a very rigorous regulation by a multitude ofgenes. Furtherrnore, this regulation could vary from one individual to the other, depending on the variety inherited. This renders the task of identifying the exact causes of essential hypertension much more difficuit.
Gene-Environment
Interaction
Genetic factors:
-Multiple genes
—Gene-Gene
interactions
=n
Environmental factors:
-Life-style
—Diet
Essential Hypertension
Figure 2- Gene-environment interaction
Figure representing the interactions ofthe many factors influencïng hypertension.
1.3 Hypertension and Environment
Many genetic and environmental factors affect hypertension. Examples of such factors would be: sex, age, race, diet, consumption of alcohol or tobacco etc. The individual effect of genes can be additive or more complex and epistatic. As mentioned previously, the gene-gene interactions and gene-environment interactions, including the relation between these two groups render the study of this trait very complex.
It has been estimated that the genetic factor contributes from 30 to 50% of the variation of blood pressure which is observed. The identification of the genes that affect hypertension lead to a better comprehension of the pathophysiology of this disease. This information could then be useful to identify the individuals susceptible to this disease
before the physiological manifestation, thus creating a preventive therapy. The
knowledge of the genetic basis of this disease will also provide a better treatment by prescribing medication that responds to the specific needs of the affected individual.
1.3.1 Hypertension in industrialized populations
Many studies have shown a correlation between blood pressure and the location of inhabitance. Individuals that live in industrialized areas have blood pressure that increases which age. On the contrary, individuals living in non-industrialized areas, have ablood pressure which rernains constant (15).
Stress is another environrnental factor in industrialized populations which is important in the development of hypertension. It lias been demonstrated that hypertensive or pre-hypertensive subjects, with a family history of positive hypertension, have a greater increase in blood pressure when they are exposed to a physical or mental stress than subjects which are of normotensive progeny witli the same basal levels of blood
pressure (16). A prolonged exposure to a chronic elevated stress throughout a long
period of time could cause an anatornical adaptation in the heart and vessels and would therefore contribute to maintain a high blood pressure (16).
Many response genes could also be implicated in the environmental susceptibility
to hypertension. Two such genes in the rat are hsp7O and tnfa. Temperature and
immobilization of the animal have been associated to changes in blood pressure and expression ofthese genes (17).
1.3.1 Hypertension and obesity
The association between hypertension and obesity lias been well documented. It
lias been demonstrated that bÏood pressure is closely linked to body mass(17). This
relation is valid for various populations and is confirmed flot only in chuidren but teenagers and adults as well. Studies have shown that nearly haif of the population which is considered rnedically obese is hypertensive (18). Obesity brings upon physiological changes such as an augmentation in the resistance of the blood vessels and a cardiac hypertrophy (18). It lias also been observed that a reduction of intra-abdominal fat is linked to a decrease in blood pressure in patients which are hypertensive and obese.
1.3.2 Consumption of aicohol and hypertension
Therc exists a correlation between alcohol and a high arterial pressure. Even
today, there is no known signaling pathway which couid clearly explain this iink. In the
Caucasian population, men have a diastolic and systolic pressure that increases with the arnount of aicohol consumed. This tendency is also observed in women but the increase
in arterial pressure is iess pronounced (19). In the African-Arnerican populations, the
men had a constant increase of diastolic as well as systolic pressure for the same alcohol consumption.
1.4
Sait
sensitivity and hypertension
The amount of sait in one’s diet is an important environmentai factor in the
regulation of biood pressure (20). It lias been observed that the prevalence of
hypertension is low in certain primitive societies with a diet which is feeble in sait (21). In the 1940’s, it was dernonstrated that a iow-salt diet could reduce biood pressure in patients suffering from severe hypertension. Aiso, in certain patients (20 to 40%), a iow sait diet could heip them to better control biood pressure (21).
Normotensive and hypertensive subjects can be either sensitive or resistant to the effects of an increase in blood pressure which is due to sait. Meaning that their blood can be sensitive or flot to the effect of sait intake. In hypertensive subjects, those that werc sait-sensitive had an elevation in biood pressure during a period of 24 hours, whereas the subjects which were sait-resistant had a high biood pressure only during their sleeping period. The kidneys have been long suspected of playing a central role in sait sensitivity and arterial pressure. It lias aiso been dernonstrated that sait sensitivity couid also be rnodified by the presence ofother ions in the diet.
1.4.1
Importance of ion transportation
At the base, essential hypertension is created by an imbalance between the peripheral resistance of the biood vessels and the blood volume. The mechanisms which are responsible are the regulatory contraction ceils of the smooth vascular muscle in the arteries which forrns the resistance and the regulation of extracellular fluids. It has been dernonstrated that the response of the srnooth muscle celis would play a role in the
regulation ofblood pressure (22).
The peripheral resistance and the regulation of the extracellular volume can be linked to the membrane which separates the extracellular and intracellular spaces. The structure and function of this membrane plays a key role in the pathogenesis of hypertension. The plasmic membrane is a dynamic structure that maintains its interactions with adjacent cells with the help of specific signais from the entire organism
1.4.2 Role of sodium
There exists a relation between the consumption of sodium and the development of hypertension in certain animal models and patients suffering from salt-sensitive hypertension. Cellular sodium is increased in rnany types of cells (erythrocytes, lymphocytes) in essential hypertension. This is due either to an increase or decrease in the entry of sodium. The principal deterniinant of this unequal distribution of sodium between the intracellular and extracellular compartments is the ATPase NA+K+ pump
which exports three sodium ions for two potassium ions irnported into the ceil. This
maintains a low concentration of intracellular sodium and a high concentration of potassium. This unequal distribution is responsible for the inflow of other ions between cornpartments. It is also possible that this pump is barred in certain forrns of hypertension which are characterized by a large quantity of sodium and water.
1.4.3 Role of intracellular calcium
Intracellular calcium is a major determinant in the contraction of the srnooth vascular muscle. It is also a key elernent in the cellular response to agonists, intracellular calcium acts a second messenger. In resting celis, it is kept constant by a variety of rnechanisms which are rnediated by sodium pumps located in the intracellular organelles. In hurnans and experirnental models affected by hypertension, calcium homeostasis is affected.
The essential components of calcium homeostasis are the plasmic calcium ATPase, which pumps the calcium out of the celI and the sodium-calcium exchanger (NCX) which pushes the calcium out against its gradient in exchange with sodium which is pumped with its gradient. An equilibrium between these two rnechanisms maintains an intracellular concentration of calcium which is four tirnes weaker than the extracellular
concentration. It has been demonstrated that entry of calcium via the type 1 NCX
exchanger (NCX1) is implicated in the contractile regulation ofthe small arteries as well as in the development of sait-dependent hypertension. (21)
Chapter 2
Genetic approach
It’s clear at the present time that essential hypertension is a polygenic and hereditary disease. Studying the genetic bases of hypertension is a very difficuit task due to the fact that there are many genes involved each having a partial effect on blood pressure. The hurnan population is genetically heterogeneous, each individual possesses a particular version of each of his or her genes and the combination of these genes renders each person unique. This phenomenon complicates the research of the responsible genes for this complex trait. Given the fact that each individual possesses slight variation differences for each gene, it is difficuit to discover a srnall difference in the genome of a varied human population.
The main strategy used to study the genes irnplicated in hypertension is the identification of QTLs (quantitative trait loci) which are responsible for the variations of arterial pressure observed. The genes which contribute to a complex quantitative trait are known as QTL (23), the quantitative trait of hypertension being arterial pressure. The
units used to measure arterial pressure are rnmHg also known as millimeters ofmercury.
Due to the fact that a QTL is responsible for only a fraction of the trait observed, the phenotype-genotype colTelation is weak (24).
An epistatic interaction happens when the combined effect of two or more genes cannot be predicted by a simple addition of their cffccts (25).An example of an additive effect would be on Chr. 10 in the Lcwis rat where 3 QTLs were found to interact additively. (59) The influence of epistatic genes on complex traits is not very well understood due to the complexity of the studied traits. A more precise definition for an epistatic interaction was given by Bateson: an epistatic interaction happens when a gene
interferes with the phenotype of another gene which is situated on another allele. In
There are only a small number of epistatic interaction cases in the study of complex traits such as QTLs. This is due to the analysis tools which are used. The majority of these tools calculate the general effect of the QTL on the phenotype and not the interaction effect ofrnany QTLs (26).
Even with the difficulties encountered in epistatic interactions, there do exist some examples. Ohno et al. dernonstrated the presence of epistatic interactions between hypertension and the SrcalI (sarco (endo) plasmic reticulum Ca2+-dependant ATPase II)
(27). Rapp’s team also dernonstrated the possibility of an epistatic interaction between two arterial pressure QTLs in the rat (2$). They located a QTL on both chromosome 2 and chromosome 10. Using genetic linkage studies, they observed a weak segregation of the F2 population between the QTLs of chromosome 2 and chromosome 10. To prove the presence of an interaction between these two QTL5, they constructed a double congenic. A double congenic is a congenic strain were two regions are targeted: the genomic background being from one strain, and the QTL region of chromosome 2 and 10 have the genotype of another strain. Thc QTL of chromosome 2 increased arterial pressure versus the parental hypertensive strain. Logically, one would think that the combination of these
two QTLs in the same congenic strain would have an amplifying effect on the arterial
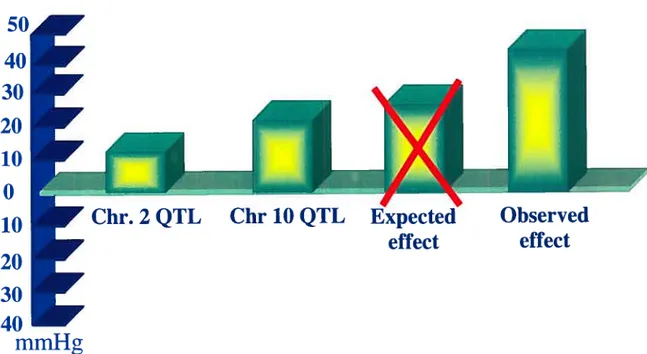
pressure. In other words, the QTL of chromosome 2 increases the arterial pressure by 8 mmHg, the QTL of chromosome 10 increases arterial pressure by 1 5mmHg, if the interaction of these two QTLs is additive we expect to observe an increase of23mmHg of the arterial pressure. Surprisingly, an augmentation of 47 mmHg was observed (29). This demonstrates that the —BP (blood pressure lowering) QTL is epistatic to the +BP (blood pressure raising) QTL.
50
40
30
20
10
0
-10
-20
-30
Figure 3- Epistatic effect of Chr.2 BP QTL and Chr 10 BP QTL
Representation of arterial pressures and observed effect as published in Rapp et aÏ. (28)
Advancement in the domains of molecular biology and genomic techniques, in combination with those of physiology has given birth to functional genomics. functional genomics is defined as a multidisciplinary approach in the study of genes, their products and interactions (30). Other strategies have also been put into place to identify the genes which are susceptible to hypertension (31).
Such strategies are:
1. Candidate gene approach 2. Linkage analysis 3. Comparative genomics 3. Animal models 4
Clir. 2 QTL
Chr 10 QTL
Expected
effect
-40
mmHg
Observed
effect
2.1 Candidate gene approach
Most genetic studies implying hypertension-predisposïng genetic loci have used this strategy to study candidate genes. This systernatic approach assumes that a gene or a set of genes involving a specific physiological or ceilular function contribute to blood pressure variation.
Ernploying this approach, sorne candidate genes have been elucidated from the study of rare monogenic forms of hypertension (Liddle’s syndrome). For essential
hypertension however, at least 51 genes/loci that affect different physiological or
biochernical systems have been describe (32). Most of these studies utilizing genetic linkage and association rnethods enrolled unrelated individuals in case-control designs.
Although case-control design is useful in hornogeneous populations, thcse studies were
perforrned in heterogeneous populations and thus may have higher probability of errors due to differences in the studied population (33). Case-control design also renders candidate gene studies difficuit to be reproduced and less likely to include ail causative genes and polymorphisms.
The candidate gene approach is limited by our knowledge of the pathophysiology of the disease in question; we are limited by the known genes that contnbute an effect on thc complex trait. This approach does not permit us to identify new genes implicatcd in the pathogenesis of the studied disease.
2.2
Linkage analysis studies
This method gives estimates for the genetic pararneters behind any trait(s) being studied and proposes a mode! to explain the inheritance pattern of phenotypes and genotypes observed in a pedigree. It provides information on gene frequency, mode of inheritance and phenotypes.
It is also a common method used for genetic mapping. It uses a DNA polymorphie marker situated in proximity to a locus causing a disease, and this sarne locus will be followed during the segregation of the chromosomes in the affected individuals. This way a LOD score can be determined and linked to a specific gene which may cause disease. The two types of DNA polyrnorphisms that can be eveluated are
RFLP (restriction fragment length polyrnorphisms) and VNTR (variable number of
tandem repeats). VNTRs are constituted by a variable number of sequence repeated
nucleotides in individuals. This sequence can be short (microsatellites and SSLPs-simple
sequence length polymorphisrn) or long (minisatellites). In order to determine which
polyrnorphisrn was inherited by eaeh individual we use PCR (polyrnerase chain reaction) and gel eleetrophoresis to detect the repetitions and measure their different lengths. In the case of genetic linkage studies, microsatellite markers are the most frequently used.
The more a locus marker and a locus causing disease are in proximity to one another, the more they will travel together and have less recombinance between them. When these two loci follow one another more ofien than usual during segregation they are considered to be “paired” or linked. This linkage is quantified with the help of a LOD
score. This is a measure of the probability of a linkage between the disease and the locus.
Generally, a LOD score of 3 is necessary to be deemed significant and indicates a linkage
The resuits of genetic linkage analysis studies are presented in the fonii of a
graphie where the curve represents the LOD score with each of the rnarkers tested ail
along the length of the chromosome. When a significant peak is observed in the graph, the region which demonstrates this peak contains a QTL (quantitative trait locus). The localization of a QTL by linkage analysis detenTiines a chromosomal interval of approximately 20 to 30cM (35). This constitutes a very big region and other methods
must be used to confirrn the QTL and further narrow the number of candidate genes (36).
There is also a possibility that there are rnany QTLs located on the same chromosome. If
the distance separating 2 QTLs is superior to 80cM, these two can then segregate
independently which will be illustrated by two peaks in the graph (37). On the other hand if the distance separating the two is inferior to 80cM, two peaks will flot be observed and the presence oftwo QTLs will be undetectable.
Genetic linkage analysis studies are mostly used when studying diseases implicating only one gene, such as monogenic fonTis of hypertension. In these studies a mendelian fonTi of transmission is observed and one responsible gene is followed in affected farnilies. Given the fact that the effects of this gene are present or absent in certain farnily members, the co-segregation ofalleles causing the disease can be detected.
This type of analysis is very difficuit to use for essential hypertension because it is the resuit of many genes. The contribution of each gene is weaker and detecting a link between allelcs causing disease can be more difficuit.
2.3 Association analysis
Association analysis is an alternative method to genetic linkage which compares the allelic frequency between the affected and non-affected individuals. If an allele is found more ofien in affected individuals than in non-affected individuals this allele is thought to possibly be linked to disease. These studies are more effective than linkage analysis in studying hypertension because they have greater statistical power to detect several srnall genes for a srnall effect (37), but they aiso have a greater tendency to yield false positives.
2.4 Comparative Genomics
This approach employs data from animal studies to identify potential biood pressure regulating loci in humans. In genetics, a good method to link the animal mode!
to the human is by constructing a homology map. A hornology rnap is constrncted by
placing hornologous genes (found on NCBI) from different species on a map and comparing their function from one species to another. If the function and importance of the gene is conserved then that gene and its effects are fiirther studied in depth.
This approach perniits one to target potential QTL regions between species. More than 70 studies ofhuman populations have identified QTL regions in the human genome. When animal models are used, a genetic comparison must be applied to be able to locate the homologous regions in the hurnan genorne. This method also permits us to confirm the results observed in the animais. In other words when a QTL region is localized in the animal genome, the conservation of the QTL can be studied by verifying if there is a
superposition of the studied QTL with one which is already identified in the human
Figure 4- Homology map between the mouse, rat and human.
This figure demonstrates the conservation of the homologous regions and the localization of the QTL between species. This figure is taken from Etiopoutos et al (52).
F? at
q
HLi m ChrI5 c}-IR5 FL.12357’7 H7I SIKJ’2 SC L 1 P3 flZT3 FL.J1 0231 13F5 5 FLJ 10233 kpl 2Li
2.5 Genomic Resources
Genornic resources are essential for the genetic analysis of a QTL. Many genomic resources have been put in place in the last few years with aim to facilitate these genetic
analyses. The most important being the sequencing of the rat genome which was
completed in 2003.
The sequencing of the rat genome was completed in 2003 with more than 90% of
the genome sequenced. This sequence is now readily available at NCBI’s website
(http://www.ncbi.nlm.nih.gov/). In April of 2004, an article published in Nature explains the key elernents to this sequencing. The Rat Sequencing project, also known as RGSP, started many years ago. Due to the fact that the rat is often used in rnany physiological and pharrnacological studies, there was indeed a real need to know its genornic sequence even thought the rat and mouse are rnorphologically very similar and close ancestors from an evolutionary point ofview.
Contrary to the genomic sequence of the mouse and hurnan, which are entire sequences, the sequencing of the rat genorne is flot entirely completed. With sufficient tirne and funding it should be completed in the near future. This is significant and for this reason it is very important to keep a high standard in the quaÏity of sequencing in order to minirnize errors.
The rat genome measures 2.75Gb which is inferior to that of the human genome
which measures 2,9Gb but larger than that of the mouse which measures 2.6Gb. It is important to remember that the assembling of the genome predicts a size that is always inferior to the actual size. This is mainly caused by the difficulties of sequencing as well as assembling the sequenced pieces (38).
2.6 Animal models
There exist animal models which were specially generated to represent hurnan diseases such as hypertension. An animal mode! which suffers from hypertension is less complex to use. Contrary to hurnan subjects, an animal strain can be crossed in such a manner that the differences in the genes solely related to hypertension can be studied. Also, animal models can be analyzed in a controlled environment where many variables, such as population and environmental conditions, can be pre-determined (39). Animal models also offer the possibility of a short gestation period as well as a large number of crosses and progeny which render the study of complex genetic phenotypes and gene gene interactions casier to study.
2.6.1 The rat
Many rat and mouse models were established to study complex genetic traits.
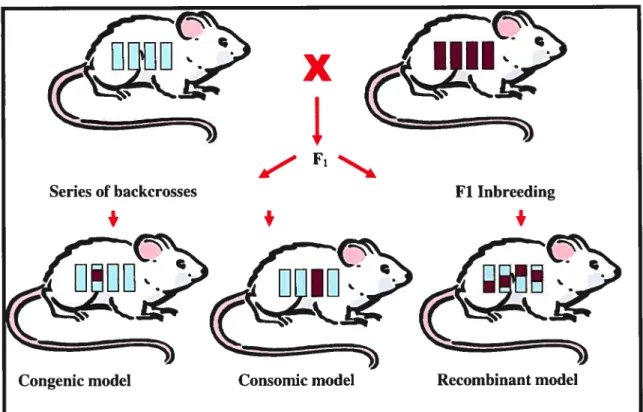
Such models include consornic, congenic and finally recombinant models (Figure 5).
These strains have been crossed between brother and sister for rnany generations (about twenty) in order to obtain a good hornogeneity (40). The goal in doing these crosses is to
create strains which are rich in alleles which code for high arterial pressure. In this
mai-mer, some strains are selected for their high arterial pressure while others are selected for their low arterial pressure (41).
Transgenic models permit the study of candidate gene function by altering the level of expression of the gene. The targeting of candidate gene expression can be
specific or not (targeting of simple gene). The targeting technique of a simple gene
permits us to abolisli the function of one gene or to duplicate the gene of interest. The first application of the transgenic model for hypertension was in the mouse. Examination of candidate genes known for their implications in a signaling pathway which is irnpÏicated in the control ofarterial pressure yielded an analysis of almost ten genes; these genes were part ofthe renin angiotensin system.
More and more researchers use animal models, such as the rat, to aid their research in hypertension. Today many rat strains exist and each offer their specific characteristics. Recombinant models are a useful tool in the localization of mendelian traits. Consomic and congenic models facilitate to target the chromosomal region which contains the QTL. In consomic models, a whole chromosome is substituted whereas in the congenic model only a segment of a chromosome is substituted. Consomic models are widely used to study the effect of the chromosome on arterial pressure. These strains, in the future, can then be converted to congenic strains. Congenic strains have the advantage of directly targeting the predetermined QTL region by using linkage analysis studies. The QTL regions can then be easily reduced by fabricating other congenic sub-strains.
Figure 5 —Genetic tools using the rat
Even though the rat bas been known to transport dozens of diseases and is comrnonly known as a pest, it bas contributed a great deal to hurnans and their health by helping us to better understand the complexity of human diseases. The laboratory rat also
known as Rattus norvegicus originated from central Asia and is one of the first mammal
species to be domesticated for scientific research in 1 $2$ (42).The first genetic studies using the rat studied the color of their fur as a mendelian transmission trait (43). Even thought studies using rats had a very promising beginning, the mouse quickly became the model of choice for genetic studies in mammals. In contrast, the rat stiil remains the model of choice for research in physioiogy, nutrition, as well as other biomedical
research where more than 235 rat strains are used.
The Dahi Sait-Sensitive rat (Table II) is an example of an available strain used in
hypertension research. In 1963, Dahi started crossing rats which were seiected for their sensitivity (S rat) and resistance to sodium (R rat) (47). Rapp then foilowed by creating strains which were a cross between brother and sister, therefore creating a prototype model for the study of hypertension (45). The S rats dcveiop hypertension with a iow sait diet but this hypertension is significantiy augrnented when a high sait diet is introduced (2 to 8% NaCÏ).
During the selection of rats which were sensitive to sait, other rats were selected specificaiiy for their resistance to sodium. One such strain was the Lewis rat (Lew) which dernonstrated a high resistance (46). This is surprising because Lew rats had previousiy not been selected for their resistance to sodium. In addition to having a high resistance to
sodium, 45% of the microsatellites from the Lew genome are polymorphie with those of
the S genome. In the case of the R rats, oniy 18% ofthe microsatellites were polymorphie with those of S (44). A larger percentage of polymorphic microsateliites increases the quality of genetic linkage.
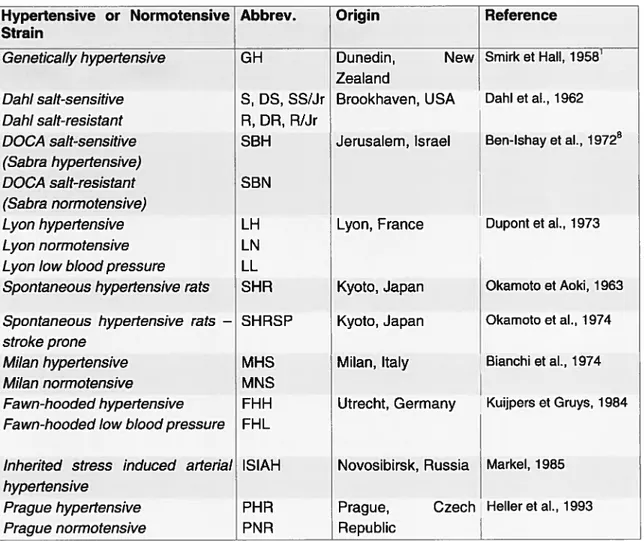
Hypertensive or Normotensive Abbrev. Origin Reference Strain
Geneticaliy hypertensive GH Dunedin, New Smirk et Hall, 19581
Zealand
Dahi sait-sensitive S, DS, SS/Jr Brookhaven, USA Dahi et al., 1962
Dahi sait-resistant R, DR, R/Jr
DOCA sait-sensitive SBH Jerusalem, lsrael Ben-Ishay et al., 19728
(Sabra hypertensive)
DOCA sait-resistant SBN
(Sabra normotensive)
Lyonhypertensïve LH Lyon,France Dupontetal., 1973
Lyon normotensive LN
Lyon iow biood pressure LL
Spontaneous hypertensive rats SHR Kyoto, Japan Okamoto et Aoki, 1963
Spontaneous hypertensive rats — SHRSP Kyoto, Japan Okamoto et al., 1974
stroke prone
Milan hypertensive MHS Milan, ltaly Bianchi et al., 1974
Milan normotensive MNS
Fawn-hooded hypertensive FHH Utrecht, Germany Kuijpers et Gruys, 1984
Fawn-hooded iow biood pressure FHL
inherited stress induced arteriai ISIAH Novosibirsk, Russia Markel, 1985
hypertensive
Prague hypertensive PHR Prague, Czech Heller et aI., 1993
Praguenormotensive PNR Republic
Table II- Strains of rats selectively developed for the study of hypertension
Chapter 3
Study of genetic linkage analysis
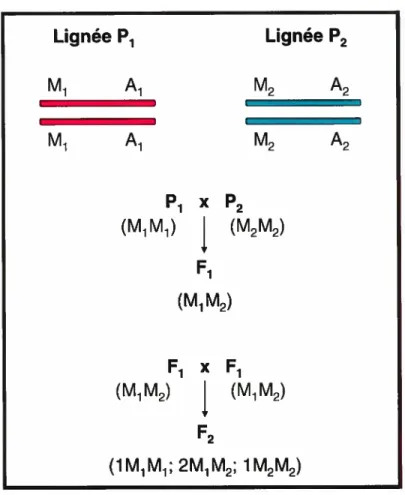
A genetic linkage study is based on the co-segregation of which occurs inside a certain population. To explain co-segregation and genetic Iinkage in mammal models, Rapp has given an example using 2 contrasting strains for each studied phenotype, which in this case is arterial pressure. In the example lie uses, these are called Pi and P2 (47). The M marker is a microsatellite for tlie M locus whicli is Iinked to QTL A for arterial pressure (figure 6). The Al ailcie of the Pi strain is tlie allele tliat dirninislies tlic arterial pressure, whereas the A2 allele of the P2 strain is the allele that augments the arterial pressure. In this example, we have the Ml marker which is linked to QTLA on the Ai allele whicli dirninishes arterial pressure and the M2 marker linked to QTLA on the A2 allele which raises the arterial pressure. Due to the fact that these two strains are produced from brotlier-sister crosses for many generations, the rnarkers and loci are both homozygous for their alleles. Meaning that the studied gene or trait is followed through generations by following the specific rnarkers whicli are Ïinked to the alleles in that strain.
A large population is necessary to do a genetic linkage study. An fi population is obtained by crossing the Pi and P2 strains. The F2 population is obtained by inbreeding the Fi population. The f2 population is then phenotyped for arterial pressure (in the case of our studies by telemetry) and genotyped using PCR with a microsatellite for the locus. During these crosses, the markers and alleles segregate using Mendel’s tlieory (1:2:1). The arterial pressure observed is compared using statistic tools (sucli as ANOVA). In this example differences in arterial pressure will be observed because the marker is linked to a QTL for arterial pressure. The bigger the distance between tlie marker and the QTL, the
higher tlie possibility of a recombinance. This diminishes the possibility of co
Q
Lignée P1 Lignée P2 M1 A1 M2 A2 M1 A1 M2 A2 Pi X P2 (M1M1) (M2M) F1 (M1M2) F1 x F1 (M1M2) (MM) F2 (1 M1 M1; 2M1M2; 1M2M2)figure 6- Co-segregation during linkage study
Picture based on a representation of article by Rapp et al.
The next step in a genetic linkage study is to localize the QTL on a chromosomal map and to identify the influence of this QTL on the arterial pressure. The potency of a QTL can bring upon difficulties in finding its exact position. For example, an effect on arterial pressure linked to a specific marker can be caused by a QTL which is situated in proximity to the marker used in the study, or to a QTL situated at a greater distance from the marker. This ïs due to the fact that the QTL’s influence on arterial pressure is so large that it is observed to be Iinked to the marker which is situated farther.
Many statistical tools have been put in place to facilitate the localization of a chrornosornal QTL. One such tool is MAPMAKERJQTL(48). This program predicts the possibility of the presence of a QTL by calculating logarithrns where a resuit is obtained
under aLOD connotation. A LOD is a log ratio of the possible presence of a QTL versus
thc possible absence of a QTL. The resuits obtained by these calculations are presentated
in the fonu of a graph where the LOD is calculated at rnany intervals between the
rnarkers. The graph has the chrornosornal positions on the x axis and the LOD score on
the y axis. The interval where the LOD score is the highest is the chromosomal region
which is the most susceptible of containing a QTL for arterial pressure. A LOD score
higher than three is deemed significative. The interval of confidence is influenced by
rnany factors such as the strength of the QTL on the observed phenotype, the size of the studied population and the density of the rnarkers used.
Even if these factors are taken into consideration during the preparation of an experiment, the localization of a QTL by genetic linkage only lirnits us to a chrornosornal interval of approxirnately 20 to 30 cM (49). $uch a region contains hundreds of genes. Researchers then have to use to use another rnethod to reduce the number of candidate genes.
Another problem which arises during genetic linkage studies is the analysis of
information obtained fromLOD curves. There is always a high possibility ofthe prcsence
of rnany QTL5 on a single chromosome. If the distance separating these two QTLs is superior to 80cM then there is a chance that these two QTLs segregate in an independent manner. This can be observed by two peaks on the graph. In the opposing case, if the difference separating the two QTLs is inferior to 80cM, the curve will not indicate the presence ofmany QTLs due to the fact that only one peak will be observed.
The presence of rnany QTLs on a single chromosome can also indicatc a possibility of an interaction arnongst them. If the interaction is additive, we may observe
an amplification or a canceling out of theLOD score. In the first case, both QTLs have an
effect of increasing arterial pressure then a high LOD score for a specific locus will be
obtained. Therefore, by isolating the locus, there is a high possibility that’s its effect on
arterial pressure will not be as significant as previously noted. A canceling out of aLOD
results from an additive interaction of 2 QTLs with opposite effects on AP.
Epistatic interactions are another form of interaction that QTLs may have. Such
an interaction is common for complex traits but also difficult to identify due to the fact
that it may give a non-significant LODscore. This kind of interaction will be explained
Cliapter4
Congenic Strains
The presence of a blood pressure QTL on a chromosome cannot be proven simply by assessing a genornic study (50). With genetic linkage analysis studies, a very large QTL region is obtained. This region is too big to justify positional cloning and statistical analysis of these studies also present certain interpretational problems. Therefore, a physiological study must be done to show that the rcgion predicted by the genornic study really does have an effect on arterial pressure. To accomplish this, we use congenic strains which pernit the molecular study ofthese QTLs (51).
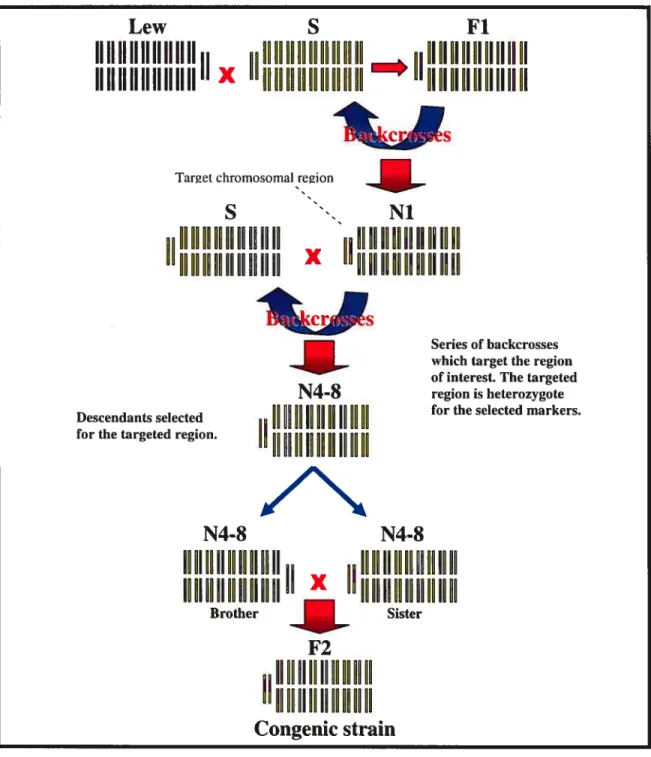
Congenic strains permit us to target a region of interest in the animal genome (Figure 6). The following example which was given by Rapp explains the construction of a congenic strain. The donating strain bas a M1M1 genotype for the marker in the M locus. The receiving strain has a M2M2 genotype for the marker in the M locus. The receiving strain means that the genetic background of the congenic strains wiÏl come from this genotype and that this strain will accept the homologous segment of the donating strain. In this example, the goal is to obtain a genetic background of M2M2 genotype with a chromosomal M1MI region. An Fi population is produced by crossing thcse two sixains. This population will have a M1M2 genotype. The population is then crossed with the receiving strain. A population with the genotypes M1M2 and M2M2 will then be obtained. The heterozygotes will again be selected to be bred once more with the receiving sixain. This backcross is done eight times in order to assure the homogcneity of the genetic background (52). Once the genetic background is homogenous, two MIM2 heterozygotes for the targeted region are intercrossed. We then obtain a population with a genetic background homogenous to the M2M2 genotype and having M1MI, M1M2 and M2M2 genotypes for the targeted region. The rats which contain M1MI for the region ofinterest are then chosen for the quantitative studies ofthe studied trait.
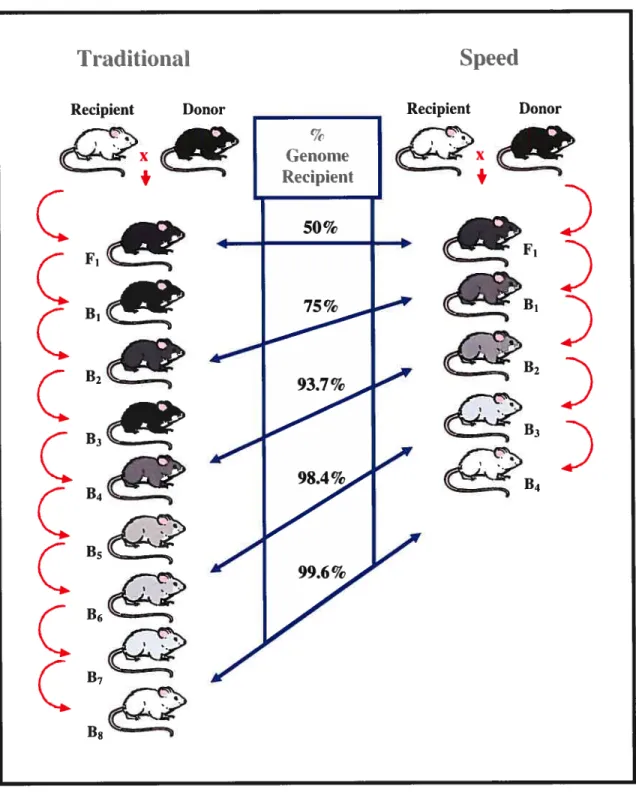
Due to themanybackcrosses, congenic strains take between two and four years to
construct. With a arger amount of avallable rnarkers in the rat, the amount of tirne
necessary to construct congenic strains can be shortened by using the speed congenics
method (53). This method uses rnarkers dispersed throughout the genome, as well as the rnarkers in the region of interest, to genotype the rats. This method perrnits to obtain congenic strains in a matter of 15 to 18 rnonths (figure 7).
Consequently, by constructing many congenic sub-strains for a QTL region we succeed in localizing the blood pressure QTL. $adly, the srnallest possible region we can identify using this rnethod is I cM because the possibility of recombination between two nearby rnarkers is low (54). Once the QTL region is reduced to 1cM, positional cloning can then start. Many articles have bcen published with QTL for blood pressure localized and reduced thanks to congenic strains (55-65).
37
Lew
S
Fi
UIUIIIIIIIIIIUIUII
10101I101111011111
DIIIOIOIIIIIHHII
UIUIIIUIIIIIIUIUII
101111101111010111
llIlhIIlIIIOIHHhI
Target chromosomairegionS
Ni
1111111011111111111
0O0IUOUU0IIHIIUUG
lI 10101110 II II II II
X
00 01100011 VIII INU
f2
VIVO II II UI UI UI VIII
II Il H H H 00000V AN
Congenic strain
Figure 7- Schematic representation of the construction of congenic strains.
The parent strains S and Lew are crossed to obtain the heterozygous Fi population. This population is recrossed with th parental S strain. We then obtain the Ni population which is genotyped and the rats which are heterozygous for the markers flanking the chromosomal targeted region. A series of backcrosses are performed with these rats to obtain a population which is heterozygous (SL) for the targeted region and homozygous for the genetic background. The brothers and sisters having these characteristics will be crossed w obtain an $5 descendance for the chromosomal background and LL for the targeted region. The rats are then crossed to obtain a stable congenic strain. Picture based on a representation from article by Cowley Jr et al (73)
I
N4-8
UI 11110101 IN H UI III
UI 11111010 IN 1110111
Descendants selected for the targeted region.Serïes of backcrosses which target the region of interest. The targeted region is heterozygote for the selected markers.
N4-8
H 1011110011 110011
H 0101101001 1010111
SisterN4-8
1011011111 011101 II
Il Il 11H10 11V VIII
H
Brother38
Traditional
Speed
Recipient Donor Recipient Donor
Genome
c!’
RecipientC
II f 50% C’F1 B2 ‘ B2B3C
CB
Bi) B47
B6 %=—C
C B7Figure 8- Method used to obtain rapid congenic strains (speed coltgenics)
The bacboss generations are reduced by approximately 50%. This approach uses polymorphic markers dispersed throughout the genome in equal intervals. figure from McB ride et al. (2003) (26).
Chapter
5
QTL Mapping
Before the sequencing of the rat genorne, finding rnarkers in the region of interest was more or less a question of chance. Many versions of genetic linkage and radiation hybrid maps have been published. These versions vary depending on the markers which are positioned and the distances between them. Therefore, the rnarkers must not only be poÏymorphic but also situated at the right position and one lias to integrate information from many maps.
This rnethod is stili widely used today but it is facilitated by the use of genornic sequencing. Thanks to this technique, it is now possible to position the rnarker on a chromosomal map with high precision. The main obstacle that one does face are the
“holes” on a genetic linkage map (meaning a region on map where no polymorphie
marker has been found). In the recent past the number of “holes” bas been significantly reduced.
However, it is very important to note that the information obtained through the genomic sequence is not a certainty. By aligning the sequence of a marker with the available genomic sequence we obtain the markers position on the chromosome. Nevertheless, it is only by genotyping the marker using the congenic strains that we can
confinn its position on the chromosornalmap.
A genetic map which is rich in markers perrnits us to characterize the congenic strains with higher precision. This is accornplished by having a smaller distance between markers and therefore reducing the ambiguous regions. Smaller ambiguous regions in congenic strains facilitate the localization of the QTL by dirninishing the QTL region. Many groups have demonstrated that a larger number of markers used in their studies have aided the localization ofblood pressure QTLs. (66-68)
40
5.1 Microsatellites
Microsatellites are short tandem repetitions found throughout the non-coding
genome of eukaryotes. These repetitions appear to be due to siiding during DNA
replication (69). These repetitive sequences can be under mono-, di,-, tri or
tetranucleotide form. Microsatellites vary in length and can be genotyped by a simple PCR reaction.
By comparing the human genome to the mouse genome, one notices that there are more microsatellites in the mouse genome. Also, these microsatellites have a tendency to be longer. On the other hand, when comparing the mouse and rat genomes, the differences are less noticeable.
S
L
Figure 9-Example of PCR genotyping
An example of genotyping done by PCR demonstrating a heterozygote (SL) and a homozygote (SS) and controls on the righ[ hand side.
Unpublished data V. Eliopoulos et al (2005)
With the sequence of most genes now available to any laboratory, the list of oligonucleotides used to amplify microsatellites by PCR have now become more
extensive. Certain laboratories have now specialized in the identification and
characterization of microsatellites and the synthesis of oligonucleotides which are necessary to amplify them. This work creates a large database for microsatellite use.
- — tr
These microsatellites are in turn used to make genetic linkage maps. These maps have been established for each chromosome of the rat. These microsatellites allow researchers to place their target on a chromosome, thus calling them genetic markers. For a specific marker to be useful, it must be polymorphie for the strain of rat which is studied.
Many marker databases are available on the Internet (Table 3). This information
can be under the formn of a table or a map. In these tables or maps, one can find the
approxirnate positions of the chromosomal markers. There are also databases which offer information on marker polymorphism, their optimal temperatures for PCR and finally the oliginucleotides used in PCR amplification.
Tools Internet site
http ://ratmap.hgc
.j
p[Marker_search.html http://www.broad.mit.edulrat/public/Genetic http://www.broad.mit.edu/rat/publicI
markers http://www.well .ox .ac .uratmappingresources/markers_info/ http://ratmap.org/ResuttSearchLocus. htm?citno=666v
http://www.well.ox .ac .uklrat_mapping_resources/marker_polytest.html http://www.niams .nih.gov/rtbc/ratgbase/dataJARBPR3 .htm
http://ratmap.hgc .jp/comp.html
Genetic http ://ratmap.hgc .jp/menu/maphtm1
linkage maps http://ratmap.org/ChromapnyPh.html
http://ratmap.org/Idiogram.html
http://ratmap .orglgene_mapping_datalintegrated_Iinkage_maps/ http://rgd.mcw.edu/tools/maps/maps_view.cgi ?id= 1 006&chr=3
http://www.well .ox.ac .uklrat_mappingjesources/rat_RH_comprehensive_maps .html
Hybrid http://www.broad.mit.edulrat/public/
radiation maps http://www.rgd.mcw.edu/tools/maps/maps_view.cgi ?id= 1002
http://www. wetl oxac uk/rat_mapping_resources/rat_RH_framework_maps.html