Study of retention variability on an early growth stage herbaceous plant
using a 3D virtual spraying model
Mathieu Massinona, Benjamin Dumonta, Nicolas De Cock a, Sofiene Ouled Taleb Salah a∙b,
Frédéric Lebeau a
a Precision Agriculture, Biosystems Engineering Department, Gembloux Agro-Bio Tech,
University of Liege, 2 Passage des Déportés, 5030 Gembloux, Belgium b AgriculturelsLife, Gembloux Agro-Bio Tech, University of Liege, 2 Passage des Déportés, 5030 Gembloux, Belgium
ABSTRACT
A model predicting the spray droplet interception and retention by a single virtual plant has been developed. The model was based on three main experimental inputs: the 3D architecture of a barley plant, the spray quality and the droplet impact behavior. Two contrasted formulation scenarios, limits of the common range covered by pesticide application in terms of surface tension, were tested by changing the droplet behavior at impact in the model. Simulations were undertaken for studying the variability of spray retention resulting from spray quality, applied volume and plant size for a difficult-to-treat target. Results showed that the spray retention efficiency ranged from 6.8% to 96.6% of a theoretical full adhesion scenario, where all intercepted droplets were captured, according to spray quality for the two formulation scenarios tested. Average retention increased with increasing spray fineness, applied volume per hectare and plant size. Variability of deposits, evaluated using the coefficient of variation of simulated retentions, was found to be a function of the mean droplet density according to CVα NT-0.68, where CV is the coefficient of variation and N the number
of droplet per square centimeter. Variability was also found to be a function of the plant size according to a relation CV α S-0.5, where S is the total leaf area of the plant model. The
variability of deposits increased with decreasing spray fineness, applied volume per hectare and plant size because of the reduced number of droplets contributing to retention. Wetting properties greatly influenced retention but surprisingly poorly influenced the variability of deposits. Such a modeling approach that is capable of an independent investigation of the influence of various parameters on spray retention can be used to improve understanding of application methods and adjuvants that could help minimizing development of resistance in problematic weed species.
Keywords: Spray retention Droplet impact Plant architecture Weed control Modeling 1. Introduction
The economically and environmentally driven reduction of applied doses of agrochemicals must be performed carefully to keep high efficacy. This must be done according the plant species and growth stage as some operating choices on a given target can be inefficient and present high efficacy variability (Knoche, 1994). For instance, the variability of pesticide deposits on target plants, which could be used as indicator of application efficacy, may increase when using large droplets on small targets for comparable application volumes (Miller et al., 2010), and this variability tends to increase with reducing application volumes (Butler Ellis et al., 2007). The variability of spray deposits arise from the application technique, e.g. the volume per hectare applied, the droplet size distribution, droplet impact velocity and droplet directions in relation with the plant and canopy architecture because some misdirected droplets may miss their target. Another source of variability originates from
the different droplet impact behaviors that may occur on a leaf surface; mainly adhesion, rebound and splashing, depending on the surface hydrophobicity and roughness, its orientation and the droplet impact energy and surface tension. When using agrochemicals for weed control, the variability of applied doses can lead to the selection of naturally resistant individuals in the weed population because of the insufficient dose received for killing the plant (Henriet and Maréchal, 2009). Faced to the great complexity of a spray application due to the number of factors involved that are inextricably linked, comprehensive spray retention trials become a resource consuming task that could be overcame by using a simulation approach (Nairn et al., 2013).
Mathematically and physically based models are developing increasingly to understand, predict and optimize the spray application of plant protection products. The first models that focused on the droplet transport were based on the resolution of the ballistic droplet motion equations (Marchant, 1977). Then trajectory models were improved by including the atmosphere turbulence statistics in random-walk models (Holterman et al., 1997; Walklate, 1987) or using a computational fluid dynamics modeling taking into account drift (Reichard et al., 1992). However, such models have a simple assumption of the droplet impact behavior on leaf surfaces, that is to say if the plant intercepts the droplet it is always retained, or the droplet impaction is seen as a binary event; adhesion or splashing with transition boundary between them depending on Ohnesorge and Reynolds numbers (Vander Wal et al., 2006). The description of the plant architecture is often made using geometric fittings (Cox et al., 2000) or using existing functional-structural models (Dorr et al., 2008). The development of fast and low cost 3D scanning systems could be an interesting alternative for modeling purpose (Paulus et al., 2014). More particularly, such devices could provide the real architecture at the plant scale, even for early growth stage weeds that present small, stiff and superhydrophobic leaves, on which a treatment could be very variable.
Spray—canopy interaction models are being developed taking advantage of 3D scanning systems including the droplet behavior at impact. Spray retention models are based on the possible behaviors of droplets during impaction on leaf surfaces including physical parameter known to determine the droplet—leaf interactions (Massinon and Lebeau, 2013; Taylor, 2011). A possible approach consists on using process-driven models that include experimental correlations between physicochemical parameters and the droplet impact behavior on leaf surface (Dorr et al., 2014) or using an universal spray adhesion model based on a huge experimental studies of droplet impaction using microdrop generator (Forster et al., 2005) on various leaf surfaces. While these approaches can be easily generalized for any new spray scenario, discrepancies between predicted and measured retentions may arise when using the model in out of the range from which they have been designed for, for instance on hairy leaves. Such models focus on the mean spray retention levels without consideration of the variability linked to a spray application of pesticide, in which some agronomic consequences are not perceived i.e. herbicide resistance. Finally, the behavior of the whole range of spray droplets could be studied on an artificial or natural superhydrophobic surface using high speed imaging (Massinon et al., 2014; Massinon and Lebeau, 2012b). Using this approach, the probability of droplet impact for each possible outcome is assessed depending on the droplet impact energy, the leaf surface wettability and the leaf orientation. This approach highlights the coexistence of different droplet impact outcomes for similar impact energy that may arise from the spatial variability of leaf surfaces. This approach makes use of the real spray impaction behavior on a given target surface but requires experimental data for every new leaf type, impaction angle and spray formulation.
Using the latter approach, a spray retention model based on spray droplets behavior at impact on 3D plant architecture is developed in this paper. The in silico model is used to
independently investigate the role of some key factors expected to affect spray retention variability on a difficult-to-treat plant, i.e. superhydrophobic leaf surface coupled with small and slanted leaves. It has been chosen as a combination of a typical droplet behavior on superhydrophobic surface and herbaceous plant architecture with thin slanted leaves. Particularly, the effect of plant size as a function on the spray quality and the applied volume on spray retention will be discussed for two extreme wetting scenarios, called low and high wetting scenarios in this paper. The target surface is artificial in order to focus on the contribution of the application technique and the plant architecture to the overall variability of spray retention. The final goal being to assess the mean retention levels and the related variability resulting from the spray application technique and the formulation tested.
Fig. 1. Reconstructed 3D model of a two leaf barley plant: (left) mesh of triangles comprised
of 2,449,710 vertices and 816,570 faces, (right) mesh of triangles comprised of 2448 vertices and 816 faces.
2. Materials and methods
2.1. Model overview
Models of droplet interception, impaction and retention have been developed to study the effect of involved factors and their interactions on the variability of spray retention by plant leaves. These models were integrated into an algorithm that requires three mains experimental
inputs from laboratory measurements for computing spray retention (amount of product actually retained by the plant per leaf surface projected unit area): the plant architecture, the droplet size and velocity distributions and the spray droplet impact behaviors. The algorithm has been developed on a generic mathematical software package, Matlab®, and run on a
standard personal computer. 2.1.1. Plant architecture
A DAVID Structured Light Scanner SLS-2 (DAVID Vision Systems GmbH, Koblenz, Germany) was used to reconstruct a 3D plant model. It is composed of an industrial USB CMOS monochrome camera (1280 x 960 pixels, 25 FPS) with a focusable lens (12 mm) and a HD video projector providing structured light patterns. This 3D system allows a scan size of 60—500 mm with accuracy up to 0.1% of the object size. The calibration was performed using the DAVID calibration panels set.
An indoor grown barley plant at two leaf growth stage has been chosen to provide the 3D plant architecture model, a plant often used in laboratory retention trials. The scanning was performed using the DAVID Laserscanner Pro Edition 3 software. The plant was placed on an accurate custom made rotating table and scanned at 30° steps over 360°. The scanner used 58 time-coded white light patterns with phase shift which were oriented both horizontally and vertically. The result of a scan was filtered with a quality check implemented in the software. For every point of the cloud, a confidence value is computed based on the measured surface reflections. Points with low confidence level were removed. This parameter was set at 0.5 in the DAVID Laserscanner Pro Edition 3 software. Some data points belonging to the background were removed using the cleaning tool of the software for each scan. The alignment of the scans was also performed using the DAVID Laserscanner Pro Edition 3 software, using the imposed angle of rotation of the rotating table as constraint. The fusion algorithm is based on a fast pairwise surface registration (Winkelbach et al., 2006). One hundred point pairs between scans were created and 20 iterations were performed in the surface registration. During the fusion, the resolution was set at 4000 in the software, providing an expected vertex spacing of about 60 µm. The 3D plant surface was exported in STL format (STereo Lithographic) and was composed of a dense mesh of triangles comprised of 2,449,710 vertices and 816,570 faces (Fig. 1). The reconstructed virtual plant was not watertight, which means that holes were not closed during the fusion of the different views. The scanning procedure provided high levels of microsurface details that were not essential in this study since they resulted in undesired surface orientation gradients (Kempthorne et al., 2015) that may skew the droplet incidence angle computation. In addition of this, a high density mesh required a higher computational time for the spray droplet interception algorithm (described below). The main objective was to obtain a realistic virtual representation of a whole herbaceous plant that can be used in an agricultural spray retention model as a reference for comparative simulations. The number of triangles of the 3D plant mesh was therefore reduced of a factor 1000 using the quadratic edge collapse decimation filter (Garland and Heckbert, 1997) implemented in MeshLab (free and open-source 3D mesh processing software) and resulted in a new mesh comprising 816 faces and 2448 vertices. Geometric features of the plant model before and after the mesh simplification are provided in Table 1. The projected leaf area relative to the vertical spray direction has been computed using image segmentation on the projected view of the plant model in the normal plane (ground). The simulation time was therefore reduced according to the same ratio. The mesh simplification reduced the total leaf surface area but preserved the overall shape of the plant. In consequence, the computed retention rates will also be smaller, which was not problematic from a comparative point of view of the simulations. Nevertheless, improvements of the surface reconstruction could be reached using the recent approach proposed by Kempthorne et
al. (2015), which guarantees surface reconstruction with continuous gradient. Another interesting approach could be based on the Lindenmayer system (Prusinkiewicz and Lindenmayer, 1990) to provide a well characterized plant model that could be used as a standard for comparing existing spray retention models.
Table 1: Dimensional features of the 3D barley plant used in simulations.
Mesh simplification No Yes
Dimensions [x y z], cm 2.70 × 2.56 × 20.46 2.62 × 2.47 × 20.35
Total leaf area, cm2 25.26 20.32
Projected leaf area, normal plane [0 0 1], cm2
1.62 1.43
Number of triangular faces 816,570 816
Number of vertices 2,449,710 2448
2.3.2. Droplet features and virtual nozzle
Droplet size distributions of six flat-fan hydraulic nozzles were used to explore various common spray qualities. The droplet size distributions were measured by high-speed shadow imagery 500 mm downwards the outlet of the nozzle (De Cock et al., 2014) with water. Table 2 shows reduced descriptors of the droplet size distributions. The choice of these nozzles/pressure combinations has been made according to the ISO draft standard (ISO 25358) for classification of droplet size spectra. These nozzles/pressures are expected to be used as boundaries between very fine (VF), fine (F), medium (M), coarse (C), very coarse (VC), extra coarse (XC) and ultra coarse (UC) classes.
From these measurements, a virtual nozzle was built by drawing droplet diameters randomly until a given volume per hectare was reached using the Pearson system for random numbers (beta distribution). Random droplet diameters were generated to provide a good match with the initial size distribution parameters: the mean, standard deviation, skewness and kurtosis. Fitting a continuous distribution on the discontinuous measured droplet size distributions allowed generating the whole possible droplet diameters from spray application. Then, a virtual sprayed area was chosen at one square meter. Droplet coordinates were drawn within this area using uniformly distributed random numbers U(0,1000) in millimeters. The sprayed area was afterwards divided into a grid of squares of identical size. The size of the cells has been adapted to fit to the 3D plant model. Each grid cell contains a different droplet size distribution resulting in various applied volumes representative of the field spatial variability. Fig. 2 shows, for instance, the variability between 144 droplet size distributions (12 x 12 grid) depending on the nominal applied volume per hectare. The coefficient of variation (CV) decreases as the nominal volume per hectare increases because the number of droplets increases. The spatial variability in applied volume is the first reason of variability in spray retention.
Droplet velocity for each diameter was randomly drawn from a normal distribution N(µ,σ), where the mean µ was computed from droplet transport and evaporation equations (Guella et al., 2008) with still air hypothesis at 21°C and 55% RH, water droplets at 20° C with 16 m/s of initial velocity and the standard deviation σ was chosen at 0.1 m/s based on droplet impaction observation (Massinon and Lebeau, 2012b). Droplet trajectories immediately above
the plant were assimilated as straight lines. Directions were drawn from the normal distribution N(µ,σ), where µ is the main spray direction and σ were chosen at 10° and 20° for the short and long axis of flat-fan spray ground pattern, respectively.
Table 2: Reduced descriptors of the droplet size distributions for the six nozzles used in the
simulations measured with pure water.
Nozzles and
pressures 110 01 @4.5bars 110 03@3.0bars 110 06 @2.5bars 80 08 @2.0 bars 65 10 @1.5 bars 65 15 @1.5 bars
Class boundary VF/F F/M M/C C/VC VC/XC XC/UC
Dv10 [µm] 88 119 138 165 201 221
Dv50 [µm] 154 239 304 375 479 532
Dv90 [µm] 232 414 532 612 786 927
Fig. 2. Variability of the effective applied volumes depending on the nominal applied volume
(110 03 flat-fan nozzle at 3 bars, 144 droplet size distributions).
2.3.3. Spray impact on the 3D plant architecture and retention
The droplet interception by the plant model consists of testing whether each droplet direction intersects one triangle of the 3D plant mesh. A fast ray/triangle intersection algorithm has been implemented in the model according to Möller and Trumbore (1997). It translates each triangle to the origin of the coordinate system and transforms it into a unit triangle lying in a given plane, with the ray direction aligned with the normal axis to the plane. The outputs of
the algorithm are the intersection coordinates and the intersection distance from the ray origin. The algorithm keeps the first intersection between each droplet direction (ray) and the triangle. Triangles were considered as one sided, which means that intersections in single direction are counted and intersections with back facing triangles are ignored. Border points of the triangle were included. If a droplet was intercepted by a triangle of the 3D mesh, the impact behavior was used to determine the contribution of this droplet to the final retention. A droplet may either adhere, rebound or splash depending on its impact energy represented by the dimensionless Weber number where ρ is the liquid density [kg.m-3], Vis the
droplet velocity at impact [m.s-1], d is the droplet diameter [m] and γ the liquid surface tension
[N.m-1], and the leaf surface wetting regime. The spray impact behaviors were measured on an
artificial superhydrophobic surface used as a model of superhydrophobic leaf surface. The artificial surface was a completely polytetrafluoroethylene (PTFE) coated microscope blade (part number X2XES2013BMNZ, Thermo Fisher Scientific Inc., Waltham, MA, USA) with a roughness structure that enables a static contact angle of 169 ± 2° (sessile drop method, 5 replicates, CAM200, KSV Instruments, Helsinki, Finland) for a 5 µL distilled water droplet. The relevance of the use of this superhydrophobic surface as reference target surface has been studied in comparison with outdoor grown wheat leaves (Massinon and Lebeau, 2012a) using the method described in Massinon and Lebeau (2012b). This target surface has been chosen to control the variability linked to the surface in this study and therefore focus on the variability that the application technique and the plant size may introduce in the final spray retention. From image analysis, a phase diagram of the droplet impact velocity and diameter is plotted in Fig. 3 for a surface angle of 30° from the horizontal. Each point represents a droplet. In this study, only the first impacts of droplets on the plant model was computed because secondary impacts of droplets are very unlikely due to the low plant size and its vertical leaves. The impact phase diagram is divided into eleven energy classes whose boundaries correspond to a constant Weber number (Wew) computed with the water surface tension. The first limit was set
at Wew = 0.02. The first energy class contains droplets with a Wew below 0.02. Successive
boundaries correspond to a three times increase of the Wew. Such a phase diagram was
constructed from ten sprayings using a flat-fan nozzle mounted on a moving rail (Massinon and Lebeau, 2012b). In each energy class, the relative volumes of the various impact types were computed and assimilated as impact probabilities (Fig. 4) (Massinon et al., 2014). The energy class boundaries were chosen for gathering enough droplets for the assessment of the impact probabilities and for highlighting smooth transition between impact outcomes since different impact types may coexist at similar droplet impact energy levels (smaller droplets in Fig. 3). This effect has to be linked with the relative size of the droplet and the surface roughness; when the droplet and the roughness size are close to each other, this may result either in an adhesion or a rebound for the same impact energy level depending on where the droplet impaction occurs (either on the top or in the bottom of the roughness structure). For leaf surfaces, fouling, abrasion of epicuticular waxes or surface defects may increase this effect and lead to the onset of large contact angle hysteresis which promotes the liquid pinning on the surface (Chang et al., 2009; Ensikat et al., 2011). In the interception algorithm, the impact outcome is given to each droplet based on the probability maps such as Fig. 4 using the droplet incidence angle on the 3D plant model and its Weber number. The impact probability is computed by linear interpolation between the probability map measured for 0, 30 and 60° of surface orientations (Massinon et al., 2014). At 90° (vertical target surface), the impact probability is zero and the impact map was set at 100% of rebound. Tables 3 and 4 show the spray droplet impact probabilities on the artificial superhydrophobic surface depending on the droplet incidence angle and Wew for the low and high wetting scenario
Table 3: Impact probabilities (%) depending on the droplet incidence angle and water Weber
number for the 'low wetting' scenario on the artificial superhydrophobic surface. A: adhesion, R: rebound, S: splashing.
Surface angle energy class upper limit (Wew)
0° 30° 60° 90° A R S A R S A R S A R s 0.02 86 14 0 100 0 0 100 0 0 0 100 0 0.06 73 27 0 86 14 0 100 0 0 0 100 0 0.18 56 44 0 38 62 0 56 44 0 0 100 0 0.54 37 63 0 9 91 0 27 73 0 0 100 0 1.62 9 91 0 0 100 0 0 100 0 0 100 0 4.86 0 100 0 0 100 0 0 100 0 0 100 0 14.58 0 100 0 0 100 0 0 100 0 0 100 0 43.74 5 91 4 0 90 10 0 100 0 0 100 0 131.2 0 0 100 0 1 99 0 100 0 0 100 0 393.7 0 0 100 0 0 100 0 0 100 0 100 0 inf 0 0 100 0 0 100 0 0 100 0 100 0
Fig. 3. Impact outcome observations on the superhydrophobic artificial surface tilted at 30°
from horizontal for the low adhesion scenario (Teejet 110 03 nozzle at 3 bars 0.5 m height) as a function of the droplet impact velocity and droplet diameter. ∆ adhesion, rebound, + Cassie—Baxter splashing and × Wenzel (partial) splashing. Dotted lines are constant water Weber number computed with the water surface tension and represent energy impact class boundaries.
Table 4 : Impact probabilities (%) depending on the droplet incidence angle and water Weber
number for the 'high wetting' scenario on the artificial superhydrophobic surface. A: adhesion, R: rebound, S: splashing.
Surface angle energy class upper limit (Wew)
0° 30° 60° 90° A R s A R S A R s A R s 0.02 100 0 0 100 0 0 100 0 0 0 100 0 0.06 100 0 0 100 0 0 100 0 0 0 100 0 0.18 100 0 0 100 0 0 100 0 0 0 100 0 0.54 100 0 0 100 0 0 100 0 0 0 100 0 1.62 100 0 0 100 0 0 100 0 0 0 100 0 4.86 100 0 0 100 0 0 100 0 0 0 100 0 14.58 100 0 0 100 0 0 100 0 0 0 100 0 43.74 90 10 0 60 30 10 0 40 60 0 100 0 131.2 5 0 95 0 0 100 0 30 70 0 100 0 393.7 0 0 100 0 0 100 0 0 100 0 100 0 inf 0 0 100 0 0 100 0 0 100 0 100 0
Fig. 4. Impact outcome probability as a function of the water Weber number on the artificial
superhydrophobic surface tilted at 30° from horizontal for the low adhesion scenario: green: adhesion, red: rebound, dark blue: Cassie—Baxter splashing and sky blue: Wenzel (partial) splashing, + volume proportion of each energy class relative to total volume observed before impact. (For interpretation of the references to color in this figure legend, the reader is referred to the web version of this article).
When a droplet is splashing on an hairy leaf surface or a leaf with other micro-roughness structures (waxes), a part of the droplet may be trapped into the surface roughness depending on the liquid surface tension and the droplet impact pressure (Boukhalfa et al., 2014), such pinning impacts occur when the droplet lies in the Wenzel wetting regime (Wenzel, 1936), and are referred to as partial splashing in this paper. This behavior was included in the algorithm by multiplying the volume of the droplet by the proportion of droplet in volume remaining on the surface after a splashing in Wenzel wetting regime. This proportion, K, varies from 0 to 1. The choice of value for this parameter is described here after depending on the formulation scenario tested.
Two contrasted scenarios of spray droplet impact behaviors have been tested as range boundaries of the possible spray liquids wettability. The first scenario involved to simulate spraying pure water. With water, the volume proportion of bouncing droplets into the impacting spray is high (Table 3). This first scenario is therefore qualified of 'low adhesion scenario' in this paper. The parameter K (used for splashing outcomes) depends on leaf angle and its value was determined by linear interpolation from 0.45 for horizontal surface to 0 for vertical surface. The second scenario reflected the use of a super spreader surfactant. The static surface tension of such a non-ionic surfactant used in the impaction experiments was 21.5 ± 0.1 mN/m (5 replicates, CAM200, KSV Instruments, Helsinki, Finland). Because of the drastic reduction of the dynamic surface tension of the spray mixture, the proportion of bouncing droplets is reduced in favor of adhesion (Table 4). This scenario will therefore be referred to as 'high adhesion scenario'. The proportion K was chosen at 0.6 whatever the leaf angle for the non-ionic surfactant because of its very low dynamic surface tension (DST). It should be noted that the Weber number has been computed using the water surface tension for comparison purpose between formulations. However when dealing with surfactants, it is well established that the DST better correlated with retention (Anderson and Hall, 1989; Dorr et al., 2015), for which the appropriate time scale for its measurement scales with droplet contact time on the target surface (Richard et al., 2002). The contact time can be very small and the DST remains therefore difficult to measure. A fluid density of 1000 kg/m3 and surface tension
of 72 mN/m were used for the two wetting scenarios.
3. Results and discussions
One hundred different droplet size distribution samples have been used for each nozzle. This number was chosen to stabilize the mean retention. To avoid the variability due to droplet size distribution, the same set of 100 spray samples were taken for each simulation. Simulations were performed by applying a rotation around the vertical axis of the 3D plant model by steps of 15°, resulting in 25 different orientations of the plant sprayed each time with the same 100 droplet size distributions. The 3D plant model was always re-centered into the cell. The outputs of the simulations were the 100 computed spray retention for each of the 100 droplet size distribution samples. The spray retention was computed as the volume of retained liquid divided by the projected total leaf area along the main (vertical) spray direction. From the set of the 100 spray retentions, the coefficient of variation was computed as an indicator of the variability of deposits and therefore, an indicator of the efficacy of a treatment. A high coefficient of variation indicates a poor treatment efficacy since some plants may receive insufficient amount of active substance to achieve its effect.
Fig. 5. Relative cumulative distributions of spray retention observed for various spray
qualities at 100 L/ha application for the full adhesion scenario: 100 different sprays at 25 different orientations for each spray quality on the same original size plant.
Table 5: Median retentions [µL/cm2] for different formulation scenarios and spray quality boundaries at 100 L/ha application and ratios [—] with respect to full and low adhesion scenarios.
Scenarios Spray quality boundaries
VF/F F/M M/C C/VC VC/XC XC/UC Low adhesion 0.327 0.144 0.111 0.091 0.079 0.075 High adhesion 1.104 0.890 0.799 0.744 0.717 0.674 Full adhesion 1.144 1.136 1.131 1.120 1.117 1.094 Low/full adhesion 0.286 0.127 0.098 0.081 0.071 0.068 High/full adhesion 0.966 0.784 0.706 0.665 0.642 0.646 High/low adhesion 3.380 6.188 7.213 8.167 9.094 8.999
Table 6: Coefficients of variation [%] for different formulation scenarios and spray quality
boundaries at 100 L/ha application.
Scenarios Spray quality boundaries
VF/F F/M M/C C/VC VC/XC XC/UC
Low adhesion 4.722 8.761 12.579 17.214 26.706 N/A High adhesion 4.185 8.534 13.440 18.002 26.774 37.386 Full adhesion 4.494 10.220 15.476 19.781 28.279 38.088
Table 7 : Minimal retentions [µL/cm2] for 100 L/ha application with the different spray quality boundaries and high to low adhesion scenario ratio.
Scenarios Spray quality boundaries
VF/F F/M M/C C/VC VC/XC XC/UC
Low adhesion 0.2728 0.1039 0.0708 0.0520 0.0333 0.0221 High adhesion 0.9395 0.6797 0.4985 0.4047 0.3101 0.1779 Full adhesion 0.9480 0.8216 0.6549 0.5701 0.4514 0.2434
High/low adhesion 3.44 5.54 7.04 7.78 9.31 8.05
3.1. The effect of spray quality and spray droplet impact behaviors
A full droplet adhesion scenario has been performed for the different spray qualities at an application volume of 100 L/ha as benchmark (Fig. 5). The full adhesion means that all droplets are retained at impact. Retention was slightly greater than the nominal applied volume (100 L/ha) because droplets may impact the bottom of the plant thanks to their non-vertical trajectories. The increase of median retention ranged from 9% for the coarser spray nozzle to 14% for the finer spray nozzle because the number of droplets was higher. The variability of deposits was consequently greater for the coarser nozzles on this vertical target. The retention would have gradually tended towards the nominal applied volume as the plant leaves would have been more and more horizontal.
For the 'low adhesion' scenario (Table 5), the finer spray provided a much greater retention than other sprays because of the small proportion of the droplets lying in the rebound and splashing impact outcomes. For the high adhesion scenario, the reduction of the dynamic surface tension resulted mainly in an increase of the retention as expected because rebound almost disappeared (Tables 3 and 4). The benefit when using a super spreader surfactant increased as the spray quality increased, ranged from 3.38 times for the finer up to 9 times for the coarser spray quality (Table 5), because of the increased contribution of splashing droplets (larger droplets) in retention due to the pinning. Retention in the high adhesion scenario amounts almost to 96% to the full adhesion scenario for the finer spray quality, highlighting the high performance of surfactants with very small dynamic surface tension with very small droplets. Whatever the scenario, retention decreased as the mean droplet size increased and the droplet density decreased (number of droplets per square centimeter, Table 8) as highlighted by Miller et al. (2010). The modeled retention process efficiency (Table 5) ranged from 6.8% to 96.6% of a theoretical full adhesion scenario, which is close to the 10—100% range stated by Zabkiewicz (2007) for an herbicide application.
The variability of deposits increased as the spray coarseness increased because the number of impacts also decreased (Table 6). These coefficients of variation were not stabilized for the coarser spray quality because the number of droplets was insufficient. For instance, these coefficients of variation were different when moving the plant model into the cell grid and repeating the simulations. The value of the coefficient of variation was therefore not indicated in Table 6 for the coarser nozzle in the low adhesion scenario. Consequently, such coarse nozzles should not be used when treating small and hydrophobic species as highlighted by Miller et al. (2010), despite their high drift mitigation potentiality. Finally, no significant differences in variability were observed between the low and high adhesion scenarios, showing the leading influence of spray quality in retention variability.
The minimal retained volume of herbicide is an important parameter in weed control efficacy because an insufficient dose may reveal resistance in weed populations. For a given spray quality, Table 7 shows an increase of the minimal dose from 3 to 9 times with the high adhesion scenario relative to the low adhesion scenario. Whatever the spray quality studied,
the minimal retained volume decreased as the spray coarseness increased, which was related to the decrease of the number of droplets per unit surface area.
The treatment efficacy could be derived from these cumulative distributions of Fig. 6: for instance, in 10% of the simulations for the 11,001 nozzle, the plant retained 0.30 µL/cm2 for
the low adhesion scenario and 1.04 µL/cm2 for the high adhesion scenario. If the required
dose to control a given pest would have been at 0.4 µL/cm2, the use of a surfactant would
have been mandatory. Almost 100% of the pest population would have been controlled with the 110 01 nozzle, while only 90% of the plants would have received enough active ingredients with the 65 15 nozzle.
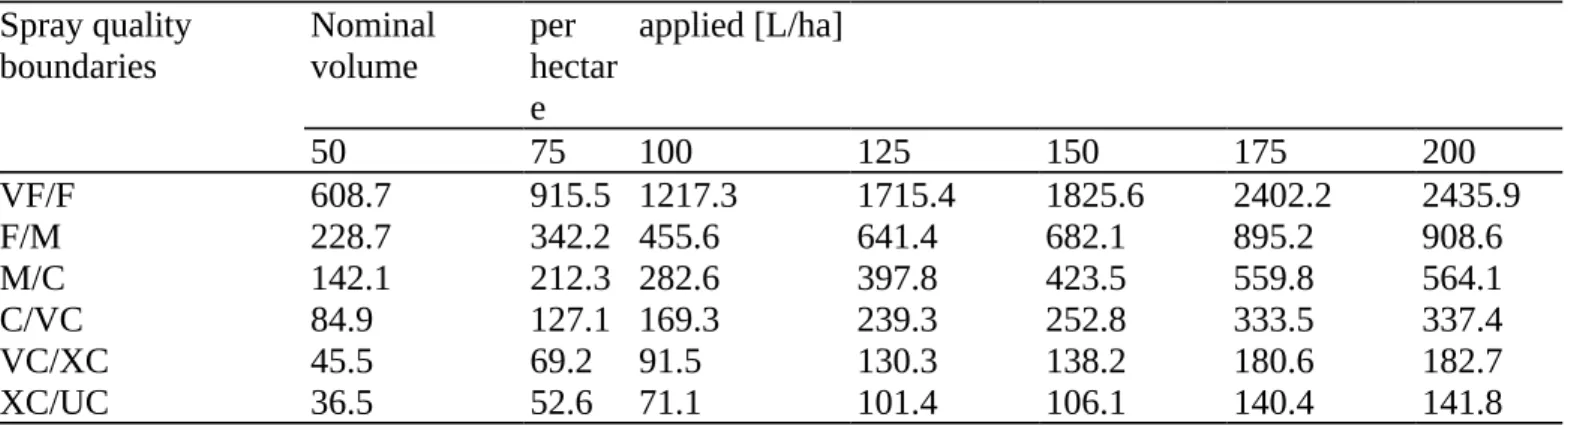
Table 8: Average number of droplets per square centimeter intercepted by the plant model
depending on the applied volume for each spray quality boundary for the high adhesion scenario. Spray quality boundaries Nominal volume per hectar e applied [L/ha] 50 75 100 125 150 175 200 VF/F 608.7 915.5 1217.3 1715.4 1825.6 2402.2 2435.9 F/M 228.7 342.2 455.6 641.4 682.1 895.2 908.6 M/C 142.1 212.3 282.6 397.8 423.5 559.8 564.1 C/VC 84.9 127.1 169.3 239.3 252.8 333.5 337.4 VC/XC 45.5 69.2 91.5 130.3 138.2 180.6 182.7 XC/UC 36.5 52.6 71.1 101.4 106.1 140.4 141.8
Fig. 6. Relative cumulative distributions of spray retention for various spray quality
boundaries at 100 L/ha application on the same plant: low adhesion (left) and high adhesion scenario (right).
3.2. Effect of volume per hectare applied and spray quality
As expected, the coefficients of variation of spray retention increased both as the spray coarseness increased and applied volume decreased (Fig. 7), because the number of droplet interceptions by the plant model at original scale decreased (Table 8). In the context of a
global trend to reduce application rates and promote drift mitigation techniques, often relying on coarser spray qualities, the variability of retention at the plant scale is therefore expected to increase dramatically on small difficult-to-treat targets. Fig. 8, that present the CV versus the number of intercepted droplets per unit of projected leaf area for the high adhesion scenario, highlights the preponderance of spray quality on retention variability even if the effect of the applied volume is not negligible.
3.3. Effect of plant orientation and size 3.3.1. Plant orientation
Fig. 9 shows the coefficients of variation for the different spray quality boundaries at 100 L/ha at different plant rotation angles (step of 15°) relative to the vertical plant model axis for the high adhesion scenario. Each coefficient of variation was computed from 100 simulations. This test aimed at highlighting whether the plant model orientation may lead to differences in spray retention. As already showed, the coefficient of variation increased as the mean droplet size increased. All the profiles looked almost circular reflecting no influence from the plant rotation because the spray direction was mainly vertical, tending towards a very circular profile with increasing the number of droplets and reducing the mean droplet size. There were no differences between the two scenarios tested.
Fig. 7. Effect of applied volume on the retention variability for the high adhesion scenario
Fig. 8. Retention variability depending on the mean number of droplets per unit of projected
leaf area for all spray qualities and the high adhesion scenario.
Fig. 9. Coefficient of variation [%\ depending on a rotation of the plant model around the
vertical axis by step of 15° for the high adhesion scenario and different spray quality boundaries at 100 L/ha.
Fig. 10. Coefficient of variation [%] as a function of the scaling of the plant model for the
fine/medium spray quality boundary and high adhesion scenario.
3.3.2. Plant size
The effect of plant size has been studied by changing the plant size with various scale factors, from 0.05 to 2 corresponding to a 0.051—81.222 cm2 range of plant leaf surface area. The X,
Y and Z vertex coordinates were multiplied by the same scale factor (SF). Simulations were performed using the fine/medium spray quality boundary at 100 L/ha for the high adhesion scenario (Fig. 10). The coefficient of variation decreased as the scale factor increased according to the fitted relation CV = 8.33-SF-1. The new total plant leaf area is computed as S
= S0∙SF2 where S0 is the initial total plant leaf area. Re-writing the first expression of CV
using the definition
with S0 = 20.32 cm2 (Table 1).
In conclusion, a 3D virtual spraying model to predict spray droplet interception and retention by single plant architecture has been developed and used for focusing on the variability of deposits in still air hypothesis. The model was based on the measured 3D plant architecture, on the use of a virtual nozzle for providing representative droplet size distributions and on spray droplet impact outcomes characterized with high-speed imaging and image analysis. The variability of spray retention by a single 3D plant model was investigated as a function of the spray quality, the volume per hectare applied and the plant size for two contrasted formulation scenarios representative of low and high spray liquid wetting properties. Results showed that retention ranged from 6.8% to 96.6% of a full adhesion depending on spray quality and formulation scenario. Average retention increased with increasing spray fineness, applied volume per hectare and plant size. The variability of deposits increases with decreasing spray fineness, applied volume per hectare and plant size because of the reduced number of droplet contributing to retention. The variability of deposits is mainly related to the
spray quality. Such a modeling approach can be used to improve understanding of application methods and adjuvants that could help minimizing development of resistance in problematic weed species. It could also be used to determine the optimum time of spraying by predicting the optimal retention potential depending on the target (Combellack, 1981).
Further studies may seek to find optimum spray droplet trajectories for such difficult targets that maximize retention acting on pesticide application method, e.g. spray angle modification. A plant architecture database at weeding growth stage will be further used to estimate the variability of retention that is encountered in field in order to relate deposits variability and the risk of herbicide resistance emergence.
References
Anderson, N., Hall, D., 1989. The role of dynamic surface tension in the retention of surfactant sprays on pea plants. Adjuv. Agrochem. 2, 51—62.
Boukhalfa, H.H., Massinon, M., Belhamra, M., Lebeau, E, 2014. Contribution of spray droplet pinning fragmentation to canopy retention. Crop Prot. 56, 91—97.
Butler Ellis, M.C., Knight, S., Miller, P.C.H., 2007. Spray behaviour and Efficacy of Herbicides and Fungicides Applied to Wheat at Reduced Volumes. AHDB Project Report (408). AHDB, London, p. 52.
Chang, F.-M., Hong, S.-J., Sheng, Y.-J., Tsao, H.-K., 2009. High contact angle hysteresis of superhydrophobic surfaces: hydrophobic defects. Appl. Phys. Lett. 95, 064102.
Combellack, J.H., 1981. An assessment of the problems of efficiently spraying herbicides onto weeds in cropped areas. In: Proceedings of the 6th Australian Weeds Conference, Gold Coast, Queensland, Australia, pp. 93—98. Cox, S.J., Salt, D.W., Lee, B.E., Ford, M.G., 2000. A model for the capture of aerially sprayed pesticide by barley. J. Wind Eng. Ind. Aerodyn. 87, 217—230.
De Cock, N., Massinon, M., Lebeau, E, 2014. Agricultural spray measurement by high-speed shadow imagery. Aspect Appl. Biol. 122, 363—370.
Dorr, G., Hanan, J., Adkins, S., Hewitt, A., O'Donnell, C, Noller, B., 2008. Spray deposition on plant surfaces: a modelling approach. Fund. Plant Biol. 35, 988-996.
Dorr, G., Wang, S., Mayo, L, McCue, S., Forster, W.A., Hanan, J., He, X., 2015. Impaction of spray droplets on leaves: influence of formulation and leaf character on shatter, bounce and adhesion. Exp. Fluids 56,1—17. Dorr, G.J., Kempthorne, D.M., Mayo, L.C., Forster, W.A., Zabkiewicz, J.A., McCue, S.W., Belward, J.A., Turner, I.W., Hanan, J., 2014. Towards a model of spray—canopy interactions: Interception, shatter, bounce and retention of droplets on horizontal leaves. Ecol. Model. 290, 94-101.
Ensikat, H.J., Ditsche-Kuru, P., Neinhuis, C, Barthlott, W, 2011. Superhydrophobicity in perfection: the outstanding properties of the lotus leaf. Beilstein J. Nanotechnol. 2,152-161.
Forster, W.A., Kimberley, M.O., Zabkiewicz, J.A., 2005. A universal spray droplet adhesion model. Trans. ASAE 48,1321-1330.
Garland, M., Heckbert, P.S., 1997. Surface simplification using quadric error metrics. In: Proceedings of the Proceedings of the 24th Annual Conference on Computer Graphics and Interactive Techniques.
Guella, S., Alexandrova, S., Saboni, A., 2008. Evaporation d'une gouttelette en chute libre dans l'air. Int. J. Therm. Sci. 47, 886-898.
Henriet, E, Maréchal, P.-Y., 2009. Black-grass resistance to herbicides: three years of monitoring in Belgium. Commun. Agric. Appl. Biol. Sci. 74, 471—478.
Holterman, H.J., van de Zande, J.C., Porskamp, H.A.J., Huijsmans, J.F.M., 1997. Modelling spray drift from boom sprayers. Comput. Electron. Agric. 19,1—22.
Kempthorne, D.M., Turner, I.W, Belward, J.A., McCue, S.W, Barry, M., Young, J., Dorr, G.J., Hanan, J., Zabkiewicz, J.A., 2015. Surface reconstruction of wheat leaf morphology from three-dimensional scanned data. Funct. Plant Biol. 42, 444-451.
Knoche, M., 1994. Effect of droplet size and carrier volume on performance of foliage-applied herbicides. Crop Prot. 13,163—178.
Marchant, J.A., 1977. Calculation of spray droplet trajectory in a moving airstream. J. Agric. Eng. Res. 22, 93-96.
Massinon, M., Boukhalfa, H., Lebeau, E, 2014. The effect of surface orientation on spray retention. Precis. Agric. 15, 241—254.
Massinon, M., Lebeau, E, 2012a. Comparison of spray retention on synthetic superhydrophobic surface with retention on outdoor grown wheat leaves. Aspect Appl. Biol. 114, 261-268.
Massinon, M., Lebeau, E, 2012b. Experimental method for the assessment of agricultural spray retention based on high-speed imaging of drop impact on a synthetic superhydrophobic surface. Biosyst. Eng. 112, 56—64. Massinon, M., Lebeau, E, 2013. Review of physicochemical processes involved in agrochemical spray retention. Biotechnol. Agron. Soc. Environ. 17, 494—504.
Miller, P.C.H., Butler Ellis, M.C., Bateman, R., Lane, A.G., O'Sullivan, C.M.O., Tuck, C.R., Robinson, T.H., 2010. Deposit distributions on targets with different geometries and treated with a range of spray characteristics. Aspect Appl. Biol. 99, 241-248.
Möller, T., Trumbore, B., 1997. Fast, minimum storage ray-triangle intersection. J. Graph. Tools 2, 21-28. Nairn, J.J., Forster, W.A., van Leeuwen, R.M., 2013. 'Universal' spray droplet adhesion model — accounting for hairy leaves. Weed Res. 53, 407—417.
Paulus, S., Behmann, J., Mahlein, A.-K, Plumer, L., Kuhlmann, H., 2014. Low-cost 3D systems: suitable tools for plant phenotyping. Sensors 14, 3001—3018.
Prusinkiewicz, P., Lindenmayer, A., 1990. The Algorithmic Beauty of Plants. Springer-Verlag, New York. Reichard, D.L, Zhu, H., Fox, R.D., Brazee, R.D., 1992. Computer simulation of variables that influence spray drift. Trans. ASABE 35,1401-1407.
Richard, D., Clanet, C, Quere, D., 2002. Surface phenomena: contact time of a bouncing drop. Nature 417, 811-811.
Taylor, P., 2011. The wetting of leaf surfaces. Curr. Opin. Colloid Interface Sci. 16, 326-334.
Vander Wal, R.L., Berger, G.M., Mozes, S.D., 2006. The splash/non-splash boundary upon a dry surface and thin fluid film. Exp. Fluids 40, 53—59.
Walklate, P.J., 1987. A random-walk model for dispersion of heavy particles in turbulent air flow. Bound. Layer Meteorol. 39,175-190.
Wenzel, R., 1936. Resistance of solid surface to wetting by water. Ind. Eng. Chem. 28, 988-994.
Winkelbach, S., Molkenstruck, S., Wahl, E, 2006. Low-cost laser range scanner and fast surface registration approach. In: Franke, K., Millier, K.-R., Nickolay, B., Schàfer, R. (Eds.), Pattern Recognition. Springer, Berlin Heidelberg, pp. 718—728.


![Table 5: Median retentions [µL/cm 2 ] for different formulation scenarios and spray quality boundaries at 100 L/ha application and ratios [—] with respect to full and low adhesion scenarios.](https://thumb-eu.123doks.com/thumbv2/123doknet/6031921.150961/11.892.109.690.699.872/retentions-different-formulation-scenarios-boundaries-application-adhesion-scenarios.webp)
![Table 7 : Minimal retentions [µL/cm 2 ] for 100 L/ha application with the different spray quality boundaries and high to low adhesion scenario ratio.](https://thumb-eu.123doks.com/thumbv2/123doknet/6031921.150961/12.892.108.686.165.279/minimal-retentions-application-different-quality-boundaries-adhesion-scenario.webp)