Auditory evoked potential audiograms in post-settlement stage
individuals of coral reef
fishes
Orphal Colleye
a,⁎
, Loïc Kéver
a, David Lecchini
b,c, Laetitia Berten
a,b, Eric Parmentier
aa
Laboratoire de Morphologie Fonctionnelle et Evolutive, Université de Liège, Institut de chimie, Bât. B6C, Quartier Agora, Allée du six Août 15, B-4000 Liège, Belgium
bUSR 3278 CNRS-EPHE-UPVD, Paris Sciences Lettres, CRIOBE, Moorea, French Polynesia c
Laboratoire d'Excellence“CORAIL”, Avenue Paul Alduy 58, 66860 Perpignan, France
a b s t r a c t
a r t i c l e i n f o
Article history: Received 8 October 2015
Received in revised form 11 April 2016 Accepted 19 May 2016
Available online 6 June 2016
Just after the reef colonization,fish species could use the acoustic cue to settle on different suitable habitats. In the present study, we used the auditory evoked potential (AEP) technique to measure and compare the detection abilities infive coral reef fish species, with some of these species that are found in the same habitat. We also ex-amined the effect offish size on sensitivity at the species level. All studied species except one showed size-related changes in sensitivity characterized by either a decrease (i.e. higher AEP thresholds) or an increase (i.e. lower AEP thresholds) in detection abilities with increasing size. The interspecific comparison of audiograms revealed that some species are more sensitive than others in terms of sound pressure level and frequency detection. Overall, this study indicates that the AEP threshold and the frequency bandwidth at early life stages may vary be-tween and withinfish species. The detection abilities are different in fish species that are not phylogenetically re-lated, which might suggest that the establishment of their capabilities is not necessarily related to the reef conquest.
© 2016 Elsevier B.V. All rights reserved.
Keywords: Coral reeffishes Auditory evoked potentials Audiograms
Early life stages Size groups
1. Introduction
The majority of coral reeffishes have a bipartite life cycle including a dispersive pelagic larval phase followed by sedentary demersal juvenile and adult phases associated with the coral reef environment (Leis, 1991; Leis and McCormick, 2002). The reef colonization usually occurs at night (Dufour and Galzin, 1993), and is quickly followed by the settle-ment on a suitable habitat (Lecchini, 2005). The recognition of the set-tlement sites would be based on different types of cues since sensory organs infishes are known to be functional early in their development (Leis et al., 2002; Myrberg and Fuiman, 2002; Barth et al., 2015). Several studies have highlighted that settlingfishes can detect and respond to reef sound (e.g.Leis et al., 2002, 2003; Simpson et al., 2004; Tolimieri et al., 2000, 2004; Leis and Lockett, 2005; Mann et al., 2007). However, understanding this process is more complicated than it appears. For ex-ample, the different settlingfish species did not show the same attrac-tion to sounds from different reef habitats (Parmentier et al., 2015). In addition, hearing research has shown that auditory abilities may change withfish growth. Audiograms of pre-settlement larvae and post-settle-ment juveniles have been measured in several pomacentrid species such as Stegastes partitus, Stegastes variabilis, Pomacentrus nagasakiensis and Abudefduf saxatilis (Kenyon, 1996; Wright et al., 2005; Egner and
Mann, 2005). Differences in hearing abilities among different size clas-ses have also been observed for other coral reef-dwelling species such as the carangid Caranx ignobilis, the serranid Epinephelus coioides, the polynemid Eleutheronema tetradactulum and the percichthyid Macquaria novemaculeata (Wright et al., 2011). In all these studies, an improvement in auditory abilities withfish size was observed (Wright et al., 2005, 2011). Such improvements mainly occurred at low frequen-cies (b1000 Hz), which resulted in a downward progression (i.e. more sensitive) of auditory thresholds with increasing size (seeEgner and Mann, 2005; Wright et al., 2011). Furthermore, changes in hearing abil-ities may be related to the development of morphological adaptations. Some of the best-known examples were found in holocentrids and chaetodontids, in which rostral extensions of the swim bladder towards the otic capsule resulted in enhanced hearing (Coombs and Popper, 1979; Tricas and Boyle, 2015).
Generally speaking,fish audiograms are measured using the audito-ry evoked potential (AEP) technique (Kenyon et al., 1998). This electro-physiological technique is classically used to determine the auditory thresholds across a range of different frequencies. It is now clear that di-rect comparison of AEP audiograms from different laboratories is prob-lematic because important variation in thresholds may result from different experimental conditions (Ladich and Fay, 2013). Here, AEP re-cordings were performed under the same experimental conditions. The present study aimed to compare AEP thresholds infive coral reef fish species from different families. Moreover, we examined any effect of
⁎ Corresponding author.
E-mail address:[email protected](O. Colleye).
http://dx.doi.org/10.1016/j.jembe.2016.05.007
0022-0981/© 2016 Elsevier B.V. All rights reserved.
Contents lists available atScienceDirect
Journal of Experimental Marine Biology and Ecology
fish size on the detection abilities at the species level by using different size groups. Ultimately, this study helped to determine which are the most sensitive species in terms of sound pressure level and frequency detection and how their sensitivity can be affected byfish size. 2. Material and methods
2.1. Acquisition and maintenance offishes
A total of 84 individuals was purchased from a commercial supplier (De Jong Marinelife, Spijk, The Netherlands). These individuals belonged to different species: the Indo-Pacific sergeant damselfish Abudefduf vaigiensis Quoy & Gaimard, 1825 (Pomacentridae), the con-vict surgeonfish Acanthurus triostegus Linnaeus, 1758 (Acanthuridae),
the speckled butterflyfish Chaetodon citrinellus Cuvier, 1831
(Chaetodontidae), the white-banded triggerfish Rhinecanthus aculeatus Linnaeus, 1758 (Balistidae), and the shoulderbar soldierfish Myripristis kuntee Valenciennes, 1831 (Holocentridae). Each species was main-tained in separate tanks (1.2 × 0.4 × 0.6 m)filled with saltwater main-tained at 26 °C. These tanks were equipped with a sand bottom and externalfilters. No internal filters or air stones were used in order to cre-ate a quiet acoustic environment. Fishes were kept under a 12:12 h L:D photoperiod and were fed with red blood worms twice a day. Allfishes were held for 1 to 3 days before being tested. For experimental reasons, individuals of thefive different species were divided into three size groups (i.e. small, medium and large; seeTable 1).
2.2. AEP thresholds measurement: experimental setup
The AEP technique directly measures nerve impulses created in the eighth nerve and activity of the brainstem evoked by acoustic stimuli (Corwin et al., 1982). Presence or absence of response to sounds of different intensities and frequencies allows the measure-ment of AEP thresholds. The experimeasure-mental setup was similar to that used for previous studies (Parmentier et al., 2009; Colleye et al., 2013). No anesthetics or neuromuscular-blocking drug were used during the AEP recordings. However, eachfish was restrained in a custom-made harness in order to prevent electrode dislodging as well as body and tail movements while allowing normal ventilation. This mesh harness was closed dorsally and caudally with small pliers suspended from a steel frame. Three subdermal stainless steel needle electrodes (Rochester Electro-Medical, Lutz, FL, USA) were used for recording the AEP signal. These electrodes were coated with nail pol-ish so that only ~ 1 mm of metal was exposed at the tip. The recording electrode was inserted about 1–2 mm deep into the head over the otic region, the reference electrode was inserted into the epaxial musculature, and the ground electrode was placed in the tank water near thefish. All AEP recordings were carried out in a steel tube (1.2 m high, 22 cm diameter, 0.7 cm thickness) closed at the bottom with a square steel plate (40 × 40 cm) and oriented vertical-ly. The tube wasfilled with saltwater (T = 26 °C) up to a height of
1.12 m, and the testfish was suspended 10 cm below the water sur-face and centered so that it was about 1 m above the loudspeaker (UW-30, Lubell Labs, Colombus, OH, USA) placed at the bottom of the experimental tank. The entire setup was enclosed in a walk-in soundproof booth (interior dimensions: 1.8 × 1.8 × 2.1 m). 2.3. Stimulus generation and AEP recordings
The presentation of sound stimuli and the determination of thresh-olds followed the detailed description given by Parmentier et al. (2009). Stimuli were tone bursts of 50 ms in total duration gated with a Hanning window. The phase of the tone was alternated between pre-sentations to minimize electrical artifacts from the recordings. During each trial, 14 different frequencies were presented: 150, 300, 600, 900, 1200, 1500, 1800, 2100, 2400, 2700, 3000, 3300, 3600 and 3900 Hz; these frequencies covered the expected range of hearing of the studied species (e.g.Coombs and Popper, 1979; Egner and Mann, 2005; Tricas and Boyle, 2015). Sound levels at each frequency were presented at up to 162 dBrmsre 1μPa and were attenuated in 6 dB steps until a
threshold level was determined. Evoked potentials recorded by the electrode were fed through a TDT HS4-DB4 amplifier (10,000 gain) con-nected to an RP2.1, routed into the computer and averaged by BioSig software. To measure the evoked response at each level of each frequen-cy, the signal was presented up to a total of 500 times. Sound levels pro-duced by the loudspeaker were calibrated with a Brüel and Kjær
(Nærum, Denmark) hydrophone (model #8101; sensitivity−184 dB
re 1 V/1μPa; frequency response 0.1 Hz to 200 kHz) placed in the exper-imental tank at the position normally occupied by thefish head. The hy-drophone was connected to a calibrated Brüel and Kjær 2610 amplifier that gave the absolute sound pressure level at all frequencies and inten-sity levels tested.
A 4096-point Fast Fourier Transform (FFT) was used to analyze the averaged AEP waveforms in the frequency domain. An auditory re-sponse was determined to be positive when the signal showed the pres-ence of a peak at twice the stimulus frequency (e.g., 300 Hz peak when the signal played was 150 Hz). The background level was estimated from the AEP power spectrum with a window of 100 Hz around the doubling frequency (Capser and Mann, 2006). Thresholds were deter-mined by both the averaged AEP trace and power spectrum and were defined as the lowest sound level to show a repeatable AEP trace above the background noise, with an FFT peak at twice the stimulus fre-quency being at least 3 dB above the background level (Egner and Mann, 2005). Thresholds were expressed in terms of Sound Pressure Level (SPL).
In order to make sure that the recorded AEP traces were not artifacts, controls were run by testing deadfishes in the experimental setup. No responses were recorded with deadfishes (Fig. 1).
2.4. Statistical analyses
A Shapiro–Wilk test was used to test the normal distribution of acoustic data. Firstly, AEP thresholds were compared between the three size groups within each species. Two-way ANOVA with Tukey's multiple comparisons were performed to compare frequencies for which all size groups showed a positive response. In some cases, two-way ANOVA with Sidak's multiple comparisons were also performed because positive responses were observed at higher frequencies for only two size groups. Secondly, a two-way ANOVA was performed to compare AEP thresholds between thefive species considering all data, regardless of thefish size. Results are expressed as means ± standard error of the mean (S.E.M.).
Least-square linear regressions were used to examine changes in auditory abilities across standard length (SL) in thefive species at all frequencies tested. The data used in theses analyses corresponded to the AEP thresholds measured for all individuals of the different size groups. Note that these data were graphically represented only for
Table 1
Standard length (SL) of the different size groups infive coral reef fish species.
Species Group
Small size Middle size Large size SL (mm) n SL (mm) n SL (mm) n Abudefduf vaigiensis 28–37 9 54–59 5 60–70 5 Acanthurus triostegus 48–58 4 63–69 8 70–78 7 Chaetodon citrinellus 36–48 4 57–69 7 76–85 3 Rhinecanthus aculeatus 38–44 7 47–54 7 60–76 3 Myripristis kuntee 53–59 5 67–88 5 108–112 5 n, Number of individuals analyzed.
the butterflyfish C. citrinellus and the triggerfish R. aculeatus because they showed correlations betweenfish size and detection abilities for most of the frequencies tested.
All statistical analyses were performed with STATISTICA 9.1 (StatSoft, Tulsa, OK, USA) and GrafPad Prism 5 (GrafPad Software, Inc. USA). Significance level was determined at p b 0.05.
Fig. 1. Example of auditory evoked potentials (AEP) measured at 300 Hz from one individual of A. triostegus and one individual of C. citrinellus. The different traces show the averaged evoked response at six different stimulus intensities. The bottom trace shows the stimulus waveform recorded by the hydrophone at the position of thefish head (the stimulus duration was 50 ms). The AEP thresholds (i.e. the lowest sound pressure level to show a definitive response) for these individuals were 108 dBrmsre 1μPa in A. triostegus and 96 dBrms
3. Results
Evoked potentials were obtained from all species tested. Whatever the species, representative AEP traces were similar in shape within a given test frequency across all individuals (Fig. 1). Waveforms produced in response to stimulus presentation decreased in magnitude as the SPL decreased, and were thus used to determine AEP thresholds (Fig. 1). 3.1. Size-related intraspecific variation in auditory capabilities
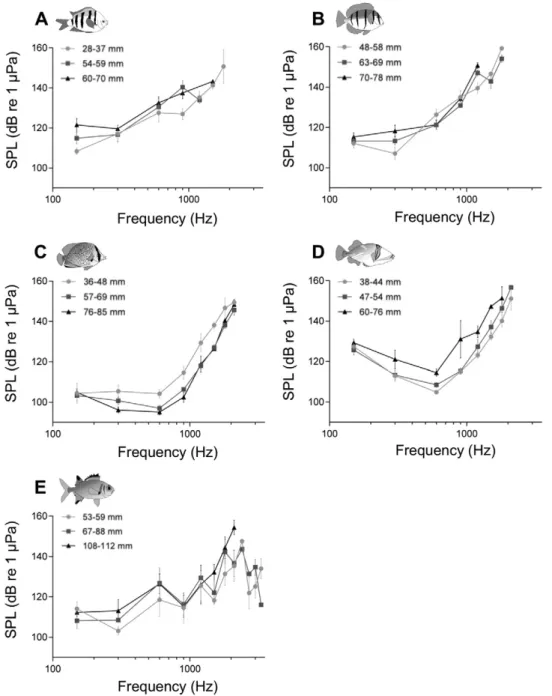
Audiograms of A. vaigiensis showed an increase in AEP thresholds with increasing frequencies. The lowest threshold was observed at
150 Hz for the small (28–37 mm, n = 9) and middle (54–59 mm,
n = 5) size groups, being respectively of 108 ± 4 dB re 1μPa and 115 ± 6 dB re 1μPa. In the large (60–70 mm, n = 5) size group, the low-est AEP threshold was at 300 Hz with 120 ± 4 dB re 1μPa (seeFig. 2A).
Threshold at 150 Hz was significantly lower for the small individuals than for the large ones (two-way ANOVA, d.f. = 71, pb 0.05;Fig. 2A). Likewise, auditory thresholds were significantly different at 900 Hz be-tween the small and middle size groups, with a lower threshold ob-served for the smallerfishes (Fig. 2A). No significant differences between size groups were observed at 300 and 600 Hz (Fig. 2A). Al-though positive responses were observed up to 1800 Hz for the small size group, comparison of auditory thresholds at frequencies above 900 Hz was not possible since only onefish from the medium size group was able to detect sounds at 1200 Hz, and only onefish from the large size group at 1500 Hz. Correlation analyses revealed a signi fi-cant increase in AEP thresholds with increasing size only at 150 Hz (y = 0.3474× + 97.16; r2= 0.46, pb 0.05).
The overall audiogram in A. triostegus showed the same tendency as the one observed for A. vaigiensis, with an increase in AEP thresholds with increasing frequencies. However, the small (48–58 mm, n = 4)
Fig. 2. Mean (±SEM) AEP thresholds offive coral reef fish species. Sound pressure level (SPL) audiograms for (A) three size groups of Abudefduf vaigiensis (28–37, 54–59 and 60–70 mm), (B) three size groups of A. triostegus (48–58, 63–69 and 70–78 mm), (C) three size groups of Chaetodon citrinellus (36–48, 57–69 and 76–85 mm), (D) three size groups of Rhinecanthus aculeatus (38–44, 47–54 and 60–76 mm), and (E) three size groups of Myripristis kuntee (53–59, 67–88 and 108–112 mm). At higher frequencies, no symbol represented for a size group means no responses were obtained.
size group showed a slight decrease in thresholds from 150 to 300 Hz, with the lowest AEP threshold observed at 300 Hz (seeFig. 2B). Thus, the evoked response of the small size group at 300 Hz was significantly better than the one of the large (70–78 mm, n = 7) size group (two-way ANOVA, d.f. = 94, pb 0.05). No significant difference was found at 150, 600 and 900 Hz among the three size groups. At 1200 Hz, the small size group showed an auditory threshold significantly lower than the one of both the middle (63–69 mm, n = 8) and large size groups (two-way ANOVA, d.f. = 94, pb 0.05). The large size group was unable to detect frequencies above 1200 Hz, whereas positive responses at 1500 and 1800 Hz were recorded for the small (n = 2) and the middle (n = 4) size groups (Fig. 2B). In addition, a positive correlation between AEP
thresholds and fish size was observed at 300 Hz (y =
0.4457 × + 84.46; r2 = 0.25, p b 0.05) and 1200 Hz (y =
0.5557× + 110.2; r2= 0.64, pb 0.05).
Generally speaking, audiograms in C. citrinellus were similarly shaped, whatever the size group (Fig. 2C). They showed a slight de-crease in AEP thresholds from 150 Hz to 600 Hz for the two larger size groups (middle size: 57–69 mm, n = 7; large size: 76–85 mm, n = 3), whereas the small size group (36–48 mm, n = 4) had similar detection abilities from 150 to 600 Hz. The lowest AEP threshold was observed at 600 Hz for each size group, being around 105 dB re 1μPa for the small size group, at 97 ± 4 dB re 1μPa for the middle size group, and at 95 ± 3 dB re 1μPa for the large size class (Fig. 2C). Then, audiograms showed a high increase in auditory thresholds from 600 to 2100 Hz for all size groups (Fig. 2C). No significant differences between the three size groups were observed for frequencies below 900 Hz. On the other hand, specimens from the small size group had a significantly higher auditory threshold than the middle and large size groups at 900, 1200, 1500 and 1800 Hz (seeTable 2). Comparison of auditory thresholds at 2100 Hz between the three size groups was not possible because only one individual from the small size group showed a positive response. Thereby, a Sidak's multiple comparison between the two larg-er size groups was plarg-erformed but it showed no significant difference at this frequency. Linear regressions showed that auditory thresholds were negatively correlated withfish size at all tested frequencies except at 150 and 2100 Hz, which highlighted an increase in detection abilities with increasing size (Fig. 3).
AEP thresholds were also compared between three size groups (small size: 38–44 mm, n = 7; middle size: 47–54 mm, n = 7; large size: 60–76 mm, n = 3) in R. aculeatus. Whatever the size group, audio-grams were similarly shaped with decreasing AEP thresholds from 150 to 600 Hz, which corresponds to the lowest auditory threshold for all size groups, and then followed by an increase in auditory thresholds until 1800 Hz for the large size group, and until 2100 Hz for the two smaller size groups (seeFig. 2D). No significant difference was observed at 150, 300, 600, 1200 and 1800 Hz. On the other hand, the largest size group was significantly different from the two others at 900 Hz, show-ing a higher auditory threshold (two-way ANOVA, d.f. = 107, pb 0.05; seeFig. 2D). Likewise, the small size group was significantly different from the large one at 1500 Hz, showing better detection abili-ties (two-way ANOVA, d.f. = 107, pb 0.05; seeFig. 2D). No comparison
of auditory thresholds was performed at 2100 Hz because positive re-sponses were obtained only for two individuals from the smallest size group and one specimen from the middle one. Linear regressions showed that auditory thresholds were positively correlated withfish size at all tested frequencies except at 150 Hz, which highlighted a de-crease in detection abilities with increasing size (Fig. 4).
Comparison of AEP thresholds between the three size groups (small size: 53–59 mm, n = 5; middle size: 67–88 mm, n = 5; large size: 108– 112 mm, n = 5) of M. kuntee showed no significant differences for
fre-quencies between 150 and 2100 Hz (two-way ANOVA, pN 0.05; see
Fig. 2E). No response was observed for the largest size group at frequen-cies above 2100 Hz. The small and middle size groups showed positive responses to frequencies up to 3300 Hz, with no significant differences (two-way ANOVA, Sidak's multiple comparisons, pN 0.05; seeFig. 2E). Overall, the lowest AEP threshold was observed at 150 Hz, except for the small size group (300 Hz), and audiograms were punctuated by sev-eral ups and downs of auditory thresholds (Fig. 2E).
3.2. Interspecific variation in hearing abilities
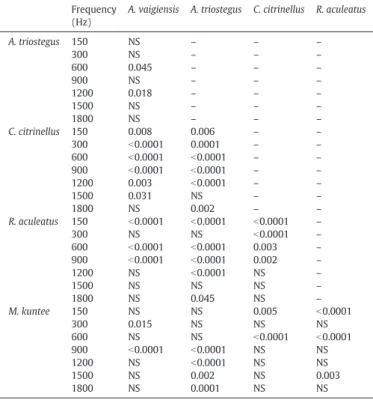
Comparison of auditory abilities among all species revealed signi fi-cant differences at different frequencies (Table 3). For example, A. vaigiensis and A. triostegus showed similar auditory thresholds at all fre-quencies except at 600 Hz (131 ± 5 dB re 1μPa vs 121 ± 3 dB re 1 μPa, pb 0.05; seeTable 3) and 1200 Hz (134 ± 6 dB re 1μPa vs 148 ± 3 dB re 1μPa, p b 0.05; seeTable 3), whereas A. vaigiensis and C. citrinellus exhib-ited significantly different auditory thresholds at all frequencies except 1800 Hz (151 ± 13 dB re 1μPa vs 140 ± 8 dB re 1 μPa, p N 0.05; seeTable 3). The lowest AEP threshold was observed at 600 Hz for both C. citrinellus (99 ± 5 dB re 1μPa;Fig. 5) and R. aculeatus (109 ± 6 dB re 1μPa;Fig. 5), at 300 Hz for M. kuntee (109 ± 8 dB re 1μPa;Fig. 5), and at 150 Hz for A. vaigiensis (113 ± 8 dB re 1μPa;Fig. 5) and A. triostegus (114 ± 5 dB re 1μPa;Fig. 5). Moreover, C. citrinellus exhibited the lowest auditory threshold for frequencies below 1200 Hz (Fig. 5). Al-though M. kuntee showed the lowest auditory threshold for frequencies above 1200 Hz (Fig. 5), it was not significantly different from A. vaigiensis, C. citrinellus and R. aculeatus (Table 3). In addition, M. kuntee was the only one species able to detect acoustic stimuli at frequencies above 2100 Hz (Fig. 5).
4. Discussion
Electrophysiological techniques such as the AEP recordings measure the neural activity of the whole auditory pathway (from the inner ear up to the midbrain or forebrain) in response to acoustic stimuli (Corwin et al., 1982; Kenyon et al., 1998). The majority of AEP record-ings being typically conducted in small tanks, the particle motion com-ponent is important close to the sound source (the nearfield), which may also include lateral line inputs at lower frequencies (Higgs and Radford, 2013). Audiograms at lower frequencies should thus be interpreted as multimodal responses since both the inner ear and the canal neuromast hair cells can be stimulated during the AEP recordings
Table 2
Comparison of AEP thresholds at different frequencies (Hz) between the smallest size group (36–48 mm) and two larger size groups (medium: 57–69 mm, large: 76–85 mm) in Chaetodon citrinellus.*, **
Middle size (n = 7) Large size (n = 3)
150 (Hz) 300 (Hz) 600 (Hz) 900 (Hz) 1200 (Hz) 1500 (Hz) 1800 (Hz) 150 (Hz) 300 (Hz) 600 (Hz) 900 (Hz) 1200 (Hz) 1500 (Hz) 1800 (Hz) Small size (n = 4) NS NS NS ⁎ ⁎⁎ ⁎⁎ ⁎ NS NS NS ⁎⁎ ⁎ ⁎ NS
n, Number of individuals analyzed; NS, Non-Significant differences. Results refer to two-way ANOVA with Tukey's multiple comparisons. ⁎ p b 0.05.
(Higgs and Radford, 2013). Given that no experimental manipulation was performed in the present study to test the contribution of the lateral line system, our audiograms cannot be interpreted solely as the result of an evoked response from the auditory hair cells, especially at lower fre-quencies (≤200 Hz). For this reason, a lower AEP threshold at these lower frequencies reflects a higher sensitivity to the near field compo-nent of the acoustic environment but not necessarily a better hearing sensitivity.
Overall, our results showed size-related changes in sensitivity at the species level that are characterized by a decrease in detection abilities with increasing size, except in the butterflyfish C. citrinellus. The
interspecific comparison of audiograms revealed that C. citrinellus and M. kuntee have the best detection abilities in terms of AEP thresholds and frequency range, respectively (Fig. 5).
4.1. Size-related variation in hearing abilities at the species level
Changes in hearing abilities in relation tofish size have already been observed in different species, but results were somewhat conflicting. In-deed, AEP audiograms showed an improvement in hearing abilities with increasing size in the carangid Caranx ignobilis, the serranid Epinephelus coioides, the polynemid Eleutheronema tetradactylum and the
Fig. 3. Linear regressions of AEP thresholds expressed in sound pressure level (SPL) against standard length (SL) in Chaetodon citrinellus at all frequencies tested. Fish ranged from 36 to 85 mm in SL (n = 14). Light greyfilled circles represent the small size group (36–48 mm), dark grey filled circles represent the middle size group (57–69 mm) and black filled circles correspond to the large size group (76–85 mm). The curves were fitted by: y = −0.3125× + 120.1 (300 Hz), y = −0.2508× + 113.9 (600 Hz), y = −0.3360× + 128.3 (900 Hz), y =−0.3096× + 140.2 (1200 Hz), y = −0.3476× + 151.1 (1500 Hz), y = −0.2400× + 155.6 (1800 Hz).
percichthyid Macquaria novemaculeata (Wright et al., 2011). However, the opposite result was also observed since AEP audiograms showed a decrease in hearing sensitivity with increasing size in the pomacentrid Abudefduf saxatilis (Egner and Mann, 2005).
Generally speaking, the present study includingfive coral reef fish species belonging to different families has led to similar conflicting re-sults since all species did not show the same size-related variation in de-tection abilities. For example, an increase in dede-tection abilities (i.e. lower detection thresholds) with increasing size was observed in C. citrinellus (Fig. 3), whereas a decrease in detection abilities (i.e. higher detection thresholds) with increasing size was observed in R. aculeatus at all frequencies tested (Fig. 4). The same tendency was also observed in A. triostegus and in A. vaigiensis but only at some frequencies tested.
Interestingly, the results about A. vaigiensis were roughly similar to the overall audiogram of A. saxatilis (Egner and Mann, 2005). However,
Egner and Mann (2005)observed size-related differences in the range of detected frequencies: individualsb30 mm were able to detect fre-quencies up to 1200 Hz, while it went up to 1400 Hz for individuals be-tween 30 and 50 mm, and up to 1600 Hz for individualsN50 mm. This was not the case in our study since the small size group (28–37 mm) was able to detect frequencies up to 1800 Hz, whereas the large and me-dium size groups could not detect frequencies above 1500 Hz and 1200 Hz, respectively (Fig. 2A). Finally, no significant difference in AEP thresholds withfish size was observed in M. kuntee.
It is quite difficult to give clear morphological reasons to these size-related changes in detection abilities since examination of the
Fig. 4. Linear regressions of AEP thresholds expressed in sound pressure level (SPL) against standard length (SL) in Rhinecanthus aculeatus at all frequencies tested, except 2100 Hz at which only fewfish showed a positive response. Fish ranged from 38 to 76 mm in SL (n = 17). Light grey filled circles represent the small size group (38–44 mm), dark grey filled circles represent the middle size group (47–54 mm) and black filled circles correspond to the large size group (60–76 mm). The curves were fitted by: y = 0.2552× + 101.9 (300 Hz), y = 0.3255× + 91.9 (600 Hz), y = 0.5726× + 89.47 (900 Hz), y = 0.4274× + 105.9 (1200 Hz), y = 0.4937× + 112.7 (1500 Hz), y = 0.3664× + 126.6 (1800 Hz).
morphology of the hearing system was not conducted in the present study. One possible explanation for the improvement in detection abil-ities with increasing size observed in C. citrinellus could be due to a mor-phological change of the laterophysic connection (LC) duringfish growth. All butterflyfishes of the genus Chaetodon are known to possess a LC, which connects (partially or totally) bilateral anterior extensions of the swim bladder (commonly named“swim bladder horns”) to a medi-al opening in the supracleithrmedi-al latermedi-al line canmedi-al, forming a pseudo-otophysic connection (Webb, 1998; Webb and Smith, 2000; Smith et al., 2003; Webb et al., 2006). This LC was thought to enhance the sound detection by transmitting the sound pressure stimuli to the later-al line via the swim bladder horns, and converting the sound pressure to fluid flow through a laterophysic tympanum (Webb, 1998; Webb and Smith, 2000; Smith et al., 2003; Webb et al., 2006). Surprisingly,Webb et al. (2012)did not observe a relationship betweenfish size and
hearing abilities in Chaetodon ocellatus but they measured AEP audio-grams with individuals ranged in size from 21 to 31 mm (vs 36– 85 mm in the present study). The medial opening in the supracleithral lateral line canal in C. ocellatus is present in 14–17 mm individuals. However, the swim bladder horns are formed when specimens reach the size of 25 to 29 mm, which roughly corresponded to their sample size (Webb et al., 2012). Although the distance between the swim blad-der horns and both the medial opening in the supracleithral lateral line canal and the inner ear did not change appreciably during growth in C. ocellatus (Webb et al., 2012), it might be different in the case of C. citrinellus due to a different development of the LC system.Webb et al. (2006)found an interspecific variation in LC morphology with two LC types (direct and indirect) that differ depending on whether or not the swim bladder horns are in direct contact with the medial opening in the supracleithral lateral line canal. There also exist two variants of a direct LC and four variants of an indirect LC. These variants are defined by a combination of features (i.e. soft tissue anatomy, horn length [long/ short], horn diameter [wide/narrow], number of swim bladder cham-bers [one/two], and presence/absence of mucoid connective tissue in the medial opening in the supracleithrum), which is supposed to have consequences for the bioacoustics of the system (Webb et al., 2006). Taking all this into consideration, it is likely that the enhanced acoustic sensitivity with increasing size in C. citrinellus may be related to the spa-tial relationships between the supracleithral lateral line canal, the swim bladder and the development of the horns, and the inner ear. The swim bladder horns might be brought closer to the otic capsule with increas-ing size. For example, displacement of gas from the swim bladder horns in two Chaetodon species is known to decrease hearing sensitivity (Tricas and Boyle, 2015).
On another note, the decrease in detection abilities with increasing size observed in R. aculeatus could be due to the closer proximity of the swim bladder to the inner ear in the smallest individuals. This mor-phological configuration might allow the bladder to act as a more pro-nounced amplifier at certain frequencies (seeEgner and Mann, 2005). In both cases, further investigations are needed tofind out the true mor-phological mechanisms behind these changes in AEP thresholds. In ad-dition, the lower thresholds exhibited by the smallest size group of A. vaigiensis and A. triostegus at some frequencies could be explained by variation in electrode placement during AEP recordings. It is likely that the electrode was closer to the brain in smaller individuals, which may result in a larger AEP response in some of the smaller individuals compared to larger ones (seeEgner and Mann, 2005).
4.2. Interspecific differences in auditory capabilities
Comparison of AEP audiograms showed differences in mean thresh-olds among all studied species at several frequencies tested (Table 3,Fig. 5). Previous studies have already measured behavioral audiograms in
holocentrids (Tavolga and Wodinsky, 1963; Coombs and Popper,
1979), as well as AEP audiograms in a few pomacentrids (Egner and Mann, 2005; Wright et al., 2005; Wysocki et al., 2009) and chaetodontids (Webb et al., 2012; Tricas and Boyle, 2015). However, di-rect comparison of these studies with our AEP traces can be irrelevant because audiograms produce very different results depending on the methodology used (i.e. behavioral vs electrophysiological measures;
Sisneros et al., 2016) and the acoustic environment under which they are measured (Ladich and Fay, 2013). C. citrinellus showed the lowest AEP threshold for frequencies below 1200 Hz while M. kuntee exhibited the widest range of detected frequencies (Fig. 5). Morphological adapta-tions (i.e. hearing specializaadapta-tions) could explain why these two species exhibited the best detection abilities. All members the genus Chaetodon have the laterophysic connection (Webb, 1998; Webb and Smith, 2000; Smith et al., 2003; Webb et al., 2006). Recently,Tricas and Boyle (2015)
clearly demonstrated the action of the LC system on auditory abilities by comparing butterflyfish species with or without swim bladder horns and LC. This system enables a better hearing sensitivity characterized
Table 3
Comparison of mean AEP thresholds at different frequencies amongfive coral reef fish species.
Frequency (Hz)
A. vaigiensis A. triostegus C. citrinellus R. aculeatus
A. triostegus 150 NS – – – 300 NS – – – 600 0.045 – – – 900 NS – – – 1200 0.018 – – – 1500 NS – – – 1800 NS – – – C. citrinellus 150 0.008 0.006 – – 300 b0.0001 0.0001 – – 600 b0.0001 b0.0001 – – 900 b0.0001 b0.0001 – – 1200 0.003 b0.0001 – – 1500 0.031 NS – – 1800 NS 0.002 – – R. aculeatus 150 b0.0001 b0.0001 b0.0001 – 300 NS NS b0.0001 – 600 b0.0001 b0.0001 0.003 – 900 b0.0001 b0.0001 0.002 – 1200 NS b0.0001 NS – 1500 NS NS NS – 1800 NS 0.045 NS – M. kuntee 150 NS NS 0.005 b0.0001 300 0.015 NS NS NS 600 NS NS b0.0001 b0.0001 900 b0.0001 b0.0001 NS NS 1200 NS b0.0001 NS NS 1500 NS 0.002 NS 0.003 1800 NS 0.0001 NS NS
NS, Non-Significant differences. Results refer to two-way ANOVA with Tukey's multiple comparisons.
Fig. 5. Mean (±SEM) AEP thresholds offive coral reef fish species. Sound pressure level (SPL) audiograms for (A) Abudefduf vaigiensis (n = 19; SL = 28–70 mm), (B) Acanthurus triostegus (n = 19; SL = 48–78 mm), (C) Chaetodon citrinellus (n = 14; SL = 36–85 mm), (D) Rhinecanthus aculeatus (n = 17; SL = 38–76 mm) and (E) Myripristis kuntee (n = 15; SL = 53–112 mm). At frequencies above 1800 Hz, no symbol represented for some species means no responses were obtained.
by a lower detection thresholds and an extended frequency range (Tricas and Boyle, 2015). Furthermore, all species from the Holocentridae subfamily Myripristinae (e.g. the soldierfish M. kuntee) possess an otophysic connection; another hearing specialization connecting anterior swim bladder horns with the otic capsule of the inner ear (Coombs and Popper, 1979; Braun and Grande, 2008). The otophysic connection enhances the hearing sensitivity, hence a broad frequency range of hearing and a low auditory threshold.
Our data on the detection abilities infive coral reef fish species might offer new perspectives about the use of the acoustic cue to detect a suit-able settlement site. Thesefive species showed significant differences in their AEP threshold and frequency bandwidth, but they are all able to settle on patch reefs located in Moorea Island (Dufour and Galzin, 1993; Lecchini et al., 2006). Recently,Bertucci et al. (2015)measured underwater sound signatures of different reef habitats in this area and they observed that the inner reef crest, the fringing reef and the barrier reef had similar spectral patterns with a maximum peak of sound inten-sities around 200 Hz. This peak intensity occurred at a frequency near the lowest AEP threshold of the studied species (Fig. 5). However, recent playback experiments indicated that larvae of R. aculeatus and M. kuntee are preferentially attracted by barrier reef and fringing reef sound, re-spectively. Moreover, larvae of C. citrinellus are repelled by barrier reef sound, whereas larvae of A. triostegus are neither attracted nor repulsed by both types of sounds (Parmentier et al., 2015). Taken together, these observations seem to indicate that describing the acoustic properties of the different coral reef habitats as average power spectra might not be appropriate to predict whether or not coral reeffish species could use the acoustic cue tofind their way home.
5. Conclusion
As a whole, this study contributes to expand the knowledge about the hearing abilities of coral reeffishes at early life stages. Our results showed significant differences in detection abilities among fish species that are not phylogenetically related, suggesting that the establishment of their capabilities is not necessarily related to the reef conquest. The examination of detection abilities within species revealed that some of them exhibit size-related variations. Our audiograms also indicated that detection abilities can vary amongfish families in terms of AEP thresholds and frequency range.
Acknowledgements
The authors are greatly indebted to the anonymous reviewers for their insightful comments and interesting criticism of the original ver-sion of the manuscript. This research was supported by the Belgian Na-tional Fund for Scientific Research (F.R.S.-FNRS) granted to L. Berten (no. FRIA 1.E096.10). [SW]
References
Barth, P., Berenshtein, I., Besson, M., Roux, N., Parmentier, E., Banaigs, B., Lecchini, D., 2015.
From the ocean to a reef habitat: How do the larvae of coral reeffishes find their way home? A state of art on the lastest advances. Life Environ. 65, 91–100.
Bertucci, F., Parmentier, E., Berten, L., Brooker, R.M., Lecchini, D., 2015.Temporal and spa-tial comparisons of underwater sound signatures of different reef habitats in Moorea Island, French Polynesia. PLoS One 10, 9.
Braun, C.B., Grande, T., 2008.Evolution of peripheral mechanisms for the enhancement of sound reception. In: Webb, J.F., Fay, R.R., Popper, A.N. (Eds.), Fish Bioacoustics vol. 32. Springer, New York, pp. 99–144.
Capser, B.M., Mann, D.A., 2006.Evoked potential audiograms of the nurse shark (Ginglymostoma cirratum) and the yellow stingray (Urobatis jamaicensis). Environ. Biol. Fishes 76, 101–108.
Colleye, O., Ovidio, M., Salmon, A., Parmentier, E., 2013.Contribution to the study of acoustic communication in two Belgian river bullheads (Cottus rhenanus and C. perifretum) with further insight into the sound-producing mechanism. Front. Zool. 10, 71.
Coombs, S., Popper, A.N., 1979.Hearing differences among Hawaiian squirrelfish (family Holocentridae) related to differences in the peripheral auditory system. J. Comp. Physiol. 132, 203–207.
Corwin, J.T., Bullock, T.H., Schweitzer, J., 1982.The auditory brainstem response infive vertebrate classes. Electroencephalogr. Clin. Neurophysiol. 54, 629–641.
Dufour, V., Galzin, R., 1993.Colonization patterns of reeffish larvae to the lagoon at Moorea Island, French Polynesia. Mar. Ecol. Prog. Ser. 102, 143–152.
Egner, S.A., Mann, D.A., 2005.Auditory sensitivity of sergeant major damselfish Abudefduf saxatilis from post-settlement juvenile to adult. Mar. Ecol. Prog. Ser. 285, 213–222.
Higgs, D.M., Radford, C.A., 2013.The contribution of the lateral line to‘hearing’ in fish. J. Exp. Biol. 216, 1484–1490.
Kenyon, T.N., 1996.Ontogenetic changes in the auditory sensitivity of damselfishes (pomacentridae). J. Comp. Physiol. A 179, 553–561.
Kenyon, T.N., Ladich, F., Yan, H.Y., 1998.A comparative study of hearing ability infishes: the auditory brainstem response approach. J. Comp. Physiol. A 182, 307–318.
Ladich, F., Fay, R.R., 2013.Auditory evoked potential audiometry infish. Rev. Fish Biol. Fish. 23, 317–364.
Lecchini, D., 2005.Spatial and behavioural patterns of reef habitat settlement byfish lar-vae. Mar. Ecol. Prog. Ser. 301, 247–252.
Lecchini, D., Polti, S., Nakamura, Y., Mosconi, P., Tsuchiya, M., Remoissenet, G., Planes, S., 2006.New perspectives to aquariumfish trade. Fish. Sci. 72, 40–47.
Leis, J.M., 1991.The pelagic phase of coral reeffishes: Larval biology of coral reef fishes. In: Sale, P.F. (Ed.), The Ecology of Fishes of Coral Reefs. Academic Press, San Diego, pp. 183–230.
Leis, J.M., Lockett, M.M., 2005.Localization of reef sounds by settlement-stage larvae of coral-reeffishes (Pomacentridae). Bull. Mar. Sci. 76, 715–724.
Leis, J.M., McCormick, M.I., 2002.The biology, behavior, and ecology of the pelagic, larval stage of coral reeffishes. In: Sale, P.F. (Ed.), Coral Reef Fishes: Dynamics and Diversity in a Complex Ecosystem. Academic Press, San Diego, pp. 171–200.
Leis, J.M., Carson-Ewart, B.M., Cato, D.H., 2002.Sound detection in situ by the larvae of a coral-reef damselfish (Pomacentridae). Mar. Ecol. Prog. Ser. 232, 259–268.
Leis, J.M., Carson-Ewart, B.M., Hay, A.C., Cato, D.H., 2003.Coral-reef sounds enable noctur-nal navigation by some reef-fish larvae in some places and at some times. J. Fish Biol. 63, 724–737.
Mann, D.A., Casper, B.M., Boyle, K.S., Tricas, T.C., 2007.On the attraction of larvalfishes to reef sounds. Mar. Ecol. Prog. Ser. 338, 307–310.
Myrberg Jr., A.A., Fuiman, L.A., 2002.The sensory world of coral reeffishes. In: Sale, P.F. (Ed.), Coral Reef Fishes: Dynamics and Diversity in a Complex Ecosystem. Academic Press, San Diego, pp. 123–148.
Parmentier, E., Colleye, O., Mann, D.A., 2009.Hearing ability in three clownfish species. J. Exp. Biol. 212, 2023–2026.
Parmentier, E., Berten, L., Rigo, P., Aubrun, F., Nedelec, S., Simpson, S.D., Lecchini, D., 2015.
The influence of various reef sounds on coral fish larvae behaviour. J. Fish Biol. 86, 1507–1518.
Simpson, S.D., Meekan, M.G., McCauley, R.D., Jeffs, A., 2004.Attraction of settlement-stage coral reeffishes to reef noise. Mar. Ecol. Prog. Ser. 276, 263–268.
Sisneros, J.A., Popper, A.N., Hawkins, A.D., Fay, R.R., 2016.Auditory evoked potential au-diograms compared with behavioral auau-diograms in aquatic animals. In: Popper, A.N., Hawkins, A.D. (Eds.), Effects of Noise on Aquatic Life IIAdvances in Experimental Medicine and Biology vol. 875. Springer Science + Business Media, New York, pp. 1049–1056.
Smith, W.L., Webb, J.F., Blum, S.D., 2003.The evolution of the laterophysic connection with a revised phylogeny and taxonomy of butterflyfishes (Teleostei: Chaetodontidae). Cladistics 19, 287–306.
Tavolga, W.N., Wodinsky, J., 1963.Auditory capacities infishes: pure tone thresholds in nine species of marine teleosts. Bull. Am. Mus. Nat. Hist. 126, 177–240.
Tolimieri, N., Jeffs, A., Montgomery, J., 2000.Ambient sound as a cue for navigation by the pelagic larvae of reeffishes. Mar. Ecol. Prog. Ser. 207, 219–224.
Tolimieri, N., Haine, O., Jeffs, A., McCauley, R., Montgomery, J., 2004.Directional orienta-tion of pomacentrid larvae to ambient reef sound. Coral Reefs 23, 184–191.
Tricas, T.C., Boyle, K.S., 2015.Sound pressure enhances the hearing sensitivity of Chaetodon butterflyfishes on noisy coral reefs. J. Exp. Biol. 218, 1585–1595.
Webb, J.F., 1998.Laterophysic connection: a unique link between the swim bladder and the lateral-line system in Chaetodon (Perciformes: Chaetodontidae). Copeia 4, 1032–1036.
Webb, J.F., Smith, W.L., 2000.The laterophysic connection in chaetodontid butterflyfish: morphological variation and speculations on sensory function. Philos. Trans. R. Soc. B 355, 1125–1129.
Webb, J.F., Smith, W.L., Ketten, D.R., 2006.The laterophysic connection and swim bladder of butterflyfishes in the genus Chaetodon (Perciformes: Chaetodontidae). J. Morphol. 267, 1338–1355.
Webb, J.F., Walsh, R.M., Casper, B.M., Mann, D.A., Kelly, N., Cicchino, N., 2012. Develop-ment of the ear, hearing capabilities and laterophysic connection in the spotfin butterflyfish (Chaetodon ocellatus). Environ. Biol. Fishes 95, 275–290.
Wright, K.J., Higgs, D.M., Belanger, A.J., Leis, J.M., 2005.Auditory and olfactory abilities of pre-settlement larvae and post-settlement juveniles of a coral reef damselfish (Pi-sces: Pomacentridae). Mar. Biol. 147, 1425–1434.
Wright, K.J., Higgs, D.M., Leis, J.M., 2011.Ontogenetic and interspecific variation in hearing ability in marinefish larvae. Mar. Ecol. Prog. Ser. 424, 1–13.
Wysocki, L.E., Codarin, A., Ladich, F., Picciulin, M., 2009.Sound pressure and particle accel-eration audiograms in three marinefish species from the Adriatic Sea. J. Acoust. Soc. Am. 126, 2100–2107.