O
pen
A
rchive
T
OULOUSE
A
rchive
O
uverte (
OATAO
)
OATAO is an open access repository that collects the work of Toulouse researchers and
makes it freely available over the web where possible.
This is an author-deposited version published in :
http://oatao.univ-toulouse.fr/
Eprints ID : 9904
To link to this article : doi:10.1016/j.scitotenv.2010.07.061
URL :
http://dx.doi.org/10.1016/j.scitotenv.2010.07.061
To cite this version :
Gandois, Laure and Nicolas, Manuel and
VanderHeijden, Gregory and Probst, Anne The importance of
biomass net uptake for a trace metal budget in a forest stand in
north-eastern France. (2010) Science of the Total Environment, 408
(23). pp. 5870-5877. ISSN 0048-9697
Any correspondance concerning this service should be sent to the repository
administrator:
[email protected]
The importance of biomass net uptake for a trace metal budget in a forest stand in
north-eastern France
L. Gandois
a,b, M. Nicolas
c, G. VanderHeijden
d, A. Probst
a,b,⁎
aUniversité de Toulouse; UPS, INP; EcoLab (Laboratoire d'écologie fonctionnelle); ENSAT, Avenue de l'Agrobiopôle, F-31326 Castanet-Tolosan, France bCNRS; EcoLab; F-31326 Castanet-Tolosan, France
c
ONF, Direction technique RENECOFOR, Bd de Constance 77300 Fontainebleau, France
d
INRA, centre de Nancy, Equipe BEF, 54280 Champenoux, France
a b s t r a c t
Keywords: Trace metal Forest ecosystem Stand budget Stocks Fluxes Vegetation uptakeThe trace metal (TM: Cd, Cu, Ni, Pb and Zn) budget (stocks and annualfluxes) was evaluated in a forest stand (silverfir, Abies alba Miller) in north-eastern France. Trace metal concentrations were measured in different tree compartments in order to assess TM partitioning and dynamics in the trees. Inputs included bulk deposition, estimated dry deposition and weathering. Outputs were leaching and biomass exportation. Atmospheric deposition was the main inputflux. The estimated dry deposition accounted for about 40% of the total trace metal deposition. The relative importance of leaching (estimated by a lumped parameter water balance model, BILJOU) and net biomass uptake (harvesting) for ecosystem exportation depended on the element. Trace metal distribution between tree compartments (stem wood and bark, branches and needles) indicated that Pb was mainly stored in the stem, whereas Zn and Ni, and to a lesser extent Cd and Cu, were translocated to aerial parts of the trees and cycled in the ecosystem. For Zn and Ni, leaching was the main outputflux (N95% of the total output) and the plot budget (input–output) was negative, whereas for Pb the biomass net exportation represented 60% of the outputs and the budget was balanced. Cadmium and Cu had intermediate behaviours, with 18% and 30% of the total output relative to biomass exportation, respectively, and the budgets were negative. The net uptake by biomass was particularly important for Pb budgets, less so for Cd and Cu and not very important for Zn and Ni in such forest stands.
1. Introduction
The long range atmospheric transport of trace metals (TM: Cd, Cu, Ni, Pb and Zn) can reach remote areas (Steinnes and Friedland, 2005). Even when located far from direct sources of emissions, forests ecosystems are particularly sensitive to atmospheric pollution since the canopy interacts with atmospheric inputs and may increase TM fluxes reaching forest soils (Gandois et al., 2010a; Lovett and Lindberg 1984; Mayer, 1983) Although atmospheric metallic depositions are decreasing in Europe (Pacyna et al., 2009), TM atmospheric inputs have a potentially long lasting impact on forest ecosystems. Prevailing long range atmospheric pollution (both acidic and metallic) has highly influenced forest soil composition. Observed modifications include decreases in soil pH and base saturation (Nilsson and Grennfelt, 1988) as well as an increase in TM content (Steinnes and Friedland, 2005). In this context, TM budgets for forest ecosystems have to be studied to evaluate the rate and direction of change of TM
pools in forest soils, and whether forest ecosystems are sinks or sources of TMs (Sevel et al., 2009).
Mineral budgets for forest ecosystems have been extensively studied for major elements, mainly in the context of acidification and forestry management (Pacès, 1985; Probst et al., 1992; Ranger et al., 1997). Trace metal budgets have been less investigated (Heinrichs and Mayer, 1977; Bergkvist et al., 1989; Heinrichs and Mayer, 1977; Sevel et al., 2009; Ukonmaanaho et al., 2001). Contrasting budgets were observed, depending on the considered element and the chemical context of the sites (Bergkvist et al., 1989; Sevel et al., 2009). Cadmium, Ni and Zn are pH sensitive and are greatly leached from acidic sites. The prevailing soil acidification is thus of great importance when considering the TM budget.
Trace metal budgets include TMfluxes in solution draining the ecosystems (atmospheric deposition and soil leaching). Trace metal transfer to vegetation and exportation from the ecosystem via harvesting is rarely taken into account (Bergkvist et al., 1989), and sometimes even neglected (Ukonmaanaho et al., 2001). Since conifer forests are generally harvested in Europe, this is a major issue. Indeed, cycling by vegetation can be of major importance for TM dynamics in forest ecosystems. Trace metal assimilation by vegetation has been extensively studied (Kabata-Pendias and Pendias, 2001). In forest
⁎ Corresponding author. Université de Toulouse; UPS, INP; EcoLab (Laboratoire d'écologie fonctionnelle); ENSAT, Avenue de l'Agrobiopôle, F-31326 Castanet-Tolosan, France. Tel.: + 33 5 34 32 39 42; fax: + 33 5 34 32 39 01.
ecosystems, micronutrient TMs (Cu, Ni, Zn), as well as non-essential elements (Cd, Pb), are cycled by vegetation via root assimilation and return to the soil via litterfall (Bergkvist, 2001; Sevel et al., 2009).
In this study, we proposed to investigate the TM budget (stocks andfluxes) in a silver fir timber stand, including a detailed assessment of TM distribution in tree compartments. The objectives of the study were to:
- assess TM mobility in trees (by the way of the distribution between tree compartments)
- determine TM stocks and fluxes at the plot scale in order to establish TM budgets at the forest stand scale, and
- evaluate the importance of biomass uptake in the TM budget for the different studied elements.
2. Materials and methods 2.1. Studied site
The study site is located in the north-eastern part of France (Vosges Mountains, 48°N, 7°E). This site belongs to the French network RENECOFOR (Réseau National de suivi à long terme des Ecosystèmes Forestiers, i.e. National Network for the Long Term Monitoring of Forest Ecosystems,Ulrich, (1995)), set up in 1992 and managed by the ONF (Office National des Forêts, i.e. French Forest Board). This network is a part of the international co-operative programme ICP Forest (level II).
The main properties of the site are summarized inTable 1. The average slope is 16% and exposed to the northwest. The elevation is 400 m. The silverfir (Abies alba Miller) stand is mature (70 years). The soil is a sandy dystric cambisol (WRB) originating from colluvion of the Vosges sandstone. This sandstone has a low base cation content. It is composed of 84.3% quartz, 9.3% orthoclase, 0.8% albite, 4.2% illite, 0.4% chlorite and 0.7% iron oxides (Party, 1999). The humus is of an oligomull type. The soil is acidic (Table 1). The studied area, the Vosges Mountains, has been subjected to acid atmospheric inputs from long range atmospheric pollution for decades, although this site is far from local pollution sources (Probst et al., 1990). Acidification of soils, soil solutions and spring waters has occurred without recovery since the beginning of the last century (Moncoulon et al., 2007; Probst et al., 1999). The average amount of precipitation for the period of 1993–2007 was 1380 mm.
The trace metal content in the upper soil horizons revealed an atmospheric anthropogenic contribution (enrichment factor calcula-tionN2) for Pb and Cu (Gandois et al., 2010b), like the other forest soils in the area (Hernandez et al., 2003).
2.2. Sampling procedure and sample treatment 2.2.1. Sampling
Two soil pits, as described in Brêthes and Ulrich (1997), were refreshed with clean plastic tools and each soil layer was sampled for chemical analyses and bulk density measurements. The forestfloor (humus F layer) was sampled infive pits. Litter biomass was evaluated
by sampling and weighing a precise surface area of litter after drying to a constant weight (65 °C).
Thinning was performed in June 2007 in the studied site. Fourteen trees were selected in order to represent the diameter range (25– 50 cm) of the stand. For each tree,five disks of stem wood and three branches (top, middle and lower part of the crown) were sampled. For each branch, tree subsamples were sorted: principal axis, ramification and needles. For each tree, a composite sample for the stem wood and stem bark was made by pooling thefive disks on a weighted average basis. For each tree, one sample of bark and one sample of the stem, as well as three samples of the principal axis branches, three samples of ramification and three samples of needles, were considered for the analytical procedure.
Bulk precipitation (BD) and throughfall (TF) were collected weekly for one year (from September 2007 to October 2008). The sampling procedure was based on the ICP (http://www.icp-forests.org/) protocol, currently applied on this site. The BD was collected in a clearing located next to the forest site using a 20 cm diameter high density polyethylene (HDPE) funnel linked to a 2 l polypropylene (PP) bottle. The funnel was changed every four weeks. The TF was collected using three PVC gutters (0.85 m2of collecting surface) connected to a
20 l HDPE drum. All equipment used to collect and store samples was thoroughly rinsed with 1 N HCl and ultrapure MilliQ water. Each week, immediately after being collected, the samples were sent to the laboratory in refrigerated tanks and stored in a cold room (4 °C) before being analysed within a few days. During the same period, soil solutions were sampled at two depths (20 cm and 70 cm) with Teflon suction cups (Prenart equipment Aps, Frederiksberg Denmark). In each layer, two suction cups were connected to one HDPE bottle at each depth. Samples were collected weekly and the bottles placed under a vacuum with hand-operated vacuum pumps. Solution analyses were performed on volume averaged composite samples every four weeks.
2.2.2. Sample treatment
2.2.2.1. Soils and humus. In the laboratory, the soil samples were dried at room temperature, sieved with a 2 mm nylon mesh and kept in polypropylene bags before determining the total metal content, extractable pool and main soil parameters.
The main soil parameters, as well as the total content of trace (Cd, Cu, Ni, Pb, Zn) elements (after the HF/HClO4dissolution procedure)
and the Si content (after the alkaline fusion dissolution), were determined at the INRA Laboratory of Soil Science-Arras (France) following standardized methods (http://www.arras.inra.fr/). The exchangeable content of the soil samples was investigated using 0.01 M CaCl2 extraction (Houba et al., 1996; Menzies et al., 2007)
according to the protocol described byHouba et al. (2000).
2.2.2.2. Vegetation. The samples were dried (65 °C) and weighed for biomass estimation. The samples were then ground either in an agate or in a stainless steel grinder. A comparison of the analytical results obtained for the sets of samples ground with the two kinds of grinders showed no contamination.
Table 1
Properties of the studied site. Forest stand
(age)
Humus/soil type Layer Mean depth (cm) Texture pHa OCb Cd Cu Ni Pb Zn g kg−1 mg kg−1 Abies alba M. (70 years) Oligomull F 0.2 Sand 4.4 299.2 0.226 7.72 4.00 18.9 34.5 Dystic Cambisol A 0–5 3.9 26.2 0.021 3.73 2.18 24.0 12.6 A/S 5–15 4.3 9.7 0.025 1.85 2.55 18.7 11.1 S1 15–70 4.7 4.3 0.022 2.64 6.38 10.4 22.2 a pH H2O. b Organic carbon.
The H2O2/HNO3digestion of samples was performed in a
micro-oven at 220 °C and 20 bar pressure. The blanks showed no contamination during the digestion process: the measured concen-trations were always below the detection limits. The repeatability of the method was checked by mineralization and analytical determi-nation of triplicates. Coefficients of variation were less than 5%. The accuracy of the methods was estimated by determining the trace element concentrations of a standard certified material (1575a, pine needles). Twelve analytical replicates of the standard showed a slight underestimation of the TM concentration (−18% for Ni, −7% for Cu, −13% for Zn, −21% for Cd and −2% for Pb). These values were typical of the 5% to 30% deviation from certified vegetation values reported by
Feng et al. (1999).
2.2.2.3. Solutions. After pH and conductivity measurements, all samples werefiltered through a 0.22 μm nitrocellulose filter. 2.2.3. Chemical analysis
The trace elements were measured in solutions and digested samples by inductively coupled plasma mass spectrometry (ICP-MS 7500ce, Agilent Technologies). The solution samples were acidified (2%) with ultrapure HNO3 prior to ICP-MS analysis and kept in a
frozen chamber. Indium was used as the internal standard and SLRS-4 (River water certified for trace elements) was used as a reference material to check the accuracy of each run (recovery N95%). The quantification limits were 0.5 μg l−1for Fe and Al, less than 0.05μg l−1
for Mn, Ni, Cu and Zn and less than 0.005μg l−1for Cd, Zn and Pb.
Dissolved organic carbon (DOC) was determined on HCl acidified samples kept in glass devices with a Shimatzu apparatus TOC 5000. The quantification limit was 0.7 mg Cl−1.
2.2.4. Calculations
2.2.4.1. Biomass and mineral mass. Tree measurements were carried out during the tree sampling. Biomass models (equations predicting the biomass of each compartment from a measured tree parameter: diameter at 1.30 m) were established:
Biomass = a*ðdiameter1:30 mÞb ð1Þ
Where a and b are the adjusted parameters. Forest inventories were frequently carried out over the period of 1993–2008. The equations were applied to these inventories to estimate the growth of above-ground biomass. Afterwards, the increase in biomass was divided by the length of the period under consideration and the growth rate for this period was established. It was found to be constant for the inventoried period (1993–2008).
2.2.4.2. Stocks. Stocks of elements in the vegetation compartments and humus were calculated by multiplying element concentrations by the estimated actual biomass of the compartments and are expressed in g or kg by hectare.
Stocks of the elements in soils were calculated by multiplying element concentrations by the apparent density and the depth of the soil layer. They are expressed in g or kg by hectare.
2.2.4.3. Fluxes. The total deposition (TD) was the sum of wet atmospheric inputs and the canopy interception of dry deposition (DD). Bulk deposition was constituted of wet and a small undefined fraction of dry deposition on the funnels. Although wet-only precipitation measurements are more appropriate, BD data are often used as an input for the canopy budget model as estimations of the wet deposition (Staelens et al., 2008).
The additional TM dry deposition intercepted by the canopy can be an important input in forests (Bergkvist et al., 1989; Ukonmaanaho et al., 2001). Direct measurements of dry deposition are quite impossible
in forest ecosystems and thefiltering approach (Ulrich, 1983) was used to estimate them. Sodium was chosen as the reference ion (Bredemeier, 1988; Ukonmaanaho et al., 2001;Ulrich, 1983). Sodium uptake and leaching from the canopy was previously supposed to be low (Dambrine et al., 1998; Staelens et al., 2008). Trace metal and Na particulate depositions were supposed to follow the same aerody-namic pathways. This was verified in the case of long range atmospheric transport, since small particles are involved ( Ukonmaa-aanaho et al., 2001). The dry deposition of Na was calculated by the difference between TF and BD (Eq.(2))
DDðNaÞ = FTFð Þ−FNa BPð ÞNa ð2Þ
Where DD(Na) is theflux of dry deposition for Na (g ha−1a−1), F TF
(Na) is the throughfallflux of Na (g ha− 1a−1), and F
BD(Na) is the BD
flux of Na (g ha−1a−1). The calculations were made on an annual
basis.
Dry deposition of a given element (i) was then calculated by the product of DD for Na with the bulk input of the element and Na. DDðiÞ = FBDð Þ*i
DDðNaÞ
FBDðNaÞ; ð3Þ
Where DD(i) is theflux of dry deposition for i (g ha−1a−1) and
FBD(i) is the bulk deposition of i (g ha−1a−1).
In the case of Pb, which is thought not to interact with the canopy (Mayer, 1983), the additional dry deposition was estimated by the difference between TF and BD (Eq.(2)).
In order to evaluate the trace metal uptake by vegetation, the harvested part of the tree (i.e. the stem) was considered. The TM net uptake by vegetation was estimated by multiplying the increases in wood and bark biomass over the considered period by stem wood and bark element concentrations.
A lumped parameter water balance model, BILJOU (Bréda et al., 2006; Granier et al., 1999), was used to provide water drainagefluxes between the soil layers. The BILJOU model was calibrated and validated using a set of soil-water content measurements (14 profiles carried out monthly from April 2007 to June 2008). Trace metal losses were calculated by multiplying the monthly soil solution concentra-tions at 20 cm and 70 cm depths by the corresponding waterflux estimated with the BILJOU model. The calculated fluxes were combined to obtain the annual elementalflux.
The weathering release of base cations from the parent material was determined using the PROFILE model (Sverdrup and Warfinge, 1993). The weathering release of base cation was low (BCw=0.11 keq ha−1a−1).
Indeed, the parent material was mainly constituted of quartz and the soil had a sandy texture. The weathering release of trace metals was scaled to the weathering release of base cations using the molar ratio of trace metals to base cations in the parent material (Pacès, 1998; deVries et al., 2005). Vertical uniformity of weathering was assumed and only the weatheringflux related to the considered depth was taken into account for the budget.
The stocks andfluxes were established and valid for the current conditions (2007–2008).
All statistical treatments were performed using STATISTICA software (Statsoft, Tulsa, OK, USA). Significant differences between sets of samples were tested using the Kruskal–Wallis test. Correlations were evaluated with Pearson's coefficients.
3. Results
3.1. TM concentrations in precipitation and soil solutions
Mean TM concentrations in the atmospheric inputs and soil solutions are reported inTable 2. Rainfall TM concentrations are modified as the water percolates through forest cover. Exchanges
with the canopy, as well as the accumulation of dry deposition, greatly influence TM concentration and fluxes under the canopy (Lovett and Lindberg, 1984). The main processes which explain the behaviour of each studied element were identified by TM speciation in throughfall (Gandois et al., 2010a). Nickel, Cd and Zn are mostly found in labile forms in throughfall, and can thus be assimilated by vegetation. Lead and Cu are strongly complexed by DOC in throughfall and their increased concentration under the canopy is thought to result from the dissolution of accumulated dry deposition (Hou et al., 2005).
The soil solution pH and Ni, Cu and Cd concentrations in soil solutions were not significantly different between the depths of 20 cm and 70 cm (Kruskal Wallis test,α=0.05 on a monthly basis, n=12). The lead concentration was significantly higher at 20 cm than in the deeper layer. At 20 cm, below the organic layer, a higher DOC concentration might have enhanced the solubility of Pb (Gandois et al., 2010a). Zinc concentrations were significantly higher in the deeper layer. This could be related to the increase in the total Zn content in deeper soil layers.
3.2. Trace elements in vegetation 3.2.1. Concentrations
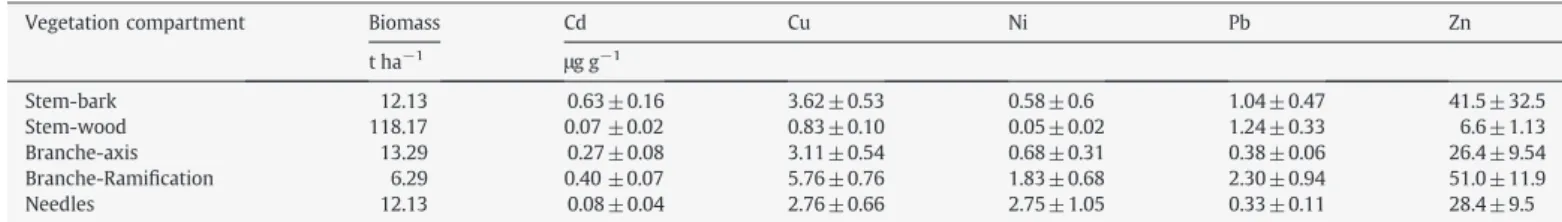
The mean concentrations measured in all studied tree compart-ments are presented inTable 3. The measured concentrations were in the range (or even below) of concentrations measured in non-contaminated sites for various tree species, including sugar maple and yellow birch (Morrison and Hogan, 1986; Rademacher, 2005) and Italian stone pine and oleander (Rossini Oliva and Mingorance, 2006). The lowest concentrations of Cu, Ni and Zn were found in the stem wood, whereas the lowest concentrations of Cd and Pb were in the needles and wood. The highest concentrations of Cu, Pb and Zn were measured in the branches (ramification), whilst the highest concen-trations of Ni and Cd were in the needles and bark, respectively. A concentration increase was observed for all of the elements in branches from the principal axis to ramification.
The accumulation and movement of each element in the trees was assessed using the ratio between TM concentrations in tree compart-ments relative to concentrations in wood (Fig. 1) (Rossini Oliva and Mingorance, 2006). The ratio for bark was above 1 for all elements except Pb (Fig. 1). Similar ratios for branch axis/stem wood and needles/ stem wood were observed. Higher concentrations of TM were measured in the crown compared to the stem (except for Pb in branch axes and needles). The calculated ratios for Ni were particularly high as a result of very low Ni concentrations in the stem. The standard deviation was high but all measured ratios were far above 1.
3.2.2. Element correlation in the vegetation
A correlation analysis was performed between trace element concentrations in all tree compartments. A mean value for each tree was used for the branch and needle compartments. No significant correlations were observed between the TMs in the stem, bark and branches. However, significant correlations were observed in the needles, showing similar behaviours of the TMs. Significant (pb0.01) positive correlations were observed between Ni (r = 0.76), Zn (r = 0.85) and Cu and between Cd and Zn (r = 0.95) in needles.
Linear relationships with comparable slopes (Fig. 2) were observed between Cu and Ni and Zn.
3.3. Stocks of trace metals in the ecosystem 3.3.1. Humus and soil
Total element storage in the litter and total soil (b2 mm) and exchangeable pools for the different soil layers are reported inTable 4. The humus stocks were small compared to the total soil stocks. The humus was of an oligomull type with a quick turnover and therefore the humus layer was very thin. Consequently, its low mass (around 10 t ha−1) represented a low metal storage compartment. In the humus, stocks were in the order (mass basis): ZnNPbNCuNNiNCd. In the soil, the element stocks were in the order: ZnNPbNNiNCuNCd. In the soil, stocks increased with depth as the layer thickness increased. Exchangeable metal stocks varied from one element to another but generally increased with depth, except for Pb (decreased with depth) and Zn (remained constant).
The respective percentages of the element stocks in the trees, humus and the exchangeable and non-exchangeable TMs in soil are shown inFig. 3. Soil was the most important storage compartment in the ecosystem for trace metals. The surface (A and A/S) layers contained 42% of the total soil content of Pb and 20% of Cd and Cu. Nickel and Zn were mainly stored in the deeper layer (88% and 84%, respectively). The exchangeable TMs represented 27% of the total metal stock for Cd, 13% for Cu, 6% for Zn and less than 1% for Ni and Pb. The percentages of elements stored in the vegetation and humus were low (b2%), except for Cd (9% in the vegetation).
3.3.2. Vegetation
The vegetation biomass was mainly (77%) located in the stem wood (Table 3). Trace metal stocks in the vegetation were in the order (on a weight basis): CdbNibPbbCubZn (Fig. 4). The entire stem (wood plus bark) accounted for 59% to 87% of the total trace element stock in the vegetation. Stem wood was the main storage compart-ment for all elecompart-ments except Ni, ranging from 36% for Cd to 82% for Pb. This was in the range of the 70% of total stock reported in the stem by
Morrison and Hogan (1986). Only 11% (Pb) to 27% (Cd) of the TM stand stock was stored in the branches (principal axis and rami fica-tions). The needles accounted for a small pool of TM, from less than 1% (Pb) to 6% (Zn) of the total trace element stock. Nevertheless, Ni was a notable exception: the needles accounted for 26% of the total vegetation storage.
3.4. TM budget at the stand scale
The hydrochemical budget at a catchment or stand scale is written as follows (Bergkvist et al., 1989) (Eq.(4)):
ΔStocks = Inputs−Outputs
ΔStocks = ðAtmospheric Inputs þ WeatheringÞ
−ðLeaching þ Biomass Net uptakeÞ ð4Þ Thefluxes estimated as described in Section 2 are reported in
Table 5. Atmospheric inputs include BD and the estimation of DD. The stand scale budget is established considering the leachingflux at
Table 2
Means and standard deviations of elements and Dissolved Organic Carbon (DOC) concentrations, pH measured in the different solutions of the plot. (n = 14).
DOC pH Cd Cu Ni Pb Zn
mg l−1 μg l−1
Atmospheric inputs Bulk – 4.6 ± 0.4 0.028 ± 0.030 0.46 ± 0.36 0.27 ± 0.19 0.42 ± 0.67 14.2 ± 16.3 Throughfall 9.3 ± 5.2 4.7 ± 0.5 0.058 ± 0.030 1.46 ± 1.02 0.69 ± 0.35 1.44 ± 1.10 33.2 ± 20.6 Soil solution 20 cm 10.3 ± 2.0 4.2 ± 0.2 0.211 ± 0.050 2.67 ± 3.34 6.75 ± 7.61 1.02 ± 0.37 70.5 ± 53.5 70 cm 6.7 ± 1.6 4.4 ± 0.4 0.176 ± 0.040 2.98 ± 1.44 2.99 ± 0.65 0.51 ± 0.36 123.4 ± 36.0
70 cm, since 80% of thefine roots are located above 70 cm (Brêthes and Ulrich, 1997). Indeed, a budget is also established considering the leachingflux at 20 cm to assess the behavior of the surface soil layer. Weathering inputfluxes are weak compared to other fluxes (one or two orders of magnitude lower). In temperate climates, weathering fluxes are often insignificant compared to other fluxes (deVries et al., 2005), although in boreal soils weatheringfluxes were found to be in the order of magnitude of other consideredfluxes in the corresponding catchment (Starr et al., 2003).
Major TM inputs to the forest stand come from the atmosphere. Dry deposition (DD) constitutes almost half of the total atmospheric inputs. Both methods used to estimate the dry deposition of Pb (net flux and filtering approaches) provided similar results (3.9 gha−1a−1
for thefiltering approach, 4.1 gha− 1a−1for the netflux).
The leachingfluxes were lower for Cd, Cu, Ni and Pb at 70 cm compared to 20 cm as a result of the drainage waterflux decrease from 20 cm to 70 cm (840 mm to 690 mm, respectively), thus, these elements were partially retained in the soil column. On the contrary, Zn fluxes were higher at 70 cm in relation to the higher Zn concentration in the soil solution in deeper layers.
Leaching fluxes at 70 cm were the main output fluxes from the ecosystem for Cd, Ni, Cu and Zn. Similar observations of high leaching of TMs related to acidic soils have been reported (Bergkvist et al., 1989).
Biomass exportation constituted less than 5% of the outputfluxes from the ecosystem for Ni and Zn, but 18% for Cu, 30% for Cd and 60% for Pb.
All budgets were negative when calculated for the upper soil layer (20 cm). The calculated budget for the whole soil column (70 cm) was almost balanced for Pb, whereas it was negative for Cd, Cu, Ni and Zn. The stand was a net source for these latter elements.
4. Discussion
4.1. TM mobility in the forest ecosystem
Copper, Ni and Zn were more concentrated in branches and needles compared to the stem wood and Cd was more concentrated in
the branches (high ratio of branches and needles/wood, seeFig. 1). These concentration patterns between tree compartments were similar to what was observed byMorrison and Hogan (1986)in a sugar maple birch. These elements are mobile and can be translocated in plants (Clemens, 2006). In trees, they are enriched in the crown (Reimann et al., 2007a). These elements are cycled in forest ecosystems. Indeed, 50% of the amount of Cd and Zn taken up from soil by the trees returns to the soil either by leaching from needles or from litterfall (Bergkvist et al., 1989). Elements are made available in the soil after litter decomposition and can be leached from the ecosystem or taken up by vegetation (Reimann et al., 2007b). An important proportion of Cd was stored in the vegetation (9%). Indeed, Cd was the most extractable studied element (Gandois et al., 2010b; Rieuwerts et al., 2006). Uptake by vegetation is therefore linked to exchangeability in soil. Copper, Ni and Zn are micronutrients which are assimilated by trees (Clemens, 2006). Significant correlations were observed in the needles between Zn, Cu and Cd concentrations. Although Cd has no known biological role (Kabata-Pendias and Pendias, 2001), Cd uptake by living cells via essential cation routes (Ca, Zn) is possible (Clemens, 2006) and Zn substitution by Cd in living cells has been observed (deBaar and LaRoche, 2003).
The concentration of Pb did not increase from the stem to the crown (except in branch ramifications). A lower concentration in the wood compared to bark and leaves has previously been observed in birch (Reimann et al., 2007a). Lead mobility between tree compart-ments appeared to be low. Only a small fraction of lead contained in the wood was translocated to the aerial part of the trees. It has been observed in many plants that Pb accumulates in the roots and is only partially translocated to the above-ground biomass (Kabata-Pendias and Pendias, 2001; Probst et al., 2009). Lead measured in branch ramifications and needles might have both soil and atmospheric origins (Klaminder et al., 2005), although in the upper parts of trees, lead from an atmospheric origin might be predominant (Hovmand et al., 2008).
4.2. Bark use as an indicator for element origin
The ratio of the concentration in bark to the concentration in wood was above 1 for all elements, except Pb (Fig. 1). This ratio is used to determine the atmospheric origin of elements in bark in polluted areas (Rossini Oliva and Mingorance, 2006). The atmospheric inputs of these elements on the study site are limited (Gandois et al., 2010a). In the present case study, the higher concentrations of Cd, Cu, Ni and Zn in bark might be due to an internal source in the ecosystem (leaching from canopy). These elements are cycled in the ecosystem and leached in throughfall and stemflow (Avila and Rodrigo, 2004; Gandois et al., 2010a). The Pb concentrations were similar in the bark and in the stem wood. Element uptake by wood through the bark is possible but this constitutes a minor route (Watmough and Hutchinson, 2003). Thus, it is unlikely that Pb was translocated from the bark to the wood to a greater extent than the other elements. The high Pb concentrations observed in the stem wood might rather be explained by soil uptake and low translocation to the tree crown (Reimann et al., 2007a; Watmough and Hutchinson, 2003). In sites with a low level of contamination, bark is not an accurate indicator of
Table 3
Biomass, means and standard deviations of TM concentrations measured in the different compartments of trees (n = 14).
Vegetation compartment Biomass Cd Cu Ni Pb Zn t ha−1 μg g−1 Stem-bark 12.13 0.63 ± 0.16 3.62 ± 0.53 0.58 ± 0.6 1.04 ± 0.47 41.5 ± 32.5 Stem-wood 118.17 0.07 ±0.02 0.83 ± 0.10 0.05 ± 0.02 1.24 ± 0.33 6.6 ± 1.13 Branche-axis 13.29 0.27 ± 0.08 3.11 ± 0.54 0.68 ± 0.31 0.38 ± 0.06 26.4 ± 9.54 Branche-Ramification 6.29 0.40 ±0.07 5.76 ± 0.76 1.83 ± 0.68 2.30 ± 0.94 51.0 ± 11.9 Needles 12.13 0.08 ± 0.04 2.76 ± 0.66 2.75 ± 1.05 0.33 ± 0.11 28.4 ± 9.5
Fig. 1. Ratios of TM concentrations measured in bark to wood, branches to wood and needles to wood. n = 13.
the atmospheric origin of TM since other factors can influence the TM content in tree compartments (Reimann et al., 2007a).
4.3. The importance of vegetation in a TM budget for a forest stand 4.3.1. Interception of dry deposition
The estimation of dry deposition for Cd, Cu and Ni was based on thefiltering approach. Lead dry deposition can also be estimated by the difference between BD and TFfluxes since this element does not interact to a large extent with the canopy. In the present study, both methods gave similar results. Calculations on other sites (not shown) demonstrated that estimations based on Na could underestimate the DD. Nevertheless, uncertainties on dry deposition would not significantly modify the global budget, since leaching fluxes for Cd, Ni, Cu and Zn are much greater than atmospheric inputs.
For all elements, the DDfluxes were estimated to constitute about 45% of the total atmospheric inputs. This is in accordance with the previous estimates of 30% to 50% reported byReimann et al. (2007a), 50% estimated byUkonmaanaho et al. (2001)and 40% estimated by
Sevel et al. (2009). Forest cover greatly increases the atmospheric inputs by dry deposition interception.
4.3.2. Importance of the different fluxes in a forest stand budget: does vegetation have a key role?
At the plot scale, a negative budget was observed for Cd, Cu, Ni and Zn, whereas the budget was balanced for Pb (Table 5). Cadmium, Cu, Ni and Zn were leached to a great extent in the soil solution below the rooting zone, and thus the ecosystem behaved as a potential net source of these elements for ground waters. Similar budgets have been observed in acidic catchments (Bergkvist et al., 1989). Lead is less sensitive to acidic conditions and has a greater affinity for organic matter in soils (Bergkvist, 2001; Gandois et al., 2010b). Consequently, Pb leaching is moderate (Bergkvist, 1987).
Trace metal soil stocks evolve very slowly. For Pb, the soil stock will remain unchanged, since the budget was balanced. The estimated annual losses represented less than 1% of the soil stock for Cd and less than 0.1% for the other elements (Cu, Ni, Zn). This is similar to the estimate of 1% for a spruce stand and 3% for an acid birch stand by
Bergkvist (2001). If the surface layer alone is considered, the percentages of loss are increased: 10% for Cd and 3% for Ni and Zn. These elements might migrate from the surface layer to deeper layers. The roots were not sampled in this study. They might be an important pool in the ecosystem, especially for the less mobile elements (Pb). Indeed, it has been shown in the case of vegetation grown on contaminated soils that TMs accumulated in roots (Brunner et al., 2008; Probst et al., 2009). This compartment was not considered in the budget since roots were not harvested. The TMs contained in the roots may be exported from soil via soil solution leaching when stumps decompose.
The net uptake of TMs by the biomass is rarely considered in plot scale budgets (Bergkvist et al., 1989) and is often even neglected (Ukonmaanaho et al., 2001). Biomass exportation represents a small proportion of the soil elemental stock (less than 0.5% for all elements) and the net uptake by trees could not be considered as a remediation mean, although the net TM uptake by biomass is of great importance when considering the TM budget in a timber forest stand. Our results showed that net biomass uptake accounted for less than 5% of the outputflux for Ni and Zn, but 18% for Cu, 30% for Cd and 60% for Pb. Thus, it was a significant source of flux for Cu and Cd and a major flux in the case of Pb. The stem only (wood plus bark) was considered for biomass exportation in a mature stand.
The importance of net biomass uptake in the budget depended on element mobility in the trees. In the case of Zn, Cu and Ni, biomass exportation was low since these elements were translocated in trees and did not accumulate in the stems. They quickly returned to the soil by throughfall and litterfall, as stated byUkonmaanaho et al. (2001). Cadmium had a similar behaviour but its high concentration in bark
Fig. 2. Relationships between Zn, Ni and Cu (left) and Cd and Zn (right) concentrations in needles. n = 13. Regressions equations are given.
Table 4
Humus and soil stocks of total (Tot) and exchangeable (Ex) elements for each layer. Layer Depth min–max
(cm)
Biomass Cd Cu Ni Pb Zn
t ha−1 Tot Ex Tot Ex Tot Ex Tot Ex Tot Ex F 0.2 10.1 g ha−1 1.323 n.a 46.3 n.a 24.06 n.a 111.44 n.a 202.0 n.a
A 0–5 kg ha−1 0.017 0.007 2.4 0.05 1.72 0.085 21.25 0.428 9.7 1.4 A/S 5–15 0.028 0.015 2.1 0.19 2.86 0.088 21.17 0.171 12.5 1.1 S1 15–70 0.114 0.028 14.5 2.17 38.26 0.153 58.3 0.105 127 5.9 n.a: not analysed.
led to a more important biomass uptake. On the contrary, Pb had a lower degree of translocation in the tree and accumulated in the stem. Thus, biomass uptake is significant and greatly participates in Pb immobilization and exportation from the stand. Neglecting biomass uptake, especially in the case of Pb, would lead to incorrect conclusions about its behaviour at the plot scale in such silver fir forests.
5. Conclusions
This study provides new results on the importance of vegetation for TM cycling in an acidic forest ecosystem. The precise distribution and behaviour of TMs between tree compartments was evaluated.
At the plot scale, TMs are mainly located in the soil. Humus and vegetation stocks are small. The mobility of TMs in the ecosystem depends on their extractability in the soil. Cadmium, which is the most extractable element, is also located in vegetation.
The studied elements had different concentration patterns in the vegetation. Cadmium, Cu, Ni and Zn were more concentrated in the crown, whereas Pb was more concentrated in the stem bark and wood. The stem constituted 60% to 80% of the vegetation stock for Cd, Cu, Pb and Zn, but only 25% of Ni, which was located in the crown and in the needles (N20%). This demonstrates the different TM behaviours in trees: Cd, Cu, Zn and Ni are mobile and translocated between tree compartments, whereas Pb is immobilized in the stem.
Elemental budgets at the plot scale were negative for Cd, Cu, Ni and Zn, but the elemental stock evolves very slowly. The budget was balanced for Pb. The major TM input flux to the ecosystem was atmospheric input, about half of which was composed of dry deposition. The major outputflux in this acidic soil context was the leachingflux. The exportation by biomass represented less than 5% of the outputflux for Ni and Zn, but 18% for Cu, 30% for Cd and 60% for Pb. This flux must be taken into account, since it is far from being negligible, especially for the elements with a low mobility.
Acknowledgements
This project benefited from a financial support by ADEME (French Agency for Environment) and received logistic support from the ONF (French Forest board). The authors warmly thank, the ONF staff (Marc Lanier, Vincent Borthelle, Jean-Pierre Chassagne, Joël Clamart, Gilles Fournel, Jean-Luc Fiol, René Gregoire, Alain Jacquemard, François Mouchot, Florence Pertile, Pierre Trithardt, Jérôme Vany) for the great help during the field work, Gael Durbe and Alain Alric (EcoLab, Université de Toulouse, UPS-CNRS-INP) for help in thefield work and technical assistance in the laboratory, Frederic Candaudap (LMTG, Université de Toulouse, UPS-CNRS-IRD) for ICPMS analysis assistance, Frederic Julien (EcoLab, Université de Toulouse, UPS-CNRS-INP) for the major anion analysis and Christophe Hissler (CGL, Luxembourg) for help during the mineralisation of the vegetation samples. The authors also thank the anonymous reviewers who helped to improve the previous version of this paper. Laure Gandois benefited from an ADEME fellowship.
References
Avila A, Rodrigo A. Trace metalfluxes in bulk deposition, throughfall and stemflow at two evergreen oak stands in NE Spain subject to different exposure to the industrial environment. Atmos Environ 2004;38(2):171–80.
Bergkvist B. Leaching of metals from forest soils as influenced by tree species and management. For Ecol Manage 1987;22(1):29–56.
Bergkvist B. Changing of lead and cadmium pools of Swedish forest soils. Water Air Soil Pollut 2001;1(3):371–83.
Bergkvist B, Folkeson L, Berggren D. Fluxes of Cu, Zn, Pb,Cd, Cr and Ni in temperate forest ecosystems. A literature review. Water Air Soil Pollut 1989;47:217–86. Bréda N, Huc R, Granier A, Dreyer E. Temperate forest trees and stands under severe
drought: a review of ecophysiological responses, adaptation processes and long-term consequences. Ann For Sci 2006;63(6):625–44.
Bredemeier M. Forest canopy transformation of atmospheric deposition. Water Air Soil Pollut 1988:121–38.
Brêthes A, Ulrich E. RENECOFOR– Caractéristiques pédologiques des 102 peuplements du réseau. ONF, Dept des recherches Techniques; 1997. 573 pp.
Brunner I, Luster J, Günthardt-Goerg MS, Frey B. Heavy metal accumulation and phytostabilisation potential of treefine roots in a contaminated soil. Environ Pollut 2008;152(3):559–68.
Clemens S. Toxic metal accumulation, responses to exposure and mechanisms of tolerance in plants. Biochimie 2006;88(11):1707–19.
Dambrine E, Pollier B, Bonneau M, Ignatova N. Use of artificial trees to assess dry deposition in spruce stands. Atmos Environ 1998;32(10):1817–24.
deBaar HJW, LaRoche J. Trace metals in the oceans: evolution, biology and global change. Marine science frontiers for Europe; 2003. p. 79.
Fig. 3. Percentages of TM stocks contained in vegetation, humus, exchangeable and non exchangeable pools of soils. The soil stocks are given for the three soil layers (A, A/S and S).
Fig. 4. Stocks of TM in vegetation and distribution between tree compartments.
Table 5
Element budget at the stand scale. Budget is calculated as input–output. BD: Bulk Deposition; DD: Dry Deposition.
g ha−1an−1 Cd Cu Ni Pb Zn Input (1) BD 0.33 5.6 3.2 5.2 173 DD 0.26 4.4 2.5 3.8/4.1a 136 Weathering 0.0017 0.23 0.47 0.89 1.1 Output (2) Leaching (20 cm) 1.81 22.5 43.0 9.6 546 Leaching (70 cm) 1.40 15.1 23.9 3.7 996 Biomass exportation 0.59 5.5 0.5 6.2 49 Budget (1)–(2) 20 cm −1.79 −17.8 −37.6 −6.4 −285 70 cm −1.38 −10.3 −18.2 0.2 −735 a
deVries W, Schütze G, Lofts S, Tipping E, Meili M, Römkens PFAM, et al. Calculation of critica loads for cadmium, lead and mercury. Alterra Report 2005; 2005. Feng XB, Wu SL, Wharmby A, Wittmeier A. Microwave digestion of plant and grain
standard reference materials in nitric and hydrofluoric acids for multi-elemental determination by inductively coupled plasma mass spectrometry. J Anal At Spectrom 1999;14(6):939–46.
Gandois L, Tipping E, Dumat C, Probst A. Canopy influence on trace metal atmospheric inputs on forest ecosystems: speciation in throughfall. Atmos Environ 2010a;44(6): 824–33.
Gandois L, Probst A, Dumat C. Modeling trace metal extractability and solubility using soil properties in French forest soils. Eur J Soil Sci 2010b;61:271–86.
Granier A, Bréda N, Biron P, Villette S. A lumped water balance model to evaluate duration and intensity of drought constraints in forest stands. Ecol Modell 1999;116(2):269–83.
Heinrichs H, Mayer R. Distribution and cycling of major and trace elements in two central European forest ecosystems. J Environ Qual 1977;6(4):402–7.
Hernandez L, Probst A, Probst JL, Ulrich E. Heavy metal distribution in some French forest soils: evidence for atmospheric contamination. Sci Total Environ 2003;312(1): 195–219.
Hou H, Takamatsu T, Koshikawa MK, Hosomi M. Trace metals in bulk precipitation and throughfall in a suburban area of Japan. Atmos Environ 2005;39(20):3583–95. Houba VJG, Lexmond T, Novozamsky I, van der Lee JJ. State of the art and future
developments in soil analysis for bioavailability assessment. Sci Total Environ 1996;178(19):21–8.
Houba VJG, Temminghoff EMJ, Gaikhorst GA, VanVark W. Soil analysis procedures using 0.01 M calcium chloride as extraction reagent. Commun Soil Sci Plant Anal 2000;31(9): 1299–396.
Hovmand MF, Kemp K, Kystol J, Johnsen I, Riis-Nielsen T, Pacyna JM. Atmospheric heavy metal deposition accumulated in rural forest soils of southern Scandinavia. Environ Pollut 2008;155(3):537–41.
Kabata-Pendias A, Pendias H. Trace elements in soils and plants. CRC Press; 2001. Klaminder J, Bindler R, Emteryd O, Renberg I. Uptake and recycling of lead by boreal
forest plants: Quantitative estimates from a site in northern Sweden. Geochim Cosmochim Acta 2005;69(15):2485–96.
Lovett GM, Lindberg SE. Dry deposition and canopy exchange in a mixed oak forest as determined by analysis of throughfall. J Appl Ecol 1984;21:1013–27.
Mayer R. Interaction of forest canopies with atmospheric constituents: aluminium and heavy metals. In: Ulrich B, Pankrath J, editors. Effects of accumulation of air pollutants in forest ecosystems; 1983. p. 47–55.
Menzies NW, Donn MJ, Kopittke PM. Evaluation of extractants for estimation of the phytoavailable trace metals in soils. Environ Pollut 2007;145(1):121–30. Moncoulon D, Probst A, Martison L. Modeling acidification recovery on threatened
ecosystems: application to the evaluation of the Gothenburg protocol. Water Air Soil Pollut 2007;7(1):307–16.
Morrison IK, Hogan GD. Trace element distribution within the tree phytomass and forestfloor of a tolerant hardwood stand, Algoma, Ontario. Water Air Soil Pollut 1986;31:493–500.
Nilsson J, Grennfelt P. Critical loads for sulfur and nitrogen. Miljoreport; 1988. Pacès T. Sources of acidification in Central Europe estimated from elemental budgets in
small basins. Nature 1985;315:31–6.
Pacès T. Critical loads of trace metals in soils: a method of calculation. Water Air Soil Pollut 1998;105(1):451–8.
Pacyna JM, Pacyna EG, Aas W. Changes of emissions and atmospheric deposition of mercury, lead, and cadmium. Atmos Environ 2009;43(1):117–27.
Party J.P. Acidification des sols et des eaux de surface des écosystemes forestiers français: facteurs, mécanismes et tendances. Thèse de l'Université Louis Pasteur 1999.
Probst A, Dambrine E, Viville D, Fritz B. Influence of acid atmospheric inputs on surface water chemistry and mineralfluxes in a declining spruce stand within a small granitic catchment (Vosges massif, France). J Hydrol 1990;116:101–24. Probst A, Viville D, Ambroise B, Dambrine E. Hydrochemical budgets of a small forested
granitic catchment exposed to acid deposition– the Strengbach catchment case study (Vosges massif, France). Water Air Soil Pollut 1992;62(3):337–47. Probst A, Party JP, Février C, Dambrine E, Thomas AL, Stussi JM. Evidence of springwater
acidification in the Vosges Mountains (North-East of France): influence of bedrock buffering capacity. Water Air Soil Pollut 1999;114(3):395–411.
Probst A, Liu HY, Fanjul M, Liao B, Hollande E. Response of Vicia faba L. to metal toxicity on mine tailing substrate: Geochemical and morphological changes in leaf and root. Environ Exp Bot 2009;66(2):297–308.
Rademacher P. Contents of heavy metals in tree components of economical important species in relation to their residual utilisation. Holz Roh Werkst 2005;63(3–1): 220–30.
Ranger J, Marques R, Colin-Belgrand M. Nutrient dynamics during the development of a Douglas-fir (Pseudotsuga menziesii Mirb.) stand. Acta Oecol 1997;18(2):73–90. Reimann C, Arnoldussen A, Finne TE, Koller F, Nordgulen O, Englmaier P. Element
contents in mountain birch leaves, bark and wood under different anthropogenic and geogenic conditions. Appl Geochem 2007a;22(7):1549–66.
Reimann C, Arnoldussen A, Englmaier P, Filzmoser P, Finne TE, Garrett RG, et al. Element concentrations and variations along a 120-km transect in southern Norway– anthropogenic vs. geogenic vs. biogenic element sources and cycles. Appl Geochem 2007b;22(4):851–71.
Rieuwerts JS, Ashmore MR, Farago ME, Thornton I. The influence of soil characteristics on the extractability of Cd, Pb and Zn in upland and moorland soils. Sci Total Environ 2006;366(2):864–75.
Rossini Oliva S, Mingorance MD. Assessment of airborne heavy metal pollution by aboveground plant parts. Chemosphere 2006;65(2):177–82.
Sevel L, Hansen H, Raulund-Rasmussen K. Mass balance of cadmium in two contrasting oak forest ecosystems. J Environ Qual 2009;38(3):93-102.
Staelens J, Houle D, Schrijver AD, Neirynck J, Verheyen K. Calculating dry deposition and canopy exchange with the canopy budget model: review of assumptions and application to two deciduous forests. Water Air Soil Pollut 2008;191(1): 149–69.
Starr M, Lindroos AJ, Ukonmaanaho L, Tarvainen T, Tanskanen H. Weathering release of heavy metals from soil in comparison to deposition, litterfall and leachingfluxes in a remote, boreal coniferous forest. Appl Geochem 2003;18(4):607–13. Steinnes E, Friedland AJ. Metal contamination of natural surface soils from long-range
atmospheric transport: existing and missing knowledge. Environ Rev 2005;14(3): 169–86.
Sverdrup H, Warfinge P. Calculating field weathering rates using a mechanistic geochemical model PROFILE. Appl Geochem 1993;8(3):273–83.
Ukonmaanaho L, Starr M, Mannio J, Ruoho-Airola T. Heavy metal budgets for two headwater forested catchments in background areas of Finland. Environ Pollut 2001;114(1):63–75.
Ulrich B. Interaction of forest canopies with atmospheric constituents: SO2, alkali and
earth alkali cations and chloride. Effects of accumulation of air pollutants in forest ecosystems; 1983. p. 33–45.
Ulrich E. Le réseau RENECOFOR: objectifs et réalisation. La revue forestière française, XLVII(2). ; 1995. p. 107–24.
Watmough SA, Hutchinson TC. Uptake of207
Pb and111
Cd through bark of mature sugar maple, white ash and white pine: afield experiment. Environ Pollut 2003;121(1): 39–48.