USING AVAILABLE TIME SERIES OF PASSIVE AND ACTIVE MICROWAVE TO
DEVELOP SMAP FREEZE/THAW ALGORITHMS ADAPTED FOR THE CANADIAN
SUBARCTIC.
P. Kalantari
1, M. Bernier
1, K.C. McDonal
2, and J. Poulin
11: INRS, Centre Eau Terre Environnement
2: CUNY Environmental Crossroads Initiative and CREST Institute
ABSTRACT
Seasonal terrestrial Freeze/Thaw cycle in Northern Quebec Tundra (Nunavik) determined and evaluated with Passive and Active Microwave Observations. SMOS time series data were analyzed to examine seasonal variations of soil freezing, and to assess the impact of snow cover and land cover on freeze-thaw cycle. Further, the soil freezing maps derived from SMOS observations compared to microwave active images in the region near Umiujaq and Field survey data. The objective is to develop algorithms to follow the seasonal cycle of freezing and thawing of the soil in the Tundra and Boreal forest. Field data shows that freezing and thawing dates vary much spatially at the local scale in the Boreal Forest and the Tundra. Therefore, the field validation of the F/T state maps at the regional scale will be very important. Agreement Factor derived from comparison of SMOS FT maps with daily in-situ data shows low values which does not seems to be acceptable. New parameters such as lake and pond as well as vegetation type and height present on surface have to be introduced in the algorithm to obtain more realistic estimations.
Index Terms— Passive Microwave, Freeze-Thaw,
Frozen Soil, SMOS, Remote Sensing,
1. INTRODUCTION
This study was conducted in the context of the SMAP (Soil Moisture Active and Passive) mission of NASA to be launch on November 2014 which includes both a Radiometer and a Synthetic Aperture Radar operating at L-band (1.20-1.41 GHz). This L-band is promising for Freeze/Thaw (F/T) monitoring. This wavelength penetrates well through the atmosphere, and hence the instrument probes the earth surface emissivity. In fact, SMAP will have the capability to make coincident measurements of surface emission and backscatter at L-band, and this frequency has
the ability to sense the soil conditions through moderate land cover. The accuracy, resolution, and global coverage of the SMAP mission will make possible a systematic updating of frozen ground maps and monitoring the seasonal F/T cycle. The seasonal Freeze/Thaw (F/T) cycle plays an important role in Boreal and Arctic regions where structure, condition and distribution of vegetation are strongly regulated by environmental factors such as soil moisture and nutrient availability, permafrost, growing season length and disturbance [1, 2]. In these seasonally frozen environments, the growing season is determined primarily by the length of the non-frozen period. Variations in both timing of spring thaw and growing season length have a major impact on atmospheric-terrestrial carbon exchange in Boreal regions [3-6].
Microwave sensors are well adapted tools to monitor the F/T cycle over the Boreal and Arctic regions [5, 6]. The frozen soil mapping can be improved by using SMAP instrument. The radiometric accuracy, the better spatial resolution (40 km passive and 3 km active), and the global and the global coverage of SMAP will make possible a systematic updating of frozen ground maps and monitoring the seasonal F/T cycle at a regional scale.
The main objective of this study is to develop and validate algorithms to monitor F/T over the Tundra and the Boreal Forest using available time series of passive microwave and SAR L-band data. The algorithms should take care of the surface heterogeneity (vegetation, soil, relief) within a given pixel of a few kilometers. For that purpose, data from the Soil Moisture and Ocean Salinity (SMOS) mission launched in November 2nd 2009 will be used [7]. SMOS carries a single payload, an L-Band 2D interferometric radiometer in the 1.40–1.43 GHz. The SMOS data used in this project is from fall 2009 to the end of winter 2012.
2550
2. IN-SITU DATA
The experimental site (Figure 1) is located near Umiujaq (56.55°N, 76.55°O) in Nunavik. It is a zone of discontinuous permafrost situated at the tree line. This site has been the subject of more than 20 years of studies by the CEN. Meteorological data were obtained from two stations, one from Environment Canada and one from the Centre of Northern Studies (CEN). Further, in situ temperature and humidity sensors were installed near the surface of the soil in 17 stations (green dots) for diverse environments of Tundra and taiga (Figure 1).
Figure 1: Map of Data Loggers Location in Umiujaq, Nunavik, Quebec Source: GeoGratis Adapted (http://geogratis.cgdi.gc.ca/)
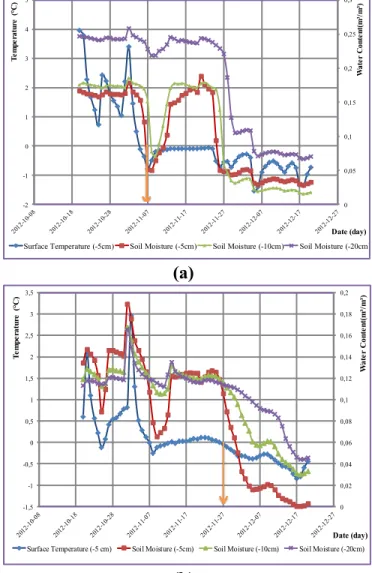
According to field data measurements and SMOS observations, the freezing and thawing dates vary locally with the vegetation cover (type and height), the soil texture (sand, humus) and the relief of the land (flat, slope). Figure 2 shows the daily soil temperature and soil water content variation between lichen Tundra and lichen Open Forest in fall 2012. The soil freezing began on November 7th (recorded by sensor Hum1) in the valley near Umiujaq where land-cover was mainly bare. However it begins on November 27th at Clear Water Lake region (recorded by sensor Hum18) associated with a land-cover of lichen Open Forest. Field observations, in accordance with data gathered from in-situ stations shows that F/T dates vary spatially at
the local scale in the Tundra. Thus, field validation of the F/T state maps at the regional scale is of great importance. Lakes and ponds coverage will also affect the brightness temperature of SMOS pixels.
0 0,05 0,1 0,15 0,2 0,25 0,3 -2 -1 0 1 2 3 4 5 W at er C on te nt (m ³/ m ³) T em pe rat ur e ( C) Date (day) Surface Temperature (-5cm) Soil Moisture (-5cm) Soil Moisture (-10cm) Soil Moisture (-20cm)
(a)
0 0,02 0,04 0,06 0,08 0,1 0,12 0,14 0,16 0,18 0,2 -1,5 -1 -0,5 0 0,5 1 1,5 2 2,5 3 3,5 W at er C on te nt (m ³/ m ³) T em pe rat ur e ( C) Date (day) Surface Temperature (-5 cm) Soil Moisture (-5cm) Soil Moisture (-10cm) Soil Moisture (-20cm)(b)
Figure 2: Soil data recorded in (a) Lichen Tundra (b) Lichen Open Forest Ts (°C) in -5 cm (blue line), Water content (m3/m3) in -5, -10, and -20 cm (red line, green line, and violet line)
3. METHODS
Different passive microwave algorithms were studied in particular the approach proposed of Kim et al. [6] that used Brightness Temperature (Tb) from the Special Sensor Microwave Imager (SSM/I). The following equations are employed:
(1)
Up to now, the pre-processing stages were carried out in order to extract the brightness temperature of the SMOS data set; the extracted values were recorded at 40 degree incident angle as SMAP. The output is a dimensionless DEM binary state variable designated by zero (0) for frozen and one (1) for non-frozen conditions for each pixel. Also, both emissivity and brightness temperature [7, 8] were tested. The emissivity derived from the brightness temperature normalized by air and atmosphere. This coefficient correlated better with the weather and the sparse vegetation.
As it was mentioned above, Kim et al. developed their algorithm based on SSM/I data. Here, to verify the applicability of the algorithm for monitoring of seasonal soil freezing using SMOS images (L band), results were compared with in-situ data obtained from 17 registering stations.
SMOS F/T maps are composed of binary (0 = T and 1 = F) and no data (ND) entries which can be regarded as one of the most sever drawbacks of the maps. A total number of 18 days out of 63 have ND entry that imposes an obvious error in the estimation. Comparing these F/T maps with in-situ data (Ts < 0 regarded as soil frozen, F) yields the so-called
Agreement Factor calculated.
5. EXPECTED RESULTS
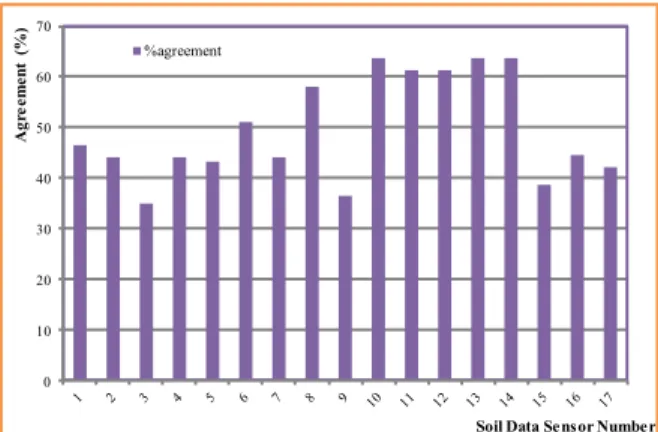
Figure 3 represents the agreement factor histogram extracted for the duration of 63 days (October 20th to December 20th
2012) for each registration station. However, as it can be informed from the diagram, agreement factor varies between 36 and 64 % which is not acceptable.
L band measurements have more effectiveness than higher frequencies in F/T estimation as they are less affected by the surface roughness, the dry snowpack and they more readily reach the underlying soil, thus providing more information on the freeze–thaw state of the soil beneath a snowpack [9]. Then, the low agreement factor between SMOS derived map and the in-situ data could be related to lack of data on soil type as well as vegetation type. By introducing corresponding factors of these parameters in the algorithm as well as the areas covered by lakes and ponds in a given SMOS pixel, it is believed that more realistic estimations can be obtained. 0 10 20 30 40 50 60 70 A gr ee m en t (%)
Soil Data Sensor Number %agreement
Figure3: agreement factor histogram extracted for the duration of 63 days (October 20th to December 20th 2012) for each registration station.
6. CONCLUSION
Agreement Factor derived from comparison of SMOS FT maps with daily in-situ data shows low values which does not seems to be acceptable. New parameters such as lakes and ponds areas within a given pixel, as well as the mean vegetation type and height present on surface have to be introduced in the algorithm to obtain more realistic estimations.
7. REFERENCES
[1] C. Lagacé, M. Bernier, and Y. Gauthier, "Cartographie du gel saisonnier du sol en zone de taYga h partir d'images RSO de RADARSAT-1 et SSM/I de DMSP F-8," Télédétection vol. 2, pp. 161-175, 2002.
[2] N. V. Smith, S. S. Saatchi, and J. T. Randerson, "Trends in high northern latitude soil freeze and thaw cycles from 1988 to 2002," Journal of
Geophysical Research: Atmospheres (1984–2012),
vol. 109, 2004.
[3] S. Frolking, M. L. Goulden, S. C. Wofsy, S. M. Fan, D. J. Sutton, J. W. Munger, et al., "Modelling temporal variability in the carbon balance of a spruce/moss Boreal forest," Global Change
Biology, vol. 2, pp. 343-366, 1996.
[4] J. Randerson, C. Field, I. Fung, and P. Tans, "Increases in early season ecosystem uptake explain recent changes in the seasonal cycle of atmospheric CO2 at high northern latitudes,"
Geophysical Research Letters, vol. 26, pp.
2765-2768, 1999.
[5] K. C. McDonald, J. S. Kimball, E. Njoku, R. Zimmermann, and M. Zhao, "Variability in
Springtime Thaw in the Terrestrial High Latitudes: Monitoring a Major Control on the Biospheric Assimilation of Atmospheric CO2 with Spaceborne Microwave Remote Sensing," Earth Interactions, vol. 8, pp. 1-23, 2004/12/01 2004.
[6] Y. Kim, J. S. Kimball, K. C. McDonald, and J. Glassy, "Developing a global data record of daily landscape freeze/thaw status using satellite passive microwave remote sensing," Geoscience and
Remote Sensing, IEEE Transactions on, vol. 49,
pp. 949-960, 2011.
[7] A. Royer, K. Goïta, J. Kohn, and D. De Sève, "Monitoring dry, wet, and no-snow conditions from microwave satellite observations," IEEE
Geoscience and Remote Sensing Letters, vol. 7, pp.
670-674, 2010.
[8] P. Kalantari, M. Bernier, and J. Poulin, "Utilisation conjointe de données de micro-ondes passives et actives pour le suivi du gel saisonnier du sol de la toundra dans le Nord du Québec.," presented at the 30ième Symposium canadien de télédétection, Lethbridge, Alberta, 2009.
[9] S. M. Bateni, C. Huang, S. A. Margulis, E. Podest, and K. McDonald, "Feasibility of Characterizing Snowpack and the Freeze-Thaw State of Underlying Soil Using Multifrequency Active/Passive Microwave Data," IEEE Transaction on Geoscience and Remote Sensing
vol. 51 N.7, p. 16, 2013.