Construction ?
Preliminary - July 2015
Guillaume Chapelle (Sciences po - LIEPP)
Abstract
Social Housing is one of the main policy tool used on the French Housing Market.
Social housing is sometimes presented as a way to boost the supply of housing but a stream of the economic literature also suggests that it might also crowd out private construction. In this paper, we test the existence of a crowding out effect between 1999 and 2010 at different geographic levels. Our results suggest that a crowding out effect might have occured over our period of study : one subsidized unit could prevent about 1 private unit to be built.
Keywords: Housing Supply and Markets (R31), Public Policy (L38 ), Crowding Out, Subsidized Housing
∗This work is supported by a public grant overseen by the French National Research Agency (ANR) as part of the “Investissements d’Avenir” program LIEPP (ANR-11-LABX-0091, ANR- 11-IDEX-0005-02). I thank E. Wasmer , A. Goujard, PH. Bono, O. Bonnet . QA Do and Participants of Sciences Po’s economic department and LIEPP seminar for their helpful com- ments. All errors remain mine.
1
1 Introduction 2
1 Introduction
Housing programs for low income households are an important concern for both policy makers and scholars. One particular reason for this interest results from the fact that housing is usually perceived as a merit good. In other words, scholars usually consider that a suboptimal consumption of housing may have negative externalities for both the society and the poors (Whitehead : 2008).
This perception is supported by some empirical papers suggesting that under- consumption of housing may have a negative impact on health (Rauh et al : 2008) or on children’s schooling outcome (Goux et Maurin : 2005). Among many different types of programs, subsidized housing appear to be one of the most important and usually pursue several goals as :
• to offer affordable housing for low income tenants
• to allow poor households to access better neighborhoods
• to increase the construction of new housing units boosting local economic activity
• to regulate the private market
Housing programs usually distinguish Supply Side Subsidies (subsidized housing units or loans) and Demand Side Subsidies (allowances or vouchers). Scholars have been trying to disentangle which type of subsidy is the most efficient (Apgar : 1990). It thus appears that part of the answer relies on our knowledge of the impact of such programs on the housing market. For example, several papers pointed that Housing Benefits could generate an important deadweight loss given that such programs have an inflationist impact in the private sector (Fack : 2005; Grislain Letrémy and Trévien : 2014) while other studies suggest that subsidized units are more costly than vouchers (Deng : 2005). This paper aims to deepen our understanding of the relationship between the public (non profit) and the private sector in a period of sharp house price growth. As pointed in Cook et al (2007), the assessment of the overall benefits of place based programs depends on its impact on local economic activity. As a consequence, the existence of a public displacement of private construction (Di Pasquale and Wheaton : 1995) might reduce dramatically the benefits of such projects. This point appears of particular importance since subsidies to the sector represents 0.9% of the French GDP of wich 60% are supply side subsidies. We thus try to assess the impact of social housing on construction testing whether social housing crowds out private construction. =
In this paper, we review the litterature trying to distinguish the different types of subsidized housing programs and the state of our knowledge about their impact. We then test whether social housing project crowds out private construction. Our findings suggest the existence of an important and robust crowding out effect : 1 additional social housing unit seems likely to displace between .8 and 1.5 private housing unit. This suggests that social housing shouldn’t systematically be considered as a way to increase the housing stock.
We finally investigate the channels through which social housing might affect private construction. Two main hypothesis are indirectly tested : competition for lands and for tenants. Stylized facts suggest the existence of an increasing competition for land and building capacities over the last decades since con- struction costs and land prices have been steadily increasing. Supposing that competition for land will prevail in tight area whereas competition for tenants will be stronger in loose area we compare the point estimates in different sus- bamples. Results suggest that both channels seem possible. As a consequence building social housing on public land and restricting the number of potential tenants for social housing units could be two interesting leverage to reduce the strength of this effect.
In the next section we briefly review the main arguments developed in the controversy comparing supply side with demand side subsidies before reviewing the literature assessing the impact of the French Social housing sector. We then define the crowding out effect on the housing market and review the previous study of this phenomenon. Section 3 presents our data and empirical strategy.
Our main results are presented in section 4 whereas section 5 discuss the het- erogeneity in the effect and draw some policy implications. Section 6 concludes.
2 Housing Policies and Market Mechanisms in France 2.1 The Impact Supply Side and Demand Side Subsidies
varies according to the supply elasticities
There has been an important controversy on the kind of subsidies to use in order to improve the access of low income households to housing. Apgar’s (1990) paper summarizes the pros and cons for each type of subsidy. We can notice that theoretically every potential benefits can be associated with a drawback likely to remove its interest. Part of the benefits of such subsidies might depend on the way programs are calibrated and on the supply elasticity.
As far as allowances and vouchers are concerned, one of their major ad- vantage would be to allow households to find the place that better fit their needs reducing their rent to income ratio. However, some scholars suggested that households could dedicate their surplus of revenue to other goods and thus wouldn’t increase their housing consumption reducing the benefits of such a system. In addition, there is also a debate on the impact of allowances on household’s rent to income ratio. On the one hand, some theorists suggest that allowances may be captured by landlords leading to an increase in rent prices (Fack : 2005). On the other hand, some authors suggest that this effect might only happen on the short run since this increase in rent level should boost the supply (Apgar : 1990). Empirical papers usually suggest that allowances do increase the rent level even in the long run (Fack : 2005; Grislain Letrémy &
Trévien : 2014). It is worth noting that the magnitude of the effect varies widely between the US and France. This might be due the fact that supply elasticity is much lower in France (OECD : 2011).In support to this view, Eriksen and
2 Housing Policies and Market Mechanisms in France 4
Ross (2014) showed that the inflationary impact is much stronger in relatively supply inelastic US cities.
Subsidized units are built thanks to special loans and building subsidies on public land and are usually managed by non profit organization.These features should allow low income households to access to cheaper units offering a higher quality than what they could afford on the private market. However the counter argument usually invoked arises from the belief that subsidies are likely to gen- erate inefficiencies driving up the construction costs. One additional advantage is that such programs should allow to control that households consume the ap- propriate amount of housing. However, social housing is often a scarce resource generating long waiting lists. Furthermore, social housing units may also be associated with spatial segregation leading to a concentration of low income households in the same neighborhood (Curie & Yelowitz : 2000). Another argu- ment for such a program is that subsidized constructions could allow to increase the housing stock increasing the supply and driving rent prices down (Kemeny : 1995). However, Eriksen & Rosenthal (2010). suggested that if the supply elasticity is low, the private sector could adapt its supply generating a crowding out effect.
As we can see, housing efficiently the urban poor appears to remain an important puzzle for policymakers and scholars. The impact of both types of policies may vary according to the state of the housing market and the way programs are calibrated. We thus think that providing additional empirical evidence on the topic could improve our understanding of the mechanisms at stake.
2.2 The Impact of Project Based Subsidies in France
2.2.1 Social housing units are not systematically allocated the poorest households
The Main Subsidized sector opens the unit to a wide range of households We identified two main ways to subsidize housing units : Income Tax Credit and Subsidies to Non Profit Housing associations. While many of european coun- tries1support a relatively large non profit or public sector, the most important US program (LIHTC) relies on private investors receiving an income tax credit.
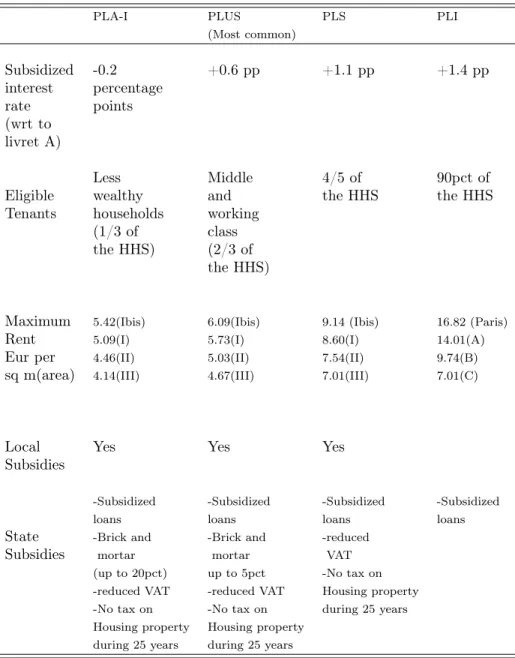
As far as France is concerned both systems exist. On the one hand we can find successive systems of income tax credits2 in which landlords commit to rent their unit to relatively low income tenants respecting a rent ceiling. On the other hand, there exists about 800 non-profit social landlords managing about 15% of the housing stock. These landlords benefit from grants, tax exemptions and subsidized loans to develop new housing units. In exchange of these specific conditions, the units are submited to a rent control and tenants should respect an income ceiling when entering the unit. Each type of loan is associated with different rent and income ceiling as illustrated in Table 1.
1France, UK, The Netherland, Austria
2Méhaignerie, Périssol, Besson, Robien, Borloo, Scellier, Duflot
PLA-I PLUS PLS PLI (Most common)
Subsidized -0.2 +0.6 pp +1.1 pp +1.4 pp
interest percentage
rate points
(wrt to livret A)
Less Middle 4/5 of 90pct of
Eligible wealthy and the HHS the HHS
Tenants households working
(1/3 of class
the HHS) (2/3 of the HHS)
Maximum 5.42(Ibis) 6.09(Ibis) 9.14 (Ibis) 16.82 (Paris)
Rent 5.09(I) 5.73(I) 8.60(I) 14.01(A)
Eur per 4.46(II) 5.03(II) 7.54(II) 9.74(B)
sq m(area) 4.14(III) 4.67(III) 7.01(III) 7.01(C)
Local Yes Yes Yes
Subsidies
-Subsidized -Subsidized -Subsidized -Subsidized
loans loans loans loans
State -Brick and -Brick and -reduced
Subsidies mortar mortar VAT
(up to 20pct) up to 5pct -No tax on -reduced VAT -reduced VAT Housing property -No tax on -No tax on during 25 years Housing property Housing property
during 25 years during 25 years
Tab. 1: Different Types of social housing in France
In the US all HUD’s programs cover less than 5% of the households. If there exists also a system of public housing managed by non-profit landlord (Housing Agencies); most new developments are made through the Low Income Housing Tax Credit program. In this program projects combine funds from public subsidies and from private investors in exchange of an income tax credit.
As a consequence, this system is in between both French System.
2 Housing Policies and Market Mechanisms in France 6
One other major difference between the French and the US arises from the income limit of the tenant. In the US, the income limit is much lower since tenants should have an income at maximum 80% of the median income income of their area but part of the units should be occupied by poorer people. In France, up to 60% of the households is eligible to the most common type of housing unit (PLUS) whereas this figure can raise up to 80% for some specific units.
In addition, while LIHTC units are allocated by Local Housing Authorities, in France, one third of social housing units of each projects are allocated to the central state whose local representative propose potential tenants to the landlords’ assignment commission. The remaining units are shared between the social landlord, the local entities and employers’ representative who contribute to finance the project Each entity proposes their tenants to the assignment commission. It is worth noting that tenants are required to respect the income ceiling when they enter the unit, they cannot lose the benefit of their unit once they turn richer. If some landlords developed some objective systems in order to rank tenants, the way units are allocated is usually considered as a black box (Bourgeois : 2013).
The sector presents an increasing share of poor tenants In a recent contri- bution, Loic Aubree (Aubree : 2006) tries to highlight the main trends in the social housing population. He reminds the fact that social housing was firstly designed to receive people from the medium and higher class. However, the upper quartile who represented 60% of the social housing inhabitants in 1973 became less and less present in this type of dwellings, in 1996 their joint share was around 35% with the highest quartile experimenting the larger drop (from 24% to 9.5%). Several phenomena can explain this increasing share of poor in the social sector across time. First, development of housing vouchers com- bined with the progressive destruction of substandard private housing lead an increasing share of the poorest to turn to social housing. Second, higher income households tend to turn to individual housing units which represent only a small part of social housing supply. These Households are also more likely to leave the social sector and buy their house. It is worth noting that tenants both in the free and social sector tend to be poorer while owners are richer. In addition, Aubrée and Josnin, emphasized the fact that the population living in the French Social Housing is aging, the share of people under 34 years old decreased from 67% in 1984 to 52% in 2006. This result comes from the fact that old people are less likely to leave the social housing sector whereas the share of new entrants under 34 years old decreased. To summarize the main findings, the population of the social housing sector is aging and getting poorer in particular when compared with owners. .
2.2.2 Social housing seems to fail to cope with spatial segregation
As we already suggested, social housing is perceived as a way to allow low income households to access to better neighborhoods and to increase the social diversity within building. However, Anne Laferrere (2008) noted some spatial
inequalities : within the social sector the poorest and the richest tend to live in different areas and buildings (richer being in the more comfortable ones) in particular in Paris. Her model and empirical analysis conclude that there could be a phenomenon of “filtration” related with the right of security of tenure and the disconnection between the level of income and the rent paid. In other words people who get richer will stay in the social housing sector if their housing unit is of good quality. This is supported by some empirical evidences: the level of income is positively correlated with the time people stay in the same housing unit in the social sector (contrary to the private sector). In a recent paper, L. Gobillon and B. Vignolles (2014) used a law forcing some municipalities to increase their social housing stock as a quasi natural experiment to assess the impact of the law on spatial segregation. The authors found that increasing the number of subsidized units tended to increase spatial segregation within municipalities. For them, this phenomenon could be due to the fact that new units are built close to the existing ones.
2.2.3 Social Housing generates an important subsidy for their tenant Three different papers tried to quantify the impact of Social Housing on house- hold’s consumption. First le Blanc et al (1999) found that having access to a subsidized unit increased respectively by 10% and 11% the consumption of housing and other goods. Furthermore, an administrative report assessed that the implicit subsidy generated by the social housing sector was about 13 Billions of euro (comptes du Logement : 2012). Finally, Trévien (2013) found that ten- ants of the social housing sectors received an implicit subsidies of 261 euros per month and noted that this subsidy was growing with the level of income in line with Laferrere (2008). One consequence of this implicit subsidy is analyzed in Sidibé and Goffette-Nagot (2014) who found that public housing allowed house- holds to access more rapidly to homeownership. Moreover, social housing does not seem to worsen the outcome of their tenant on the labor market (Dujardin and Gofette-Nagot : 2009) even if social housinf tenants suffer from longer un- employment periods that might be related to their lack of mobility (Costes and El Kasmi : 2013).
2.2.4 Urban Land regulation and the existing stock drives the supply of new subsidized units
There exists also a litterature trying to analyze what drives social housing sup- ply. For example, Verdugo (2012) highlights that urban unit fragmentation (measured with the split of the population between administrative units) in- creased the supply of social housing. In addition, such units are persistent across time which contributes to increase its importance within an area in case of bad shocks. As in this study but using a different measure, Verdugo (2015) finds that war destruction contributed to increase tthe importance of social housing within an area.
2 Housing Policies and Market Mechanisms in France 8
Another importance explanation for social housing could be political : Ver- dugo (2012) finds that areas where the main municipality is ruled by a left mayor will have a higher share of social housing. One other important field of study is about the impact of the SRU act of 2001 which forced some municipalities with few social housing units to increase the supply of such units. Both Bono et al (2013) and Gobillon and Vignolles (2014) found a positive impact with a similar order of magnitude. While Bono et al found that the act increased by about 40 units for a city of 20 000 inhabitants on a four year construction cycle, Go- billon and Vignolles found that the Act increased the number of social housing units by 6 percentage points explaining about 50% new starts over the period on their subsample for municipalities having on average 4500 inhabitants which represents proportionnally the same amount. This effect is of particular interest since we will exploit this quasi natural experiment as a robustness check.
2.2.5 Subsidized projects can have different impact on housing prices There exists also several papers investigating the impact of place based project on housing or land prices. Bono et Trannoy (2012) assess the impact of Income Tax Credit program on land prices and found that such programs increased land prices. As far as social housing is concerned two studies assess the impact of social housing on housing prices using transaction data. Goujard (2011) finds that in the 2000s, in Paris, new social housing blocks had a positive impact on House prices within 50m whereas the impact was negative for houses located from 350 to 500m away from the social project (Goujard: 2011). The positive impact may be related with the improvement of public amenities related with these projects in neighborhood with low housing prices. The negative impact may be related with an inflow of low income tenants in richer neighborhoods.
The author tests the latter focusing on conversion of private housing into social units but do not find a significant given the limited variation in the dataset. We can say that social housing may have both positive and negative externalities.
On the one hand, positive externalities are related with the construction of new buildings with better standards than the old real estate and the improvement of public amenities around these types of projects. On the other hand, negative externalities may be related with the progressive concentration of low income tenants in poor neighborhoods that could potentially lead to a loss in social diversity. As in Goujard (2011), Gobillon and Vignolles (2013) found that the SRU act had a negative on housing prices in treated municipalities but this impact turned not significant on the medium run. More recently, Beaubrun Diant and Maury (2015) found that subsidized loans to support homeownership for middle income households had an inflationary but transitory impact on land prices. We aim to contribute to this litterature investigating the empirical link between the supply of private and public housing.
2.3 The crowding out effect of private construction by subsidized housing
2.3.1 Theoretical Framework
In this paper, we try to test whether subsidized housing crowds out private construction. There are several theoretical models trying to predict what could be the relationship between social and private housing. For example, Boulhol (2011) adapts a model of partial rent control and predicts that increasing the share of social housing might drive private rent up. More related with our research question several models predict that competing for tenants or resources;
social housing is likely to displace some private projects reducing its impact on the housing stock and driving private investment away from the housing market.We identified two types of models suggesting that social or subsidized housing may displace private construction.
The first generation of models considers social housing as an exogenous shock affecting the supply (Eriksen& Rosenthal: 2010) or the demand (Di Pasquale &
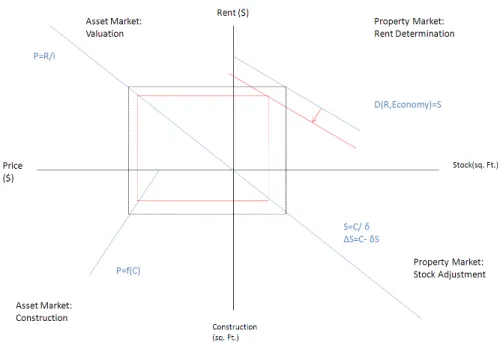
Wheaton: 1995) for housing services. According to Di Pasquale and Wheaton, the construction of publicly owned units could reduce the Demand for privately owned rental units since the public units receive subsidies and are offered below market prices. As a consequence, the demand curve should shift to the left driving down the rent level, the Real Estate Price, the volume of construction and finally the stock (supply) of privately owned real estate as illustrated in figure 1.
2 Housing Policies and Market Mechanisms in France 10
Fig. 1: Public Displacement of Private Construction (Di Pasquale & Wheaton : 1995)
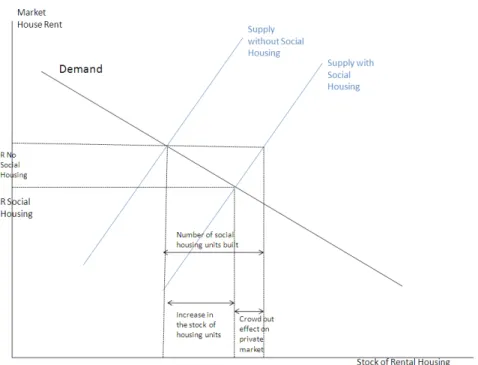
For Eriksen and Rosenthal the impact of social housing on the housing stock may be offset because the demand is not perfectly elastic and the supply not perfectly inelastic. For them, the more inelastic the Demand or the more elastic the Supply, the more important the crowding out effect. Competition for inputs as capital or land or for similar tenants can be a source of displacement driving private investment away from the housing market. Their reasoning is illustrated in Figure 2
The second generation is based on search and matching models (Menard:
2009). S. Menard’s model predicts the impact of social housing on the rental market at the equilibrium. According to his model, an increase in the share of social housing should increase the turnover leading landlords to set higher wages to compensate their losses. When simulating an increase of the number of social housing units from 1 to 5 millions, the total housing stock decreases and then increases suggesting a crowding out effect of 99%. This model predicts that social housing could increase the rent level in the private sector (private investors choose segments where they don’t directly compete with social housing), drive up the turnover in the rental market (the likelihood that the tenants find a cheaper unit increases) and crowd out private projects.
Fig. 2: Crowding Out effect on the Housing Market (Eriksen & Rosenthal : 2010)
2.3.2 Empirical Evidences
We propose to review briefly the existing empirical literature designed to high- light such a phenomenon. Most of this literature test the hypothesis of public displacement of private construction,they usually show that one additional unit of social housing does not increase by 1 unit the housing stock.
The seminal contribution on this topic was made by Craig Swan (Swan:
1973) with the paper “Housing subsidies and housing starts”. In this paper, the author estimated from US data, a system of supply and demand for housing starts and emphasized the fact that competition for mortgage between subsi- dized and unsubsidized housing units led to an important crowding out effect such that for one subsidized unit 0.85 unsubsidized unit was not built. A second paper (Murray: 1983) proposed a structural approach in order to address the same question. As in the paper by Swan, Murray assumed that the real resource supply was perfectly elastic whereas financial resources were scarcer. However, if he accepted that the crowding out effect could occur through competition for mortgage, he acknowledged that subsidized housing units may partly ad- dress a Demand that would be served by the unsubsidized sector. Murray used Two Stage Least Squares to correct for the simultaneity bias. A distinction was made between conventionally financed subsidized units and government fi- nanced subsidized units. On the one hand,he found that conventionally financed subsidized housing units were totally offsetting private construction and thus
2 Housing Policies and Market Mechanisms in France 12
didn’t increase the housing stock. On the other hand, when it was government- financed, the crowding effect through Demand was less important and for one unit built, only 0.27 unsubsidized unit was not built.In 1999, Murray addressed the same issue but using the housing stock as dependent variable. Using US data from 1935 to 1987, he found that subsidized housing for low income house- holds didn’t crowd out unsubsidized one whereas the one for middle income households did.This reduced form approach couldn’t identify the channel of the crowding out effect (mortgage or Demand). Considering that previous estimates by Di Pasquale suggest that the housing supply is elastic, Murray conclude that the crowding out effect is the result of a public displacement of private construc- tion. The author recommendsto subsidze units targeted to the poorest who are not served by the unsubsidized sector.
While these three papers mostly rely on time-series analysis, more recent papers, closer to this one, adopted cross sectional approaches to answer a similar question. Malpezzi and Vandell studied the impact of the Low Income Housing Tax Credit (LIHTC) initiated in 1986. They use Ordinary Least Squares and Two Stage Least Squares regressing the total housing stock per 1000 inhabitants in each State on a set of control variables. The coefficient of the LIHTC stock per 1000 inhabitants should proxy the crowding out effect. However, they didn’t find any significant result. Another paper by Sinai and Waldfogel used a cross section analysis and addressed the issue of the relevant market to observe the crowding out effect using data at the city level (census places) and at the Metropolitan Statistical Area Level3 in the US. They used OLS and 2SLS and found on average that “three government units displace two units that would have been provided by the private market”. This effect seemed to be smaller in more populous markets and when there were fewer social housing units per capita.
Once again, they advocated for more targeted subsidized housing units programs and noted a decreasing marginal effect of social housing. Finally, the most recent paper written by Eriksen and Rosenthal used a cross sectional approach to assess the impact of subsidized units on unsubsidized starts. The authors estimated their models using 2SLS with population share of a zone in the subsidized area or with the votes for the party in power as instrument. They found that almost
“all LIHTC development is offset by crowd out resulting in a corresponding reduction in unsubsidized construction of rental housing units”.
Despite these striking results, it is hard to infer any policy implication for France from these studies. As we already saw, Housing Subsidies programs in France and in the US appear to be really different and so could be their impact.
For example LIHTC’s relative size is much smaller than French social housing (as illustrated in Figure 10). This parameter is of particular importance to assess what is the global impact of such programs for evaluation as Cost Benefit analysis (Cook et al : 2007).
3Designed to encompass an economic Area
2.4 Potential channels for the crowding out effect
Eriksen and Rosenthal emphasized the fact that construction of subsidized hous- ing units was mainly displacing rental housing units rather owner occupied ones.
This observation suggests that the displacement occurs in the rental sector. As we already mentioned, several channels for the displacement effects were sug- gested. As far as France is concerned, the particularities of the system and recent trends may favor some particular channels.
If some scholars suggested that competition for funds might be a source for the crowding out effect, the sector’s credit channel may reduce this risk.
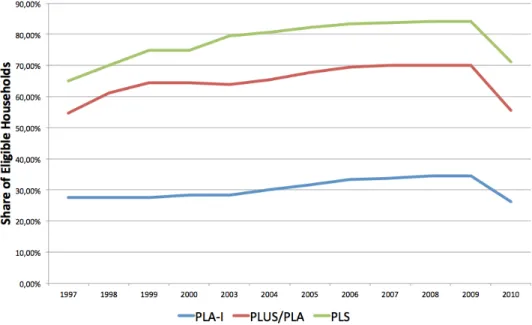
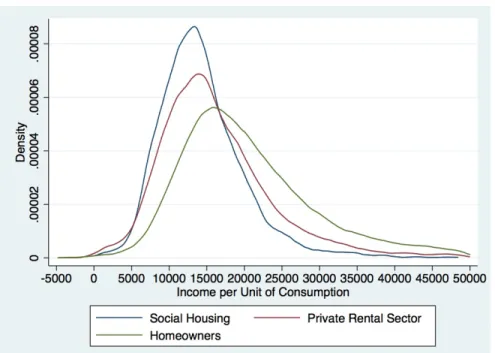
However, since social housing is open to an important share of the households and host a population close to the private rental sector, competition for tenants may drive som private investors away (Figure 3 and 4).
Fig. 3: Share of Households Eligible to social Housing
2 Housing Policies and Market Mechanisms in France 14
Source :INSEE, ERFS, 2005 - Students were removed from the sample.
Fig. 4: Income Distribution by Housing Tenure in 2005
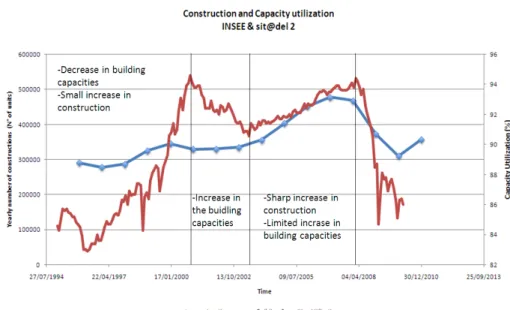
It is worth noting that over the period other phenomena may have con- tributed to increase the crowding out effect.Social housing may have displaced private construction by mobilizing its building capacities whose potential was almost fully exploited over the period (Figure 5). The increase in competition for building capacities may be reflected by the constant increase in construction costs over the period (Figure 6). Finally, the stringency of land use regulation tend to turn land into a scarce resource. We thus might think that competing for land, social housing may also have an adverse effect on private construction.
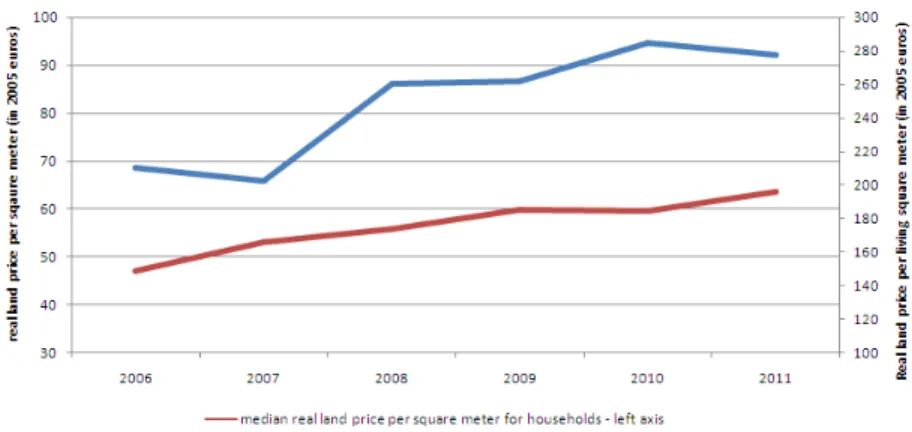
Tensions on the land market are reflected by the increase in land prices over the period (Figure 7).
Fig. 5: Building Capacities Utilization and yearly number of construction (1994- 2013)
Fig. 6: Growth rate in construction costs in Paris and the French Province
3 Data and empirical strategy 16
Fig. 7: Evolution of land prices (2006-2011)
3 Data and empirical strategy 3.1 Data
Our empirical strategy aims to analyze the impact of social housing starts on private construction. To this end, several database can be used. The most important database that we had access to was the sit@del database which is an exhaustive description of all the housing projects built over the period. This dataset allows to cross different information:
• The types of contracting authority (private individual, company, social landlords or municipalities, Private Public partnership) which allows us to distinguish social housing projects from private projects.
• The types of projects (individual units or units in collective buildings).
• The year of construction
Thanks to this data set we could build several aggregate indicators for the number of construction of social and private units at the city level on different periods. It is worth noting that the land reform of 2006 dramatically decrease the quality of this dataset. However, given our period of study the series used were not affected since it stops at the end of 2008 when the effects of the reform were marginal.
In addition, we use the census data of 1999 and 2009 published on the INSEE website in order to collect information on the housing stock and its composition.
The census provides us an exhaustive description for each municipality with
information such as the population, the median income, the share of social housing units or the housing stock. Some information such as median income are provided at broader levels (EPCI or Urban Areas) whereas other are built aggregating information at the municipality level.
There are other database providing information on the social housing stock that we can use as a robustness check. The first one is the Enquête sur le Parc Locatif Social (EPLS) of the ministry of sustainable development which provides information on the number of social housing unit in each city. The second one is the Répertoire du Parc Locatif Social which is an exhaustive census of the social housing stock.
We used also some decree published in legifrance in order to control for the different zone of social housing and of low income housing tax credit (zones scellier).
We also used an indicator provided by Bono et al in order to build our instru- ment identifying SRU municipalities. The data on World War 2 destructions were found in the archives of the Ministry of Finance.
3.2 Empirical Specification
In this paper we try to identify the causal impact of social housing on the private sector dealing with problems of endogeneity and reverse causality. It is worth noting that our research question is relatively close to the problem addressed by Faggio and Overman for the English labor market. As a consequence, we propose to adapt their identification strategy to the housing sector in order to identify the impact of social housing on the private market. In their approach, Faggio and Overman study the contribution of public and private employment to employment growth. Equivalently, we propose to study the contribution of social and private construction to the change in the total housing stock estimating a supply equation close to Eriksen and Rosenthal (2010). We first define the total housing stock at time t (Ht) as the addition of private (Pt) and social housing (St) units:
Ht=St+Pt (1)
As a consequence the proportional change in housing units between period s and t can be expressed as :
Ht−Hs
Hs = Pt−Ps
Hs +St−Ss
Hs (2)
In order to assess the impact of social housing variation on the housing stock we propose to estimate the following equation:
Pt−Ps
Hs
i
=α+β(St−Ss
Hs
)i+γXi+εi (3) Where:
• PtH−Ps
s is the contribution of private construction to the total housing stock
3 Data and empirical strategy 18
• StH−Ss
s is the contribution of social housing construction to the total hous- ing stock
• X is a set of control variables and administrative fixed effect (region or department). We control for the unemployment level, the density the city size at the beginning of the period. The average tax rate over the period and the existence of fiscal incentives. These variables are standard in the litterature trying to estimate to supply function (Di Pasquale & Wheaton : 1995)
• εis the unobserved heterogeneity
If β is negative then each additional unit of social housing would displace |β|
private units.On the other hand, ifβis positive each additional social unit would increase the private housing stock by |β|.
This strategy presents many advantages when compared with our other strategies closer to US studies. First, Faggio&Overman emphasize the fact that contrary to models using the change in the housing stock as dependent variable, this model allows us to test for the causal impact of social housing on the private sector. Furthermore, the “artificial correlation” arising from the fact that social housing construction is in both side of the equation is removed (Faggio&Overman: 2012).
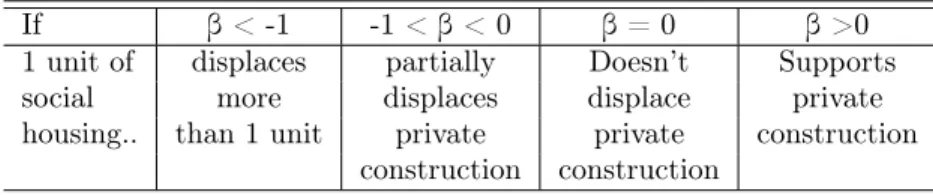
The way we should interpret the results are as follows :
If β < -1 -1 <β< 0 β= 0 β >0 1 unit of displaces partially Doesn’t Supports
social more displaces displace private
housing.. than 1 unit private private construction construction construction
Tab. 2: Interpretation of the coefficients
3.3 Extension to two periods
We propose to extend our models to two periods thanks to a Fixed Effect regres- sion. Using the data on stock variation for the period between1990 and 1999 we can thus control for invariant unobserved heterogeneity constant over time.Our specification would be the same adding a trend and a fixed effect for each unit of observation.
Pt−Ps Hs
pi
=α+β(St−Ss Hs
)pi+γXpi+δp+θi+εit (4) Where p is the period and can be 1990-1999 or 1999-2009. We estimate this Fixed Effect model thanks to Ordinary Least Squares and 2 Stage Least Squares Estimators using the share of social housing as instruments since the trend is controlled with time fixed effect.
3.4 Units of observation
Part of the literature insists on the importance of identifying the appropriate level of observation in order to grasp a potential crowding out effect. To address this question we decided to adopt three different levels of observation likely to represent potential markets where the crowding out effect might occur.
• The first level of observation is the municipality, the smallest administra- tive level in France with an elected council. Many decisions in terms of housing policies are taken at this level and a neighborhood quality can often be associated with the name of the municipality. However, there are many municipalities in France and a continuous urban area may be composed of several municipalities which might form a broader and more relevant market. In addition, municipalities have progressively delegated part of their power to EPCIs which are association of municipalities with fiscal instruments that were built in order to realize economies of scale implementing public policies. There are more than 36 000 municipalities in France.
• The second level of observation is the EPCI that groups many municipal- ities. This second administrative level might be interesting because it is also a level of decision in terms of public policies. However, these groups of municipalities may cover very different situation: in rural areas these groups might cover large and discontinuous areas whereas one dense and populous urban area as Paris might cover several EPCIs. We took the 2400 EPCIs registered in 1999.
• Finally we adopt a broader statistical unit of observation built by the French Statistical Agency (INSEE) in 2010: the urban areas. These pure statistical entities are made of continuous agglomeration with more than 10 000 employments and at least 40% of their workers living inside the area. To reproduce our variables at different level we mostly aggregate the municipality level data (public and private construction, number of housing units).
We test our models at three different levels as municipalities, EPCI and urban areas in order to check whether social housing projects don’t simply lead the private sector to implement its projects in adjacent areas.
3 Data and empirical strategy 20
3.5 Endogeneity issues
Endogeneity may arise for two reasons: on the one hand social housing may be built in order to compensate a lack of private construction (implying a negative bias); on the other hand social housing and private housing may respond to similar incentives (suggesting a positive bias). This correlation between private and public construction due to unobserved heterogeneity appears to be really strong and positive as suggested by our naive regression in table 4. We propose to use the “shift-share” approach as proposed by Faggio & Overman after Bar- tik (1992) , Card (2007) and Moretti (2010).We combine the French trend in social housing construction with the initial share of social housing in the unit of observation. Formally, our instrument is built following this equation:
Shif t Sharei= Si,s
Hi,s
×StF rance−SsF rance
SsF rance (5)
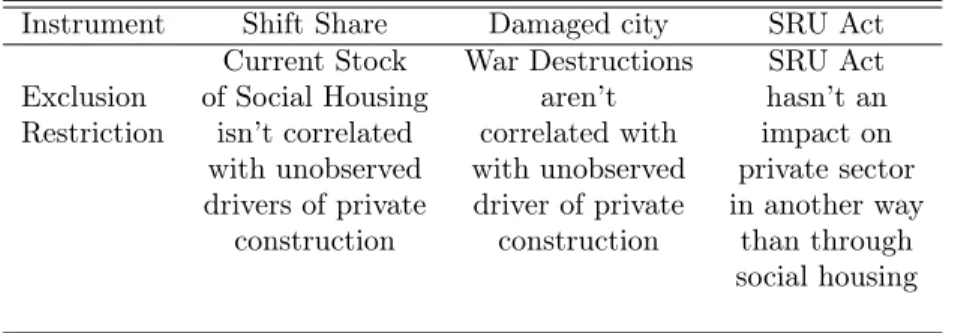
The second part of the equation varies because the national trend is com- puted for each observation by excluding local construction. The exclusion re- striction implies that the share of social housing at the beginning of the period shouldn’t be related with the unobserved incentives for private construction.
This exclusion restriction could be violated if the share of social housing implies some unobserved features driving private investors away from these cities. How- ever, one might think that at broader scale (for example at the ECPI level), the exclusion restriction is more likely to be fulfilled since such phenomena linked with social housing (as criminality or bad neighborhood quality) are more likely to create spatial segregation rather than driving private investors away.
As pointed by Verdugo (2011), it seems that the trend in social housing development is mostly path depedent: the stock determines future development.
One interesting idea might be to explain what could have determined this trend in the past. One possible explanation could be that cities might have built more social housing units where the need for new houses were the most important during the 50s and 60s. The deficit of housing units at that time could have been connected with the destructions during the Second World War. To test this hypothesis we collected data to build two instruments. The first one is a dummy variable indicating whether the city was officially recognized as “damaged” after the second world war.
Damaged M unicipalityi = 1{damaged(i)=1} (6) As we mentioned earlier, there is also a new stream of literature analyzing the impact on the recent law forcing the municipalities with more than 3500 inhabitants in urban areas with more than 50 000 inhabitants to comply with their obligation to increase their share of social housing up to 20%. Even if Bono et al pointed the fact its impact was quite limited (40 units for a city of 20 000 inhabitants), we can still use the exogenous variation due to the SRU act as an identification stragey. The exclusion restriction implies that the criteria of the law shouldn’t be connected with unobserved incentives for private housing.
As a matter of fact, since cities that don’t comply with the law have usually a lower rate of social housing, we can think that the socioeconomic composition of these cities shouldn’t deter private investors.We thus propose to use a dummy indicating whether the city was submited or not to the SRU act and had to commit to increase the number of social housing units.
SRUi= 1SRU(i)=1 (7)
Instrument Shift Share Damaged city SRU Act Current Stock War Destructions SRU Act Exclusion of Social Housing aren’t hasn’t an Restriction isn’t correlated correlated with impact on
with unobserved with unobserved private sector drivers of private driver of private in another way
construction construction than through social housing
Tab. 3: Exclusion restrictions
3.6 Robustness check using a quasi natural experiment
We adapt the identification strategy of L. Gobillon and B. Vignolles (2013) to test whether the SRU Act had a negative impact on private construction. In their specification they exploit a discontinuity in the application of the law due to a population threshold of the urban unit. The authors select a subsample of municipalities with common features to assess the impact of the law as illus- trated in Figure 16 and 17. We use the yearly construction series and apply a difference in difference methodology as follows :
Yti=α+β1{t>2002}1{SRU(i)=1}+
T
X
k=1
δk1{t=k]+
R
X
j=1 T
X
k=1
γk,j1{t=k]1{r(i)=j}+θi+εit
Where Y represents the yearly private construction, we thus assess the im-(8) pact on construction and not housing stock variation,β measures the impact of SRU law, we control with time fixed effect and allow for trend difference across regions (ie we control for regional shocks). We estimate this specification using Fixed Effect regressions.
4 Results 22
4 Results
4.1 Municipalities
Table 2 presents the results of our main specification, the sample contains all French municipalities. All the variables have the expected sign. For example, in both our OLS and IV specifications, both density and the share of empty units reduce the number of housing units built. This result is quite intuitive since one can think than an important number of empty units should drive private investors away and high density implies scarcity of land to build new units. The number of units is increasing with median income whereas average land taxes on the period points toward a negative impact but is not significant in the IV specification. The variable of interest( the contribution of social housing to the housing stock) changes sign between both specification suggesting a positive bias : its impact is positive and significant in the OLS specification whereas it is negative and significant in the IV specification. We may thus think that both private and social housing are affected by similar unobserved market incentives.
In Table 3, We perform some robustness checks. The two first columns repro- duce the IV and OLS estimates of our favorite specification. The third one use an alternate instrument which is a dummy indicating whether the municipality was strongly damaged during the second World War. Finally a third instrument is used in the last column : a dummy indicating whether the city was submitted to the SRU act. Both alternate instruments tend to confirm our findings. Even if their precision is decreasing, they still suggest that public housing may have a negative impact on social housing.
We also test for the heterogeneity among city with positive population growth and these with negative population growth. As expected in cities with negative growth, the crowding out effect vanishes. In table 7, using L. Gobillon and B. Vignolles identification strategy on their adjusted subsample of munic- ipalities, we also found that SRU law had a positive impact on public housing production and a negative impact on private construction. The SRU experiment is of particular importance since it relies on the opposite opposite mechanism as with our previous instruments : here construction is driven by municipalities with proportionnally less social housing units.
Finally, we extend our model to a panel framework using two periods and reproducing our identification strategy with the first instrument which can be computed for both periods. Table 6 shows that even controlling for unobserved time invariant heterogeneity our identification strategy still suggests an im- portant crowding out effect of similar size as in our previous estimates. This additional result strengthens our confidence in the existence of a crowding out effect since we may think that unobserved reputation of a neighborhood should be partially captured by fixed effects.
One puzzle is to explain why some specifications yields a crowding out effect higher than one. Our main interpretation would be that a city with a dynamic housing sector would also capture the effect of the projects in adjacent cities or the fact that part of private projects are relocated in adjacent areas where
public construction didn’t take place : new private investors being reluctant to develop new project next to new social housing unit. Adopting larger units of observation closer to the relevant market should thus reduce the estimates of the crowding out effect. This is mostly what we observe using EPCIs and Urban Areas.
OLS IV OLS IV OLS IV
Private Housing Private Housing Private Housing Private Housing Private Housing Private Housing
Social Housing 1.110∗∗∗ -1.894∗∗∗ 1.039∗∗∗ -1.108∗∗∗ 1.070∗∗∗ -1.604∗∗∗
(0.120) (0.162) (0.125) (0.163) (0.126) (0.219)
Population -0.000000169 -9.79e-08 -0.000000141 -0.000000123
(0.000000106) (6.65e-08) (9.14e-08) (8.10e-08)
Density -0.0000106∗∗∗ -0.00000585∗∗∗ -0.00000983∗∗∗ -0.00000799∗∗∗
(0.00000136) (0.00000104) (0.00000136) (0.00000127)
Empty Units -0.415∗∗∗ -0.488∗∗∗ -0.429∗∗∗ -0.506∗∗∗
(0.0335) (0.0359) (0.0328) (0.0354)
Median Income 0.00000862∗∗∗ 0.00000873∗∗∗ 0.00000946∗∗∗ 0.00000859∗∗∗
(0.000000350) (0.000000384) (0.000000345) (0.000000393)
Land Tax -0.00000345 0.0000154
(0.0000477) (0.0000543)
Housing Tax -0.000965∗∗∗ -0.00000147
(0.000199) (0.000255)
Property Tax 0.00191∗∗∗ 0.00237∗∗∗
(0.000305) (0.000348)
dzscellier2 0.0243 0.0310
(0.0155) (0.0184)
dzscellier3 0 0.0569∗∗∗
(0) (0.0146)
dzscellier4 -0.0398∗∗∗ -0.0138∗∗
(0.00399) (0.00498)
dzscellier5 -0.0245∗∗∗ -0.0107∗∗∗
(0.00251) (0.00291)
_cons 0.0119∗∗∗ 0.0348∗∗∗ 0.112∗ 0.0558∗∗∗ 0.0346 0.0229
(0.00170) (0.00385) (0.0443) (0.0145) (0.0430) (0.0416)
N 36303 36192 30499 30499 30493 30493
adj.R2 0.128 . 0.208 0.084 0.214 0.028
Dep Fixed Effects Yes Yes yes Yes Yes Yes
Instrument No Shift Share No Shift Share No Shift Share
F-test (864.37) (727) (445.6)
Robust Standard errors in parentheses
∗p <0.05,∗∗p <0.01,∗∗∗p <0.001
Tab. 4: Impact of Social Housing on Private Construction at the Municipality Level
4 Results 24
OLS IV IV IV
var_priv var_priv var_priv var_priv
Social Housing 1.070∗∗∗ -1.604∗∗∗ -3.009∗ -2.364∗∗
(0.125) (0.219) (1.138) (0.826)
Density -0.00000983∗∗∗ -0.00000799∗∗∗ -0.00000716∗∗∗ -0.00000747∗∗∗
(0.00000136) (0.00000127) (0.00000199) (0.00000138) Population -0.000000141 -0.000000123 -0.000000116 -0.000000118 (9.13e-08) (8.10e-08) (8.00e-08) (7.83e-08) Empty Units -0.429∗∗∗ -0.506∗∗∗ -0.545∗∗∗ -0.528∗∗∗
(0.0328) (0.0354) (0.0750) (0.0441)
Median Income 0.00000946∗∗∗ 0.00000859∗∗∗ 0.00000807∗∗∗ 0.00000834∗∗∗
(0.000000345) (0.000000393) (0.000000526) (0.000000494) Housing Tax -0.000965∗∗∗ -0.00000147 0.000481 0.000273
(0.000198) (0.000255) (0.000678) (0.000371)
Land Tax -0.00000345 0.0000154 0.0000248 0.0000207
(0.0000476) (0.0000543) (0.0000632) (0.0000583) Property Tax 0.00191∗∗∗ 0.00237∗∗∗ 0.00262∗∗∗ 0.00251∗∗∗
(0.000304) (0.000348) (0.000527) (0.000417)
_cons 0.0346 0.0229 0.112∗∗∗ 0.0195
(0.0429) (0.0416) (0.0288) (0.0419)
Fiscal Incentives yes yes yes yes
Dep Fixed Effects yes yes yes yes
Instrument No Shift Share War Destruction SRU
F-test (445.6) (29.3) (68.1)
N 30493 30493 30493 30493
adj.R2 0.214 0.028 . .
Standard errors in parentheses
∗p <0.05,∗∗p <0.01,∗∗∗p <0.001
Tab. 5: Robustness Checks with alternate Instruments
Fixed Effect Regression Fixed Effect with IV Private Housing Private Housing
Social Housing 0.677∗∗ -1.712∗∗∗
(0.221) (0.280)
Population -0.0000140∗∗ -0.0000215∗∗∗
(0.00000507) (0.00000556)
Density -0.000219∗∗∗ -0.000373∗∗∗
(0.0000550) (0.0000630)
99-09 0.0961∗∗∗ 0.0997∗∗∗
(0.00127) (0.00108)
_cons 0.105∗∗∗
(0.00849)
N 72505 72332
adj. R2 0.270 -0.746
Instrument No Instr1
F-stat (169.8)
Standard errors in parentheses
∗p <0.05,∗∗p <0.01,∗∗∗p <0.001
Tab. 6: Fixed Effect regressions at the municipality level
(1) (2) (3)
ln(Pub Construction) ln(Pub Construction) ln(constr priv)
SRU 0.165∗∗∗ 0.0656∗ -0.143∗∗∗
(5.98) (2.31) (-7.53)
Constant 0.451∗∗∗ 0.623∗∗∗ 2.421∗∗∗
(20.65) (27.94) (161.82)
Region x year yes yes yes
Fixed Effect Municipality Municipality Municipality
Observations 2262 2262 2262
Source RPLS sitadel2 sitadel2
R2 0.0207 0.0231 0.1401
tstatistics in parentheses
∗p <0.05,∗∗p <0.01,∗∗∗p <0.001
Sample of L. Gobillon et B. Vignolles (2014) - Municipalities between 800 and 6000 in Ile de France and between 2 800 and 12 000 otherwise. The treatment group is adjusted to be similar to Bono et al (2013).
Tab. 7: Impact of SRU law on Private and Social Housing Construction
4 Results 26
4.2 Group of municipalities (EPCI)
As we already mentioned, one important issue in the literature is to identify what is the relevant scale where the crowding out effect can take place. We thus decided to test our model at broader level than municipalities. In this part we present the results of our panel and cross section estimates. We can see that our previous results remain robust for broader area : the two first columns in table 5 shows that the OLS estimates still suggest a positive impact of public housing on private construction whereas the estimate turns negative and significant at the 10% level when adopting an instrumental strategy. The magnitude of the crowding out effect remains the same even if smaller : 1 additional unit crowds out about 1 unit of private housing. In addition, fixed effect estimates with two periods suggest similar results as in the case of municipalities : the effect turns negative and suggests a crowding out effect of one private unit not built per additional social housing unit and is significant at the 99% level. .
These results suggest that the crowding out effect suggested in the previous part is not simply due to the fact that social housing drives private projects in adjacent cities but really reduces the number of private projects in the whole area.
OLS IV Fixed effect Fixed effect with IV
Private Housing Private Housing Private Housing Private Housing
Social Housing 2.317∗∗∗ -1.055∗ 0.322 -0.921∗∗∗
(0.702) (0.466) (0.172) (0.147)
density -0.00000184 0.00000487∗ (0.00000271) (0.00000232)
Population -0.000000125∗∗∗ -4.64e-08∗ -0.00000315∗∗∗ -0.00000419∗∗∗
(3.78e-08) (1.93e-08) (0.000000796) (0.000000651) Unemployment -0.00600∗∗∗ -0.00546∗∗∗
(0.000835) (0.000977)
Empty Units -0.775∗∗∗ -0.964∗∗∗ -0.816∗∗∗ -1.170∗∗∗
(0.168) (0.199) (0.117) (0.0914)
99-09 0.0793∗∗∗ 0.0668∗∗∗
(0.00237) (0.00181)
_cons 0.383∗∗∗ 0.206∗∗∗ 0.150∗∗∗
(0.0424) (0.0247) (0.0109)
Fixed Effects Dep Dep epci epci
Instrument No Instr1 No Instr1
F-stat No (159.06) No (2775.6)
N 2317 2300 4899 4636
adj.R2 0.471 0.292 0.651 0.186
Robust Standard errors in parentheses
∗p <0.05,∗∗p <0.01,∗∗∗p <0.001
Tab. 8: Impact of social housing on Private Housing construction at the EPCI level
4.3 Urban Areas
Finally, we turn to the broadest unit of observation : Urban Areas. Equivalently, our results remain robust with both models and present similar patterns as our previous estimates. The two first columns present the results for the one period
model, we can notice that the OLS regression still suggest a positive impact of social housing on private construction whereas the impact turns negative when controlling for a potential endogeneity bias. The crowding out effect at this level appears to be greater than in the previous estimates and is still significant at the 95% level. The two last columns present the results of both our fixed effect regressions. Results remain consistent with what was previously found and have a similar magnitude using our instrumental variable : 1 additional social housing unit seems to displace about 1 private unit.
OLS IV Fixed Effect Fixed effect with IV
Private Housing Private Housing Private Housing Private Housing
Social Housing 1.314∗∗∗ -2.239∗∗ -0.149 -0.898∗∗∗
(0.180) (1.134) (0.205) (0.167)
Density -0.00333 -0.00228 -0.158∗∗∗ -0.181∗∗∗
(0.00171) (0.00222) (0.0372) (0.0261)
Empty Units -0.819∗∗∗ -0.991∗∗∗ -0.829∗∗ -0.767∗∗∗
(0.120) (0.159) (0.265) (0.187)
99-09 0.0666∗∗∗ 0.0634∗∗∗
(0.00339) (0.00251)
_cons 0.191∗∗∗ 0.293∗∗∗ 0.373∗∗∗
(0.0177) (0.0340) (0.0617)
Additional Control Size and type of UA Size and type of UA
Fixed Effect Region Region Urban Area Urban Area
Instrument No Instr1 No Instr1
F-stat (13.12) (125.4)
R2 0.45 0.033 0.574 0.087
Obs 771 771 1542 1542
Robust Standard errors in parentheses
∗p <0.05,∗∗p <0.01,∗∗∗p <0.001
Tab. 9: Impact of social housing on Private Housing construction at the Urban Area Level
5 Interpretation and Policy Implications
5.1 Social housing appears to affect negatively private construction
Our estimates at the three level suggest the existence of a stable and robust crowding out effect. Our results suggest that 1 additional social housing unit may displace between 0.8 and 2 housing units. However, as we already men- tioned, our results rely on our identification strategy and its exclusion restriction : the share of social housing in the area shouldn’t be correlated with unobserved incentives for private construction. We already suggested that the share of social housing might be related with the socioeconomic composition of the municipal- ity. For example, a high share of social housing might give a bad reputation to the neighborhood. This paper proposes three strategies to deal with this potential problem.
First, we think that increasing the size of the units of observation might reduce this problem since private investors can build in area distant from these
5 Interpretation and Policy Implications 28
neighborhoods. We can notice that the effect tends to be smaller as the area of observation increases. One possible interpretation for this phenomenon could be that part of the phenomenon is due to a relocation of private projects in adjacent area.
Second, we use alternate instruments less sensitive to this exclusion restric- tion. The first alternate instrument relies on the fact that part of social housing construction is explained by the current stock which was partially determined by the history of the municipality (World War II destructions) . We thus can think that past destructions are less likely to be correlated with current deter- minant of private construction. Our estimations based on this strategy are still consistent with a negative impact of social housing on private construction but estimates are less precise since the first stage is less strong. The second instru- ment uses the recent law passed at the beginning of the decade which forced municipalities of a certain size to increase their share of social housing units.
Since these municipalities usually had a lower number of units, we can think that the fact that a city is submitted to the SRU law wouldn’t face the bad neighborhood effect likely to challenge our exclusion restriction with our main instrument. This last strategy still suggest a negative and significant impact of social housing on private construction even if less precise.
Finally, we use a fixed effect regression extending our model to two periods in order to control for constant unobserved heterogeneity. In this framework, our estimates still suggest a significant crowding out effect strengthening our confidence in our previous results.
5.2 Competing for Land or Tenants?
The literature suggested several channels likely to explain the crowding out effect, in particular competition for land, tenants and funds. It appears im- portant to identify the mechanisms at stake in order to derive the appropriate policy implications. As far as competition for funds is concerned, the system of subsidized loans for social landlords should probably contain this problem. On the other hand, competition for land and tenants both appear to be a possible source of crowding out effect.
We think that it is possible to identify which channels are at stake looking for variation of the impact according to market tensions. Our intuition is quite simple: on the one hand, in area where the housing market is tight, the level of demand is such that additional social housing units shouldn’t reduce too much the demand for private units. As a consequence, the crowding out effect due to a competition for tenants should be limited in tight areas and strong where demand for housing is relatively low. On the other hand, if the main channel is the limited amount of land available, the crowding out effect should be stronger in tight areas where land is a scarcer resource and limited where land is easily available.
We thus divide our sample in order to identify what is the impact of social housing in areas with different levels of tightness. As a proxy for market tight- ness in municipalities, we use housing area defined by fiscal administration to