HAL Id: tel-02289619
https://tel.archives-ouvertes.fr/tel-02289619v2
Submitted on 18 Sep 2019
HAL is a multi-disciplinary open access archive for the deposit and dissemination of sci-entific research documents, whether they are pub-lished or not. The documents may come from teaching and research institutions in France or abroad, or from public or private research centers.
L’archive ouverte pluridisciplinaire HAL, est destinée au dépôt et à la diffusion de documents scientifiques de niveau recherche, publiés ou non, émanant des établissements d’enseignement et de recherche français ou étrangers, des laboratoires publics ou privés.
Biomarkers Identification and Disease Modeling using
Multimodal Neuroimaging Approaches in Polyglutamine
Diseases
Isaac Mawusi Adanyeguh
To cite this version:
Isaac Mawusi Adanyeguh. Biomarkers Identification and Disease Modeling using Multimodal Neu-roimaging Approaches in Polyglutamine Diseases. Neurons and Cognition [q-bio.NC]. Université Pierre et Marie Curie - Paris VI, 2017. English. �NNT : 2017PA066279�. �tel-02289619v2�
Université Pierre et Marie Curie
Ecole Doctorale Cerveau Cognition Comportement
Institut du Cerveau et de la Moelle Épinière
Biomarkers Identification and Disease Modeling using
Multimodal Neuroimaging Approaches in Polyglutamine
Diseases
Par Isaac ADANYEGUH
Thèse de doctorat de Neurosciences
Dirigée par Fanny MOCHEL
Présentée et soutenue publiquement le 15 Septembre, 2017 Devant un jury composé de :
Dr RONEN Itamar Directeur de Recherche Rapporteur
Pr TRANCHANT Christine Professeur des Universités Rapporteur
Dr BETUING Sandrine Maître de conférences Représentant de UPMC
Dr BROUILLET Emmanuel Directeur de Recherche Examinateur
Pr DURR Alexandra Professeur des Universités Examinateur
Dr HENRY Pierre-Gilles Directeur de Recherche Examinateur
Pr FLAMAND ROZE Emmanuel Professeur des Universités Examinateur
Dedicated to all patients suffering from neurodegenerative disorders especially Huntington disease and spinocerebellar ataxia
Table of Contents
Remerciements
... ixList of publications
... xiList of tables
... xiiiList of figures
... xivList of abbreviations
... xviAbstract
... xviiiRésumé
... xxIntroduction
... 1Chapter 1
... 4 Polyglutamine disorders ... 5 1.1 Huntington disease ... 61.1.1 Genetics and mitochondrial dysfunction in HD ... 7
1.1.2 Pathogenesis and symptoms of HD ... 9
1.2 Spinocerebellar ataxia ... 11
1.2.1 Spinocerebellar ataxia type 1 (SCA1) ... 12
1.2.2 Spinocerebellar ataxia type 2 (SCA2) ... 14
1.2.3 Spinocerebellar ataxia type 3 (SCA3) ... 16
1.2.4 Spinocerebellar ataxia type 7 (SCA7) ... 18
1.3 Diagnosis and treatment of polyglutamine diseases ... 21
Magnetic resonance (MR) approaches to biomarker identification ... 23
1.4.1 Principles of MR ... 23
1.4.2 Evaluating atrophy and axonal damage ... 26
1.4.3 Determination of brain metabolic alterations with MRS ... 29
Objectives ... 33
Chapter 2
... 34Study 1: Validation of a functional biomarker and its use to evaluate an anaplerotic therapy in HD. ... 35
2.2 Materials and methods ... 35 2.3 Principal results ... 36 2.4 Published article ... 37 2.6 Perspective ... 44 2.6.1 TRIHEP3 ... 44 2.6.2 REVHD ... 46
2.6.3 Key role of MRI-MRS evaluations in both studies ... 48
Chapter 3
... 49Study 2a: Understanding the biochemical basis of altered bioenergetics in HD using 31 P MT ... 50
3.1.1 Introduction and objectives ... 50
3.1.2 Materials and methods ... 50
3.1.3 Results ... 51
Study 2b: Proton spectroscopy in the visual cortex and striatum of HD ... 53
3.2.1 Introduction and objectives ... 53
3.2.2 Materials and methods ... 53
3.2.3 Principal results ... 54
3.2.4 Submitted paper for publication ... 54
3.3 Perspective: Identifying biomarkers of dynamic energy metabolism (HDeNERGY).. ... 79
3.3.1 31P magnetization transfer ... 79
3.3.2 Diffusion weighted spectroscopy ... 80
3.3.3 Resting state functional MRI (rsfMRI) ... 82
3.3.4 Structural analysis ... 85
3.3.5 Protocol setup ... 86
Chapter 4
... 87Study 3: Standardization and optimization of 1H MRS protocol at 3T using short-echo, single-voxel semi-LASER protocol ... 88
4.1 Introduction and objectives ... 88
4.2 Materials and methods ... 88
4.5 Published article ... 89
Chapter 5
... 98Study 4: Application of the validated 1H MRS protocol in SCAs ... 99
5.1 Introduction and objectives ... 99
5.2 Materials and methods ... 99
5.4 Principal results ... 99
5.5 Published article ... 100
Chapter 6
... 115Study 5: Autosomal dominant ataxia: identification of imaging biomarkers with high effect size ... 116
6.1 Introduction and objectives ... 116
6.2 Materials and methods ... 117
6.2.1 Participants ... 117
6.2.2 Imaging protocol ... 118
6.2.3 Volumetric analysis ... 118
6.2.4 Rate of atrophy ... 119
6.2.5 Diffusion tensor imaging ... 119
6.2.6 Tractography - Fixel based analysis ... 120
6.2.7 Statistical analysis ... 121
6.3 Results ... 122
6.3.1 Clinical score ... 122
6.3.2 Volumetric analysis ... 122
6.3.3 Diffusion tensor imaging ... 123
6.3.4 Fixel Based Analysis ... 123
6.3.5 Effect size ... 123
6.4 Discussion ... 135
Chapter 7
... 138Study 6: A strategy for multimodal data integration: application to biomarkers identification in spinocerebellar ataxia ... 139
7.2 Materials and methods ... 139 7.3 Principal results ... 140 7.4 Perspective ... 140 7.5 Published article ... 140
Chapter 8
... 155 Conclusion ... 156References
... 158Annex
... 177Triheptanoin dramatically reduces paroxysmal motor disorder in patients with GLUT1 deficiency. ... 177
Remerciements
Je tiens à remercier tous les participants des diverses études qui ont rendu ce projet possible. Mes remerciements vont au CENIR, CIC, CMRR et la plateforme de Bioinformatique et Biostatistique de l'ICM pour leur soutien technique et leurs ressources humaines. Je remercie Romain Valabregue de m'avoir donné des instructions sur la programmation et le traitement du signal en Matlab, Mélanie Didier pour l'acquisition de données quand je n’étais pas disponible, Francesca Branzoli pour son assistance en spectroscopie, Vincent Perlbag pour la programmation en Python et les analyses statistiques, et Stéphane Lehericy et Eric Bardinet pour avoir permis de réaliser des études pilotes. Je remercie Pierre-Gilles Henry, Dinesh Deelchand et Gulin Oz pour les tutoriels sur la physique et pour leur grande disponibilité lorsqu’il s’agit de conseil en traitement et quantification des données spectroscopiques.
Toutes ces études ne se seraient pas déroulées sans la coordination des assistants de recherche clinique. Je suis donc reconnaissant à Daisy Rinaldi, Marie Pierre Luton, Mariana Atencio Segura, Magali Barbier, Tiffany Monnier, Céline Jauffret, Elodie Petit, Sandra Benaich et Sarah Boster.
Je saisis cette occasion pour remercier également Tra My Nguyen, pour m'avoir aidé à affiner mes compétences en acquisition de données.
Je remercie Alexis Brice qui m'a accueilli dans son laboratoire et m'a donné un soutien académique et administratif lors de ma thèse. Je tiens à remercier Alexandra Durr pour ses enseignements sur les maladies neurodégénératives, en particulier les ataxies spinocérébelleuses.
Mes sincères remerciements à mon superviseur de thèse, Fanny Mochel, pour m’avoir donné une chance et l'occasion de développer et d'améliorer mes compétences en neuroimagerie. Son dévouement à la recherche et sa motivation pour développer des talents chez les autres, en particulier les jeunes scientifiques, sont uniques.
J'aimerais remercier mes collègues – Fernando Pérez García, Fatma Gargouri, Sophie Sebille et Eric Moulton – que j’ai pu déranger à tout moment afin de discuter de problèmes de programmation.
Mes sincères remerciements à mon père et mes frères et sœurs pour tous leurs encouragements.
Enfin, je suis pour toujours redevable à ma femme, Joana Adanyeguh et à ma petite fille Arielle Adanyeguh, pour leur force et leur soutien pendant tout le temps où nous avons été séparés durant ma thèse.
List of publications
Published articles
Garali I, Adanyeguh IM, Ichou F, Perlbarg V, Seyer A, Colsch B, Mozer I, Guillemot V, Durr A, Mochel F, Tenenhaus A. A strategy for multimodal data integration: application to biomarkers identification in spinocerebellar ataxia. Brief Bioinform 2017: Epub July 03.
https://doi.org/10.1093/bib/bbx060
Adanyeguh IM, Rinaldi D, Henry PG, Caillet S, Valabregue R, Durr A, Mochel F.
Triheptanoin improves brain energy metabolism in patients with Huntington disease.
Neurology 2015;84(5):490-495. https://doi.org/10.1212/WNL.0000000000001214
Adanyeguh IM, Henry PG, Nguyen TM, Rinaldi D, Jauffret C, Valabregue R, Emir UE,
Deelchand DK, Brice A, Eberly LE, Öz G, Durr A, Mochel F. In vivo neurometabolic profiling in patients with spinocerebellar ataxia types 1, 2, 3, and 7. Mov Disord
2015;30(5):662-670. https://doi.org/10.1002/mds.26181
Deelchand DK, Adanyeguh IM, Emir UE, Nguyen TM, Valabregue R, Henry PG, Mochel F, Öz G. Two-site reproducibility of cerebellar and brainstem neurochemical profiles with
short-echo, single-voxel MRS at 3T. Magn Reson Med 2015;73(5):1718-1725.
https://doi.org/10.1002/mrm.25295
Submitted articles
Adanyeguh IM, Monin ML, Rinaldi D, Freeman L, Durr A, Lehéricy S, Henry PG, Mochel
F. Expanded neurochemical profile in the early stage of Huntington disease using proton magnetic resonance spectroscopy.
Adanyeguh IM, Perlbag V, Henry PG, Rinaldi D, Petit E, Valabregue R, Brice A, Durr A,
Mochel F. Autosomal dominant ataxia: identification of imaging biomarkers with high effect sizes.
Additional contributions
Masingue M, Adanyeguh I, Nadjar Y, Sedel F, Galanaud D, Mochel F. Evolution of structural neuroimaging biomarkers in a series of adult patients with Niemann-Pick type C
under treatment. Orphanet J Rare Dis 2017;12(1):22.
https://doi.org/10.1186/s13023-017-0579-3
Mochel F, Hainque E, Gras D, Adanyeguh IM, Caillet S, Héron B, Roubertie A, Kaphan E, Valabregue R, Rinaldi D, Vuillaumier S, Schiffmann R, Ottolenghi C, Hogrel JY, Servais L, Roze E. Triheptanoin dramatically reduces paroxysmal motor disorder in patients with
GLUT1 deficiency. J Neurol Neurosurg Psychiatry 2016;87(5):550-553.
List of tables
Table 1: Properties of nuclei that can be used in MRS ... 30 Table 2: Demographic parameters of participants (BIOSCA) ... 125 Table 3: Effect size of clinical scores and brain imaging parameters (BIOSCA) ... 126
List of figures
Figure 1: Pathogenesis of polyglutamine disorders ... 6
Figure 2: CAG-repeat length correlates with the age of symptoms onset in HD ... 7
Figure 3: Mechanisms that contribute to metabolic/mitochondrial dysfunction in HD.. ... 9
Figure 4: CAG repeat length correlates with the age of symptoms onset in SCAs ... 12
Figure 5: Neuropathological observations in SCA1 ... 14
Figure 6: Neuropathological observations in SCA2 ... 16
Figure 7: Neuropathological observations in SCA3 ... 18
Figure 8: Neuropathological observations in SCA7 ... 20
Figure 9: Genetic testing may offer an opportunity to take advantage of the therapeutic window before symptoms onset ... 21
Figure 10: Dipole moment and free induction decay ... 25
Figure 11: Relaxation times introduce endogenous contrast between tissue types ... 26
Figure 12: Brain boundary shift integral application in HD ... 27
Figure 13: Equation of equilibrium reaction of the exchange of high-energy phosphate group between ATP and PCr ... 32
Figure 14: Representative spectra and the coil and region of interest for the 31P experiment ... 37
Figure 15: Design of the multi-centric studies to test the efficacy of two therapeutic agents in improving metabolic dysfunction and slowing caudate atrophy in HD. ... 44
Figure 16: 31P MT spectra from the visual cortex ... 51
Figure 17: Rate of CK measured with 31P MT in the visual cortex of patients and controls.. ... 52
Figure 18: Preliminary results of the rate of CK measured with 31P MT in the visual cortex of patients and controls ... 80
Figure 19: Preliminary results of DWS analysis ... 82
Figure 20: Preliminary network analysis (rsfMRI) on volunteers data ... 85
Figure 21: Change in clinical scores after 24 months (BIOSCA) ... 127
Figure 22: Change in regional volume after 24 months (BIOSCA) ... 128
Figure 23: Rate of atrophy in the cerebellum and pons (BIOSCA) ... 129
Figure 24: Tract based statistical analysis of FA and RD in SCAs and controls ... 130
Figure 25: The preprocessing steps of the diffusion data for FBA ... 131
Figure 27: Connectivity-based fixel enhancement on FD, FC and FDC ... 133 Figure 28: FDC correlation with clinical scores and cerebellar atrophy (BIOSCA) ... 134
List of abbreviations
1H: Proton
31
P: 31-phosphorus
ADC: Apparent diffusion coefficient
Ataxin: Ataxin protein
ATP: Adenosine triphosphate
ATXN: Ataxin gene
b: Strength and timing of diffusion gradients
B1: Radiofrequency pulse
BISTRO: B1-insensitive train to obliterate signal
BSI: Boundary shift integral
CAG: Cytosine-adenine-guanine
CCFS: Composite Cerebellar Functional Severity Score
CK: Creatine-kinase
DTI: Diffusion tensor imaging
DWS: Diffusion weighted spectroscopy
FA: Fractional anisotropy
FASTMAP: Fast automatic shimming technique with echo-planar signal trains using
mapping along projections
FBA: Fixel based analysis
FC: Fiber cross-section
FD: Fiber density
FDC: Fiber density and cross-section
FID: Free induction decay
HD: Huntington disease
HTT: Huntingtin gene
Htt: Huntingtin protein
mHtt: Mutant huntingtin protein
MRI: Magnetic resonance imaging
MRS: Magnetic resonance imaging
MT: Magnetization transfer
PCr: Phosphocreatine
Pi: Inorganic phosphate
RD: Radial diffusivity
RF: Radiofrequency
rsfMRI: Resting state functional magnetic resonance imaging
SARA: Scale for the Assessment and Rating of Ataxia
SCA: Spinocerebellar ataxia
SNR: Signal to noise ratio
TE: Echo time
TR: Repetition time
Abstract
Mutations in different gene loci that lead to the encoding of the unstable and expanded glutamine-encoding cytosine-adenine-guanine (CAG) repeats results in the group of diseases known as the polyglutamine diseases. The most common forms are Huntington disease (HD) and spinocerebellar ataxia (SCA) types 1, 2, 3 and 7. These are autosomal dominant neurodegenerative diseases responsible for severe movement disorders with primary atrophy of the striatum in HD and the cerebellum/pons in SCAs before spreading to several brain regions. HD and SCAs are purely genetic disorders. HD and SCAs are thought to share common pathophysiological pathways with a major emphasis on metabolic dysfunction. Metabolic dysfunction in these diseases coupled with their monogenic attribute make them important models to study and understand the pathophysiological processes of neurodegeneration especially for therapeutic interventions seeking to amend metabolic dysfunction. Furthermore, the availability of genetic testing and their predominantly adult onset opens a window for therapeutic intervention before their onset. However, current clinical scales – Unified Huntington Disease Rating Scale (UHDRS) for HD and the Scale for the Rating and Assessment of Ataxia (SARA) or the Composite Cerebellar Functional Severity Score (CCFS) for SCAs – have relatively low effect sizes, which implies the recruitment of large numbers of patients in therapeutic trials, and cannot be used to evaluate individuals at the presymptomatic stage. This prompts the need for biomarkers that are sensitive to macroscopic and microscopic changes that may occur prior to disease onset. Magnetic resonance imaging (MRI) and spectroscopy (MRS) techniques present non-invasive approaches to extract pertinent information that otherwise would not be possible with clinical scales. In this work, we present a combination of different MRI and MRS techniques to identify robust biomarkers in HD and SCA since it is unlikely for a single biomarker to have the power to be used alone in clinical trials. We also present therapeutic approaches that hold promise in HD.
In HD, we identified abnormal brain metabolic profile using 31P MRS coupled with visual
stimulation. During visual stimulation, controls showed an increase in the inorganic phosphate/phosphocreatine ratio whilst there was no change in HD patients. This profile remained abnormal in the patients after one-month of follow-up. However, one-month anaplerotic therapy using triheptanoin improved brain metabolic profile in 10 HD patients. Two separate blinded randomized placebo controlled studies are ongoing to further test the
anaplerotic properties of triheptanoin, as well as a regulator of mitochondrial energy homeostasis, resveratrol, in 100 HD patients each for a year. To understand the underlying
cause of the abnormal brain energy profile in HD, we used 31P magnetization transfer in
another study to measure the rate of the creatine-kinase (CK) in HD patients and controls. We identified a reduced CK rate in HD, which could explain the abnormal brain energy profile.
Furthermore, applying 1H MRS in HD allowed to identify other metabolites that showed
alterations in HD. In order to better explain the abnormal profile in HD and identify robust biomarkers reflecting dynamic energy metabolism, a study is ongoing in a larger cohort of HD patients and presymptomatic carriers. This study combines multimodal MRI and MRS techniques including magnetization transfer, diffusion weighted spectroscopy and resting state functional MRI.
Additionally, using 1H MRS in a bicentric study, we showed that the lack of reproducibility of
MRS results could be resolved when the same sequence and analytical procedures are used. We applied this validated protocol in SCAs and we identified alterations in several metabolites including decreased neuronal markers – total N-acetylaspartate and glutamate –, increased glial marker – myo-inositol –, and increased energetic marker – total creatine. Analysis of follow-up SCA data showed similar metabolic alterations. Clinical scores worsened and atrophy of the cerebellum and the pons significantly increased over two years. However, atrophy showed very large effect sizes compared to clinical scores. A novel tractography method accounting for different fiber populations in each voxel, called fixel-based analysis, showed changes in white matter fibers in all SCA groups compared to controls with reduced fiber density and fiber cross-section. In addition, we applied a multimodal biomarkers approach, aiming at the integration and visualization of multivariate datasets (i.e. volumetry, MRS, metabolomics and lipidomic) to best explain the pathology in SCAs.
Keywords: Biomarkers, Huntington disease, spinocerebellar ataxia, magnetic resonance
spectroscopy, magnetic resonance imaging, disease modeling, 31P MRS, 1H MRS,
magnetization transfer, diffusion weighted spectroscopy, resting state fMRI, diffusion tensor imaging, fixel based analysis.
Résumé
Les maladies par expansion de polyglutamines sont des maladies neurodégénératives d’origine génétique dues à l’expansion du trinucléotide cytosine-adénine-guanine CAG codant pour une expansion d’homopolymère de glutamine dans les protéines mutées. Les formes les plus courantes sont la maladie de Huntington (MH) et les ataxies spinocérébelleuses (SCA) types 1, 2, 3 et 7. Ce sont des maladies neurodégénératives autosomiques dominantes, responsables de troubles moteurs graves avec une atrophie initiale du striatum dans la MH et du cervelet/pont dans les SCAs avant de s’étendre à plusieurs régions du cerveau. La MH et les SCAs sont des maladies purement génétiques et partagent des voies physiopathologiques communes, notamment en terme de dysfonction métabolique. Le dysfonctionnement métabolique et le caractère monogénique de ces maladies en font des modèles importants à étudier dans le but de comprendre les processus physiopathologiques de la neurodégénérescence, notamment pour les interventions thérapeutiques visant les dysfonctions métaboliques. En outre, la disponibilité des tests génétiques et le fait que la maladie débute le plus souvent à l’âge adulte offrent la possibilité d’une intervention thérapeutique avant l’apparition de symptômes. Toutefois, les échelles cliniques – Unified Huntington Disease Rating Scale (UHDRS) dans la MH et les échelles d’évaluation de l’Ataxie (SARA et CCFS) dans les SCA – ont une taille d'effet relativement faible, ce qui implique le recrutement d'un grand nombre de patients dans les essais thérapeutiques, ne sont pas assez sensibles et ne peuvent être utilisées pour évaluer les personnes au stade présymptomatique de la maladie. D’où la nécessité de trouver des biomarqueurs sensibles aux changements macroscopiques et microscopiques qui peuvent survenir avant l’apparition de la maladie. L’imagerie par résonance magnétique (IRM) et les techniques de spectroscopie (SRM) sont des approches non invasives permettant de recueillir des informations pertinentes, impossibles à obtenir avec les échelles cliniques. Dans ce travail, nous présentons une combinaison de différentes techniques IRM et SRM afin d’identifier des biomarqueurs robustes dans la MH et les SCA puisqu’il est peu probable qu’un biomarqueur unique puisse être utilisé seul dans les essais cliniques. Nous présentons également des approches thérapeutiques prometteuses dans la MH.
Dans la MH, l’utilisation du 31P SRM couplé à la stimulation visuelle nous a permis
visuelle, les témoins ont montré une augmentation du ratio entre phosphate inorganique et phosphocréatine alors que le ratio était inchangé chez les patients MH. Ce profil est resté anormal dans les patients qui ont été suivis pendant un intervalle d’un mois. A l’inverse, une thérapie anaplérotique à base de triheptanoïne administrée pendant un mois a corrigé le profil métabolique cérébral chez 10 patients MH. Deux études distinctes, randomisées, contrôlées, en double aveugle sont en cours afin de tester les propriétés anaplérotiques de la triheptanoïne, ainsi qu’un régulateur de l’homéostasie énergétique mitochondriales, le du resvératrol, chez 100 patients MH chacune. Pour comprendre la cause sous-jacente du profil énergétique cérébral anormal dans la MH, nous avons utilisé une technique de transfert de magnétisation afin de mesurer le taux de créatine kinase chez les patients MH et les témoins. Nous avons identifié une plus faible activité de la CK chez les patients MH qui pourrait expliquer leur profil énergétique cérébral. D’autre part, l’utilisation de la technique SRM du proton nous a permis d'identifier d'autres altérations métabolites chez les patients MH. Afin d'identifier des biomarqueurs dynamiques du métabolisme énergétique cérébrale, une étude est en cours chez un plus grand nombre de patients MH et d’individus présymptomatiques. Cette étude combine les techniques multimodales IRM et SRM, y compris le transfert de magnétisation, la spectroscopie pondérée en diffusion et l’IRM fonctionnelle à l'état de repos.
En utilisant la technique de SRM du proton dans une étude menée dans deux sites distincts, nous avons montré que le manque de reproductibilité des résultats de SRM pouvait être résolu lorsqu’on utilisait la même séquence et les mêmes procédures analytiques. Nous avons appliqué ce protocole validé dans les SCAs et nous avons identifié des altérations dans plusieurs métabolites, y compris la diminution de marqueurs neuronaux – N-acétylaspartate total et du glutamate –, l’augmentation d’un marqueur glial – myo-inositol – ainsi que l’augmentation d’un marqueur énergétique - créatine totale. Ces altérations métaboliques étaient stables sur deux ans chez les patients SCA. Les scores cliniques se sont aggravés et l’atrophie du cervelet et du pont s’est majorée sur deux ans. Toutefois, l'atrophie a montré des tailles d’effet bien plus importante que les scores cliniques. Une nouvelle méthode de tractographie qui tient compte des différentes populations de fibres au sein de chaque voxel, appelée «fixel-based analysis», a montré une altération des fibres de la substance blanche dans tous les groupes SCA par rapport aux témoins, avec une réduction de la densité des fibres et de leur section transversale. Par ailleurs, nous avons appliqué une approche biomarqueurs multimodale, qui vise à l'intégration et à la visualisation d'ensemble de données
multivariées (volumétrie, SRM, métabolomiques et lipidomiques), afin de mieux expliquer la physiopathologie des SCA.
Mots-clés: Biomarqueurs, maladie de Huntington, ataxie spinocérébelleuses, spectroscopie de
résonance magnétique, imagerie par résonance magnétique, modélisation de la maladie, 31P
SRM, 1H SRM, transfert de magnétisation, spectroscopie à diffusion ponctuelle, imagerie par
Introduction
Polyglutamine diseases are a group of neurodegenerative disorders that result from mutations in different gene loci that contain the glutamine encoding cytosine-adenine-guanine (CAG) triplet repeats that leads to expansion and instability of the gene and affected proteins. There are different forms of polyglutamine disorders and they include Huntington disease (HD), several spinocerebellar ataxia (SCA), dentatorubral pallidoluysian atrophy (DRLPLA) and spinal bulbar muscular atrophy (SBMA).
This work focuses on HD and SCA types 1, 2, 3 and 7 as they remain the most common forms of polyglutamine diseases. They are autosomal dominant diseases that present with severe movement disorders in the form of chorea in HD and ataxia in SCAs. They are monogenic diseases with the possibility of genetic testing and hence serve as important models to study neurodegeneration unlike other neurodegenerative disorders such as Parkinson and Alzheimer. They are late onset, which opens a window for therapeutic intervention before symptoms develop. They also share common pathophysiological pathways with a major emphasis on metabolic dysfunction. The two main potential therapeutic interventions include targeting the polyglutamine protein to reduce their production or modify them, and metabolic interventions to reverse metabolic dysfunction. The problem of testing these therapies lies in the limitations of the clinical scales used to evaluate the disease progression. The major clinical scales are the Unified Huntington Rating Scale (UHDRS) to evaluate HD and the Scale for the Rating and Assessment of Ataxia (SARA) and the Composite Cerebellar Functional Severity Score (CCFS) to evaluate SCAs. However, in therapeutic trials of very rare disorders like SCAs, the low effect sizes of these clinical scales would likely require a large number of patients making these trials hardly feasible. Clinical scores are not able either to detect macro- and microstructural changes such as atrophy and metabolic alterations that may occur before, during and after symptoms onset. Another important caveat of clinical scales is that, by definition, they cannot be used to evaluate premanifest individuals. Hence, there is a need for biomarkers with effect sizes greater than clinical scores that can be used on small sample sizes of patients with HD or SCA.
The objectives of this work are to identify robust biomarkers of HD and SCA using non-invasive magnetic resonance imaging (MRI) and spectroscopy (MRS) techniques and to
assess the anaplerotic properties of potential therapeutic agents in improving metabolic dysfunction in HD. These biomarkers can then be used in models to explain disease progression. Currently, there has been a rise in the number of modalities used to characterize a given disease. These modalities include, but are not limited to, clinical, imaging, molecular biology, physiological, and biochemical methods. Since each modality differs in the type and number of variables they generate, conventional statistical tools are incapable of integrating these multimodal data into models while preserving the unique properties of each modality. Therefore, we applied new statistical tools based on multiblock analyses that allowed the integration and visualization of these multivariate datasets. The selection of a few meaningful variables can also enable their combination into composites scores, which are likely to provide both a better reflection of the disease process pathology and larger effect sizes than any biomarker alone.
The manuscript has therefore been organized into 7 parts as follows:
Chapter 1 is a brief overview of the pathophysiology of HD and SCA types 1, 2, 3 and 7.
This chapter also introduces different MRI and MRS techniques that can be used to study these disorders. Finally, this chapter presents the objectives of the thesis.
Chapter 2 presents the application of a 31P MRS technique in biomarker identification study in HD and its use in a proof-of-concept anaplerotic study in HD. Likewise, I will present the follow-up of this anaplerotic study with the inclusion of diffusion tensor imaging (DTI) and boundary shift integral (BSI) approaches.
Chapter 3 presents a study that resulted from the study in chapter 2. In this chapter, I present
a method that aims at elucidating the biochemical basis of altered 31P profiles in HD. I also
applied techniques allowing the analysis of an expanded neurochemical profile in HD patients. The next step involves the combination of metabolic, structural, and functional techniques in order to study the dynamics of brain energy metabolism in HD patients and presymptomatic individuals.
Chapter 4 is a methodological study to test the reproducibility of a modified 1H MRS sequence in order to standardize acquisition and quantification protocols between study sites in view of multi-centric studies.
Chapter 5 reports the application of the methods in chapter 4 to elucidate the metabolic
dysfunction in the brain of SCA patients.
Chapter 6 presents the use of diffusion imaging and volumetric analysis in biomarker
identification in SCA.
Chapter 7 presents a statistical approach that improves multimodal data integration for
Chapter 1
Organisation:
Polyglutamine disorders ... 5
1.1 Huntington disease ... 6 1.1.1 Genetics and mitochondrial dysfunction in HD ... 7 1.1.2 Pathogenesis and symptoms of HD ... 9 1.2 Spinocerebellar ataxia ... 11 1.2.1 Spinocerebellar ataxia type 1 (SCA1) ... 12 1.2.2 Spinocerebellar ataxia type 2 (SCA2) ... 14 1.2.3 Spinocerebellar ataxia type 3 (SCA3) ... 16 1.2.4 Spinocerebellar ataxia type 7 (SCA7) ... 18 1.3 Diagnosis and treatment of polyglutamine diseases ... 21
Magnetic resonance (MR) approaches to biomarker identification ... 23
1.4.1 Principles of MR ... 23 1.4.2 Evaluating atrophy and axonal damage ... 26 1.4.3 Determination of brain metabolic alterations with MRS ... 29
Polyglutamine disorders
The pathological expansion of CAG repeats in different gene loci gives rise to the different neurodegenerative disease known as polyglutamine disorders. They are all autosomal dominant disorders with the exception of the X-linked SBMA (Orr & Zoghbi, 2007). The genes involved are nonetheless unrelated as each disease has a different target protein that is defective. Still, they share common neurodegenerative pathway (Shao & Diamond, 2007; Fan et al., 2014). Even though the defective proteins are widespread in the body, it is not yet known why there is selective cellular damage such as in the striatum of HD and the vermis and pons in SCAs.
On average, the occurrence of more than 35 CAG repeats lead to the disease though the actual numbers vary depending on the disease (Paulson et al., 2000; Shao & Diamond, 2007). This expansion has an inverse correlation with the age of clinical manifestations, a phenomenon known as anticipation (Friedman, 2011). Therefore successive generations tend to have increased expansion of the CAG repeat, which in turn leads to earlier onset of the disease which is more severe than the previous generation. The progressive worsening of the disease is a common feature that continues for about 10 - 20 years.
The exact causes of polyglutamine disorders are not clearly understood but several mechanisms have been implicated as strong influencers on their pathophysiology. These mechanisms are summarized in Figure 1. These mechanisms will be further elaborated for HD and SCA types 1, 2, 3 and 7 which are the focus of this project.
Figure 1: Pathogenesis of polyglutamine disorders. (a) The mutant protein (b) can be
proteolytically processed (c) to form toxic fragments (d) that can form aggregates in the cytoplasm. (e) Breakdown down of these aggregates into toxic products can be shuttled into the nucleus (f) to form intermediate species (h) and nuclear aggregates (g) that can indirectly result in the sequestration of vital proteins. (i) The mutant protein aggregates can damage important cellular components such as the mitochondria (Weber et al., 2014).
1.1 Huntington disease
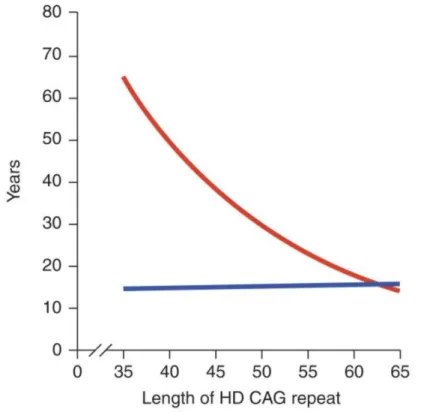
Huntington disease (HD) is an autosomal dominant neurodegenerative disorder that bears its name from the describing physician, George Huntington (Lanska, 2000). HD is a pure genetic disorder with complete penetrance. Even though there are juvenile forms, it is mostly a late-onset disease with symptoms appearing in affected individuals between the ages of 30 and 50 years. Anticipation is very important in HD (Figure 2) and more than 36 CAG repeats lead to the disease with incomplete penetrance between 36 and 39 CAG repeats (Kremer et al., 1994).
Evaluations of the prevalence of HD shows marked heterogeneity across different regions. The prevalence rate per 100,000 of the population is estimated at 0.40 (0.36-0.44) in Asia, 2.17 (1.95-2.41) in Central and Eastern Europe, 7.33 (6.94-7.74) in North America, 5.63 (5.61-6.25) in Oceania, 6.68 (6.40-6.97) in the United Kingdom, and 3.60 (3.50-3.69) in Western Europe (Rawlins et al., 2016).
Figure 2: CAG-repeat length correlates with the age of symptoms onset in HD. The lines
represent age at neurological onset (red) and duration of disease from onset to death (blue). Source (Finkbeiner, 2011).
1.1.1 Genetics and mitochondrial dysfunction in HD
Several decades after its initial description in 1872, advancement in molecular biology allowed the mapping of the disease to chromosome 4p16.3 (Gusella et al., 1983). The disease was then linked to the unstable CAG expansion in the IT15 gene (The Huntington's Disease Collaborative Research Group, 1993), also known as the huntingtin gene (HTT) which codes for the huntingtin protein (Htt). The discovery of HTT paved the way for extensive genetic studies to be performed on this disease. Htt is found throughout the body with the highest concentrations in the brain. Though its exact function is not completely understood, it has
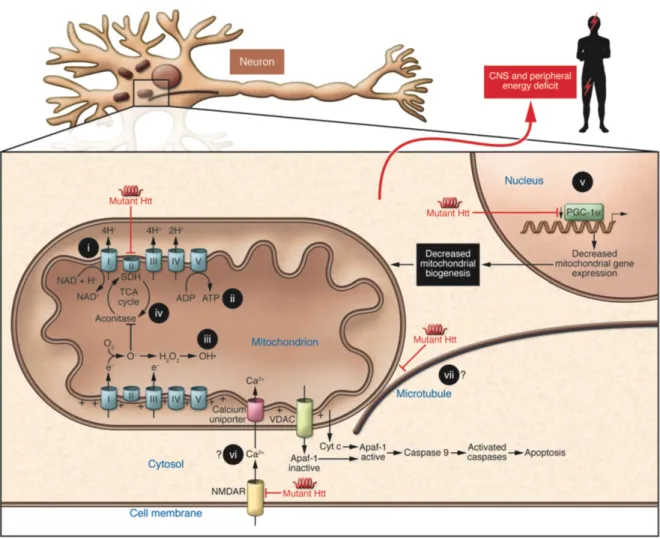
been associated with normal function of the brain and development (Schulte & Littleton, 2011; Elias et al., 2014; Saudou & Humbert, 2016). Wild type Htt is involved in gene expression as it interacts with several transcription factors including CBP, SP1, TBP, p53, p300, Sin3a, and REST/NRSF. It interacts directly with β-tubulin in microtubules to facilitate vesicle transport and cytoskeletal anchoring. Furthermore, by binding directly to mitochondria and also indirectly regulating transcriptional co-activators such as PGC-1α, it is implicated in the regulation of metabolism (Shao & Diamond, 2007; Mochel & Haller, 2011; Fan et al., 2014).
Mutations in the HTT result in the production of mutant Htt (mHtt) and this leads to the disruption in the normal function of Htt as well as its nuclear and cytoplasmic distributions. Most of the impact is on metabolism in HD (Figure 3). Interactions with mHtt affects gene transcription through the depletion of important factors such as CBP (Jiang et al., 2006) or the down-regulation of important co-factors such as PGC-1α (Cui et al., 2006) necessary for mitochondrial biogenesis. Moreover, HD pathogenesis may also be influenced by impairment to intracellular and vesicular shuttling of organelles and other cellular content. Conditional knockout mice expressing less than 50% endogenous Htt showed decreased mitochondrial movement along neuritis and this was even observed in asymptomatic HD mouse neurons (Trushina et al., 2004). The importance of mitochondria cannot be over-emphasized. Apart from serving as the principal energy source, they are also involved in maintaining
homeostasis by regulating intracellular calcium (Ca2+); an important step to normal process of
oxidative phosphorylation. An important enzyme complex that creates a critical link between the Krebs cycle and the respiratory chain is succinate dehydrogenase or mitochondrial complex II. Its activity is greatly disrupted by mHtt and leads to energy defects in HD and may play a critical role in the degeneration of striatal neurons in HD (Damiano et al., 2013). Likewise, reduced glucose metabolism has been found in the brain of HD patients even before symptoms onset (Grafton et al., 1992; Antonini et al., 1996). In addition, HD patients and presymptomatic carriers show sings of weight loss even when they are on high caloric diet (Djousse et al., 2002; Mochel et al., 2007). Metabolic dysfunction might not be limited to the brain only. Reduced branched chain amino acids (BCAA) – valine, leucine and isoleucine – were found in the plasma of patients at the early stage of HD despite high caloric intake (Mochel et al., 2007). Reduction in the BCAA might signify lack of substrates to fuel the
Krebs cycle. Therefore impairment to the movement of mitochondria, disruption in Ca2+
through downregulation of transcription factors likely contribute to mitochondrial dysfunction in HD. This further implies inability to replenish damaged mitochondria in certain regions, perturbation in meeting energy demands, calcium overload, increase in reactive oxygen species, release of cytochrome c and apoptosis (Lee & Wei, 2000; Nicholls, 2009).
Figure 3: Mechanisms that contribute to metabolic/mitochondrial dysfunction in HD.
mHtt may lead to lack of substrates to fuel the Krebs cycle, impair Ca2+ buffering, disrupt
vesicular transport and mitochondrial movement, and downregulate important transcription factors needed for mitochondrial biogenesis. Source (Mochel et al., 2007).
1.1.2 Pathogenesis and symptoms of HD
Severe atrophy of the caudate and putamen are significant neuropathological signs of HD (Vonsattel et al., 1985). The mHtt causes medium-sized spiny neurons in the striatum that contain γ-amino butyric acid (GABA) to undergo selective degeneration (Vonsattel &
DiFiglia, 1998). Cortical atrophy has also been reported (Hedreen et al., 1991). Progressive degeneration of neurons in the striatum and other regions of the brain present several symptoms that can be classified as motor, cognitive or psychiatric symptoms.
Cognitive symptoms: There are discrepancies in reporting cognitive symptoms in most
studies and may be attributed to the subtle cognitive changes at the early stage of HD which might be overlooked for the more prominent motor symptoms (Chaganti et al., 2017). Cognitive decline normally precedes long-term memory loss and it might impact executive functions involved in day-to-day activities such as organizing, planning, checking, or adapting alternatives, and delays the acquisition of new motor skills (Walker, 2007). Visuospatial ability and judgment are impaired as the disease progresses further and global dementia is observed (Lauterbach et al., 1998).
Motor symptoms: Degeneration of the medium spiny neurons in the striatum are vital to the
involuntary movements characteristic to HD – chorea; involuntary dance-like movement – and may be attributed to loss of the projection neurons (Mitchell et al., 1999), which make up the bulk of striatal neurons. Motor symptoms start with small involuntary movements that for example might resemble twitching of the eyelids and other muscles. As the disease progresses the subtle movements give way to more pronounce involuntary jerky movements. In addition, there is the inability to maintain voluntary muscle contraction at a constant level and incapacity to apply steady pressure during handshake. Gross motor coordination skills, including gait and postural maintenance, and fine motor skills, such as finger-tapping rhythm and rate, also deteriorate as the disease progresses. While comprehension is affected, the rate of speech deterioration is faster (Walker, 2007). Dystonia and myoclonus are other forms of movement disorders that may occur.
Psychiatric symptoms: Principal psychiatric symptoms are related to mood disorders. Chronic
depression, irritability, impulsiveness and aggression, are variable and sometimes precede motor onset by years (Gusella & MacDonald, 2006). Patients tend to show personality changes, schizophrenia, anxiety, impulse control and sexual disorders (Lauterbach et al., 1998). Affected individuals contemplating suicide are higher in HD than other diseases such as stroke and Parkinson. Moreover, suicidal tendencies are observed as early as the presymptomatic stage and it increases following genetic testing (Almqvist et al., 1999).
Other symptoms: Aside the neuropsychological symptoms of HD, there are other
non-neurological symptoms as well. One of such is the loss of weight even when affected individuals are on high caloric diet (Djousse et al., 2002; Mochel et al., 2007).
1.2 Spinocerebellar ataxia
SCAs are a group of disorders with progressive and irreversible neurodegeneration that results in cerebellar ataxia leading to unsteady gait and movement coordination. They are clinically heterogeneous with many different subtypes whose numbering corresponds to the order of the identified gene (Manto, 2005). Some SCAs are more severe than others but generally 10-15 years after symptoms onset, most patients are wheelchair bound (Fan et al., 2014). Extensive cerebellar atrophy, particularly of the Purkinje cells, is common to SCAs. Involvement of the brainstem, spinal cord and peripheral nerves is another common feature. Severe ataxia is a predominant symptom in all SCAs, variably associated with pyramidal signs, parkinsonism, cognitive impairment and/or peripheral neuropathy. Though they share common features, others are very unique to each SCA type, such as retinal degeneration in SCA7 (Paulson, 2009).
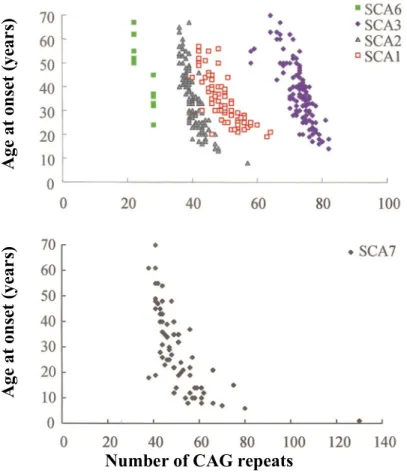
The polyglutamine forms of SCA (SCAs 1, 2, 3, 6, 7 and 17) are autosomal dominant and just like HD, they have varying CAG repeat thresholds depending on the affected gene (Manto, 2005; Rüb et al., 2013). In addition, they are mostly late onset even though juvenile forms exist when the transmission is by an affected father. Furthermore, similar to HD, the age of onset is correlated to the number of CAG repeats (Figure 4). This work focuses on SCAs 1, 2, 3 and 7. The prevalence of the autosomal dominant polyglutamine SCAs is about 1 - 4 per 100,000 of the population with variable frequency of occurrence depending on the region or ethnic group (Durr, 2010; Fan et al., 2014).
Figure 4: CAG repeat length correlates with the age of symptoms onset in SCAs
(Stevanin et al., 2000).
1.2.1 Spinocerebellar ataxia type 1 (SCA1)
The dominantly inherited neurodegenerative SCA1 is caused by CAG expansion in the ataxin-1 gene (ATXN1) that is located on chromosome 6p23 (Orr et al., 1993) and which codes for the ataxin-1 protein. CAG repeats of more than 39 in ATXN1 is reported for SCA1 (Rüb et al., 2013).
Wild type ataxin-1 has been linked to RNA processing and shuttling of RNA between the nucleus and the cytoplasm (Irwin et al., 2005). It also mediates transcriptional repression by interacting with transcriptional co-repressor SMRT (silencing mediator of retinoid and thyroid hormone receptors) (Tsai et al., 2004). Likewise, it influences transcription by interacting with other transcription co-repressors such as PQBP-1 and Capicua (Okazawa et al., 2002; Lam et al., 2006) and the transcription factor critical for cerebellar development – RORα
A ge at on se t (ye ar s) A ge at on se t (ye ar s)
(Serra et al., 2006). Disturbing this interaction through mutation in ataxin-1 is thought to contribute to the pathogenesis of SCA1. A study in transgenic mouse models of SCA1 showed that genes responsible for early Purkinje cells development were reduced in response to mutant ataxin-1 (Serra et al., 2006). Another study showed that mutant ataxin-1 interacts with PQBP-1 to further enhance the reduction of phosphorylated RNA polymerase II large subunit and repress transcription (Okazawa et al., 2002). A cerebellar transcriptomic study on two transgenic mouse models of SCA1 – one developed ataxia with Purkinje cell death (ATXN1[82Q]) whilst the other developed ataxia with no death of Purkinje cells (ATXN1[30Q]D776) – showed that two groups of co-expressed genes were highly correlated with the disease. Co-expressed genes with Cic-binding sites were downregulated whilst those devoid of Cic-binding sites within their upstream regions were upregulated in relation to the disease (Ingram et al., 2016). Further analysis of the ATXN1[30Q]D776 mice revealed highly expressed levels of the neuropeptide gene cholecystokinin. Deletion of this gene led to ATXN1[30Q]D776 mice developing symptoms similar to ATXN1[30Q]D776 mice with Purkinje cell death. This may imply that the cholecystokinin confers some form of neuroprotection and may be a potential therapeutic target (Ingram et al., 2016). Furthermore, other mechanisms independent of the polyglutamine tract are involved in the disease process. Haploinsufficiency in Pumilio1, an RNA-binding protein that binds ataxin-1 mRNA and regulates its stability, resulted in an increase in ataxin-1 levels and exacerbated the symptoms in SCA1 knock-in mice (Gennarino et al., 2015).
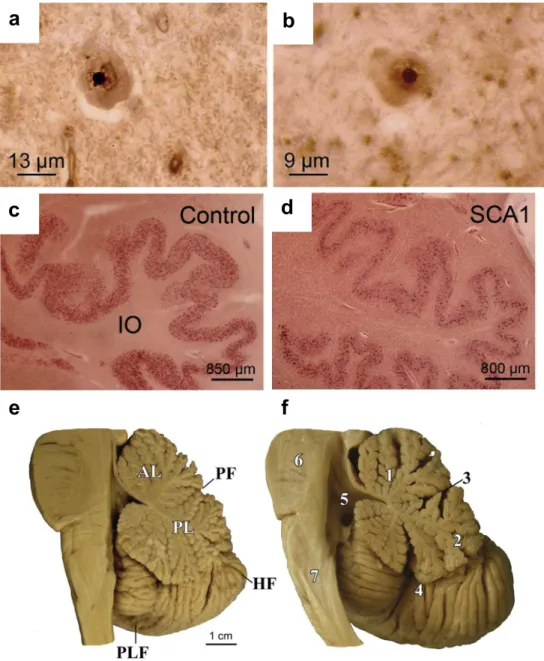
Studies into the neuropathology of SCA1 have revealed neuronal intranuclear inclusion bodies in SCA1 (Figure 5ab). This may directly or indirectly relate to the marked atrophy of the brainstem and cerebellum (Figure 5c). There is also the depletion of Purkinje cells in the cerebellum and loss of neurons in the pontine nuclei and inferior olivary nucleus (Yamada et al., 2008; Rüb et al., 2013).
Different SCA1 patients have variable phenotypes and anticipation depending on the size of the CAG repeats (Paulson, 2009). Pyramidal impairment and oculomotor palsy are observed at the early stages. At the later stages amyotrophic lateral sclerosis-like disorders and sensory disturbance are observed (Yamada et al., 2008; Durr, 2010). Likewise, there is variable expression of dysphagia, extrapyramidal motor symptoms and executive dysfunctions in addition to cerebellar ataxia, dysarthria and cerebellar oculomotor signs (Rüb et al., 2013).
Figure 5: Neuropathological observations in SCA1. Neuronal intranuclear inclusion bodies
are found in the affected (a) inferior olive and (b) pontine nuclei. (d) The inferior olives are degenerated in SCA1 compared to (c) healthy controls. (f) Degeneration of the brainstem and cerebellum are observed in SCA1 with flattened brainstem and widened fissures in the cerebellum compared to (e) healthy controls (Rüb et al., 2013).
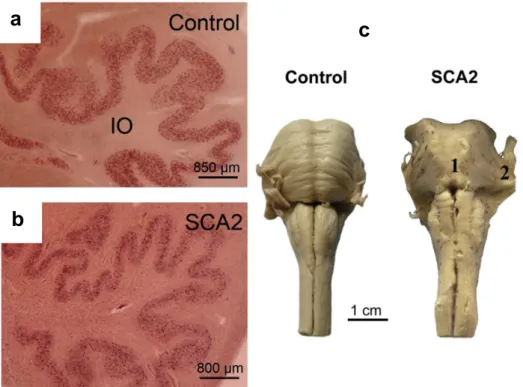
1.2.2 Spinocerebellar ataxia type 2 (SCA2)
Mutations in the chromosome 12q24.1 has been linked to SCA2 (Pulst et al., 1996). This locus is for the ataxin-2 gene (ATXN2) which codes the ataxin-2 protein. Normal CAG
a
b
c
d
f
e
repeats can range from 13 - 32 repeats whilst expanded pathogenic repeats in ATXN2 are often between 33 - 77 CAG repeats (Stevanin et al., 2000; Rüb et al., 2013; Fan et al., 2014). However, repeats of 32 - 34 normally presents reduced penetrance (Paulson, 2009).
Ataxin-2 is ubiquitously expressed just like Htt. Its subcellular localization to the rough endoplasmic reticulum suggests its role in modulating endocytosis. It is also located in the plasma membrane and may aid in the internalization and signaling of receptor tyrosine kinases. Ataxin-2 in the nucleus is also implicated in fine-tuning mRNA translation and decay by binding to transcription factors and related proteins (Rüb et al., 2013). In addition, ataxin-2 is linked to cell specification, apoptosis and receptor-mediated signaling, formation of actin filaments, and secretion (Orr & Zoghbi, 2007). Mutant ataxin-2 reduces neuronal excitability by binding to intracellular calcium release channel and altering calcium signaling. It also renders Purkinje cells sensitive to glutamate-induced apoptosis (Liu et al., 2009).
Neuropathological findings are similar to SCA1 with the depletion of Purkinje cells and atrophy of the cerebellum and brainstem (Figure 6). The basal ganglia, thalamus and cerebral cortex may show mild degeneration in some patients (Yamada et al., 2008; Rüb et al., 2013). In contrast to the other SCAs, intranuclear inclusions are not of importance in SCA2.
Clinically, individuals with small CAG repeats tend to present postural tremor. Medium repeat is often associated with progressive cerebellar ataxia, decreased reflexes and slow eye movement. In addition to cerebellar ataxia, large repeats often present chorea and dementia. Furthermore, patients with very large repeats may have myoclonus, dystonia, cardiac failure, and retinal degeneration (Durr, 2010).
Figure 6: Neuropathological observations in SCA2. The inferior olives are degenerated in
(b) SCA2 compared to (a) healthy controls and (c) the brainstem is particularly atrophied in SCA2 compared to healthy controls (Rüb et al., 2013).
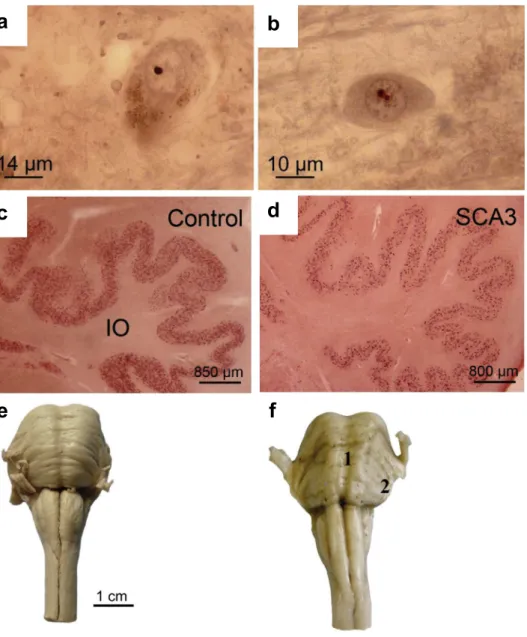
1.2.3 Spinocerebellar ataxia type 3 (SCA3)
SCA3, also known as the Machado-Joseph Disease, is the most commonly inherited SCA (Paulson, 2007). Normal CAG repeats are in the range of 12 - 43 whilst expanded repeats are 52 - 77 (Stevanin et al., 2000; Paulson, 2009; Rüb et al., 2013). The lack of overlap in the sizes of normal and pathogenic repeats suggests there is no range for reduced penetrance unlike in SCA2. The CAG expansion is found on chromosome 14q24.3-q32.2 (Kawaguchi et al., 1994; Paulson, 2007) which contains the ataxin-3 gene (ATXN3).
A thorough review of ataxin-3 protein has shown that it is localized to the cytoplasm, nucleus and mitochondria of peripheral and neuronal tissues. In addition, its normal function has been linked to the ubiquitin-proteasome activity that checks short-lived and misfolded proteins and degrade them (Costa Mdo & Paulson, 2012). It may also possess neuroprotective properties, aid in cellular response to heat stress, interact with shuttle proteins, influence aging process, regulate transcription by binding to transcriptional factors (Costa Mdo & Paulson, 2012). The
c
a
mutant protein alters the ubiquitin-proteasome activity and hence reduces the degradation of short-lived and misfolded proteins. This leads to the accumulation of proteins including aggregates of mutant ataxin-3 in affected tissues. Furthermore, the mutant protein leads has low neuroprotective features, impaired transcriptional regulation and shuttling of materials (Costa Mdo & Paulson, 2012). Impaired intracellular calcium signaling has also been linked to mutant ataxin-3 (Chen et al., 2008).
Cerebellum, brainstem, basal ganglia and other brain regions have been reported to show atrophy in SCA3 (Figure 7) (Paulson, 2007). There is widespread neuronal loss in the Purkinje cell layers. The dopaminergic, cholinergic, noradrenergic and GABAergic neurotransmitter systems also show neuronal loss (Rüb et al., 2013). Neuronal intranuclei inclusions are also present in affected tissues (Paulson, 2007; Yamada et al., 2008; Rüb et al., 2013). SCA3 mutation carriers have perturbed glucose utilization in cerebellum, brainstem and cerebral cortex even before symptoms onset (Soong & Liu, 1998).
Clinical presentations are dependent on the size of the CAG repeat with larger repeats leading to more severe and early onset SCA3 (Paulson, 2007). SCA3 is characterized by progressive cerebellar ataxia, muscle atrophy, dystonia, and spasticity. Very small repeats lead to the rare very late onset SCA3 that can have parkinsonian symptoms. Eye-lid retraction and infrequent blinking are peculiar features of SCA3. Patients can also have speech impairment and difficulty in swallowing (Paulson, 2007; Durr, 2010; Rüb et al., 2013).
Figure 7: Neuropathological observations in SCA3. Neuronal intranuclear inclusion bodies
in the (a) substantia nigra and (b) pontine nuclei in SCA3. Degeneration of the inferior olives in (d) SCA3 compared to (c) healthy controls. (f) SCA3 brain shows atrophy of the brainstem compared to (e) healthy controls (Rüb et al., 2013).
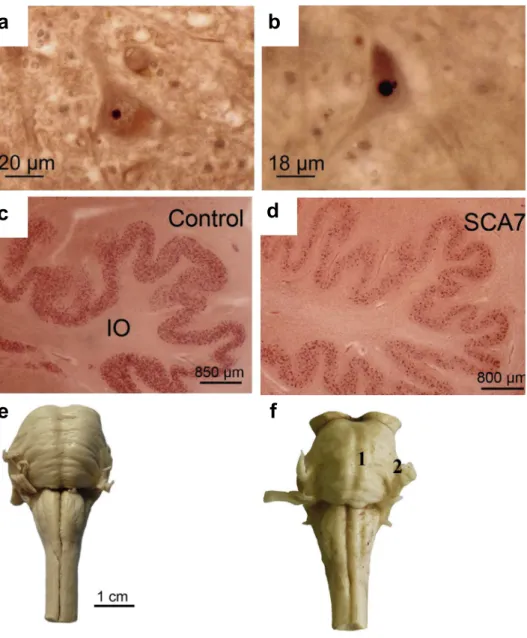
1.2.4 Spinocerebellar ataxia type 7 (SCA7)
Among the dominantly inherited SCAs, SCA7 is uniquely differentiable as the only SCA with retina involvement that may lead to blindness. It is caused by expanded CAG repeats in the short arm of chromosome 3p12–13 where the ataxin-7 gene (ATXN7) gene is located (David et al., 1997). Whilst CAG repeats of more than 37 are considered pathologic, some
a
b
c
d
f
e
individuals can have over 300 repeats, and hence SCA7 has the most unstable CAG repeats (Stevanin et al., 2000; Paulson, 2009; Rüb et al., 2013). Anticipation is therefore exceptionally severe in SCA7, since the very large expansions can cause early onset disease in newborns (Paulson, 2009).
Ataxin-7 is ubiquitously expressed and localized in the cytoplasm and nucleus of neuronal and non-neuronal tissues (Cancel et al., 2000). Some studies have suggested that like other SCAs, it plays a role in transcriptional regulation by functioning as part of transcriptional repressor complexes (Palhan et al., 2005; Strom et al., 2005). In addition, it is associated with histone deubiquitination and mRNA export from the nucleus (Rüb et al., 2013). CAG expansion in ataxin-7 interferes with the normal transcription complexes such as the STAGA transcription coactivator complex. This complex interacts with the cone-rod homeobox (CRX) transactivator that is responsible for the normal function of photoreceptor genes (La Spada et al., 2001). Mutant ataxin-7 impairs the function of glial which may in turn induce degeneration in Purkinje cells (Orr & Zoghbi, 2007). The N-terminal of the mutant protein contains a stretch of polyalanine that is elongated in birth defects and oculopharyngeal muscular dystrophy (Rüb et al., 2013) and hence may play a role in the retinal degeneration observed in SCA7. A study on a SCA7 transgenic mouse model created by inserting 92 polyglutamine cDNA flanked by loxP at the start site of translation in the murine PrP gene in a bacterial artificial chromosome (BAC), led to cerebellar degeneration and loss of Bergamann glia (Furrer et al., 2011). Removal of the 92 polyglutamine ataxin-7 by crossing the transgenic mice with driver lines expressing Cre-recombinase in the Purkinje cells and inferior olive protected against cerebellar atrophy and Bergamann glia pathology. Meanwhile, when the transgenic mice were crossed with driver lines expressing Cre-recombinase in the Bergamann glia, the pathological features were not prevented (Furrer et al., 2011) and thus signify the importance of glia in SCA7 pathology. To understand the mechanism by which mutant ataxin-7 influences retinal degeneration and neurological dysfunction, transgenic mice (SCA7-D266N) with second-site mutation to prevent caspase-7 proteolysis were generated (Guyenet et al., 2015). It was reported that by inhibiting caspase-7 cleavage of the mutant ataxin-7, toxicity and aggregation of ataxin-7 were diminished and the mice lived twice as long with reduced retinal degeneration and neurological dysfunction compared to SCA7 mice (Guyenet et al., 2015). Hence proteolytic cleavage is critical to SCA7 pathology.
Retinal degeneration is unique to SCA7 with characteristic photoreceptors degeneration and damage to the retinal pigment epithelium (Durr, 2010; Rüb et al., 2013). Histopathological examinations have revealed atrophy of the optic pathways, loss of bipolar cells and ganglion cells, degeneration in the cerebellum, brainstem and pyramidal pathway (Yamada et al., 2008). Like the other SCAs, degeneration of the inferior olive is another common occurrence in the SCA7 (Figure 8).
Figure 8: Neuropathological observations in SCA7. Intranuclei inclusion bodies are found
in the (a) facial nuclei and (b) hypoglossal nuclei. (d) The inferior olives are degenerated in SCA7 compared to (c) healthy controls. (f) SCA7 pons are atrophied with loss of traversing pontocerebellar fibers and reduced medial cerebellar peduncle (Rüb et al., 2013).
a
b
c
d
f
e
Affected individuals tend to have decreased visual (83%) and auditory (24%) acuity (Durr, 2010). Affected individuals also present progressive cerebellar ataxia, dysarthria, dysphagia, slow saccades, somatosensory deficits and neuropsychological deficits (Yamada et al., 2008; Durr, 2010; Rüb et al., 2013). Patients with very large CAG repeats are also prone to cardiac failure (Durr, 2010).
1.3 Diagnosis and treatment of polyglutamine diseases
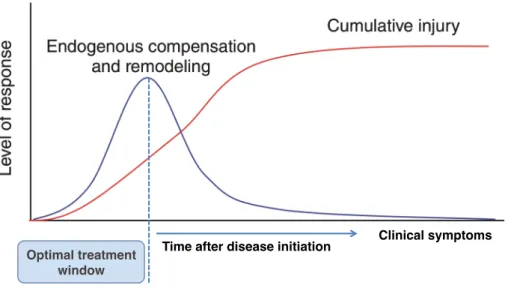
Diagnosis becomes easy when there is a family history of the disease. Persons at risk of HD and SCA might opt to perform genetic testing in order to make critical life decisions such as marriage, career and procreation. At risk individuals with no known family history of the disease might be caught off guard when the symptoms start appearing later on in life and when they have already started a family. The chance for children to inherit the disease with increased early onset is increased by 50% when the disease is inherited from the father (Myers, 2004). Other individuals might opt out of genetic testing due to the lack of treatment for the disease and the emotional burden that accompanies positive results. Anxiety, stress and suicidal tendencies are common with positive test results (Walker, 2007). Extensive genetic counseling could however help at risk individuals overcome the burden with the test. Genetic testing in at risk individuals may open a therapeutic window for potential therapies that could treat the disease (Figure 9).
Figure 9: Genetic testing may offer an opportunity to take advantage of the therapeutic window before symptoms onset. Modified from (Lo, 2010).
Time after disease initiation Optimal treatment
window
Currently, supportive management and symptomatic treatments are given to individuals with HD or SCA. There are treatments for some of symptoms manifested by the disease but there is still the lack of effective treatment for the disease itself. Physiotherapy must be advocated (Ilg et al., 2014; Synofzik & Ilg, 2014), and speech therapy to patients with dysarthria. Anti-choreic and mostly neuroleptic drugs have also been used to treat involuntary movements as well as anxiety and irritability (Walker, 2007; Videnovic, 2013). Such symptomatic treatment and supportive management are helpful and shall be initiated soon when symptoms develop. In the search for disease modifying therapies, most of the studies have been focused on HD. This may be because HD is more common, but since it shares common pathophysiology with SCAs, drugs that are found to be beneficial in HD can become potential candidates for SCAs. Several treatments for HD have been explored but some showed no benefit at all, while in others the risks outweighed the benefits (Lauterbach et al., 1998; Walker, 2007). These standard clinical trials however take several years to perform and many patients are needed in order to see sufficient therapeutic effect (Tabrizi et al., 2012). Since these diseases are rare, enrolling large numbers of patients may not be feasible.
Potential treatments for polyglutamine disorders may either fall under targeting the polyglutamine protein such as gene therapy to reduce to reduce or modify the mutated protein (Labbadia et al., 2012; Olson et al., 2012) or reversing cellular defects such as compensation of key downstream cellular alterations through anaplerotic therapy (Mochel et al., 2010). In order to be able to test potential therapies that seek to amend metabolic dysfunction, methods with high effect sizes are needed to identify robust biomarkers of metabolism. As such, MRI/MRS techniques are the go to methods for exploring HD and SCA biomarkers.
Magnetic resonance (MR) approaches to biomarker identification
1.4.1 Principles of MR
Several macroscopic and microscopic changes occur prior to and after symptoms onset. These changes are easily assessable with MR modalities. MR uses non-ionizing radiation to generate three-dimensional (3D) high-resolution images with high spatial and temporal resolution unlike position emission tomography or ultrasound. In addition, structural, physiological and metabolic information can be measured using MR techniques (Sosnovik & Weissleder, 2007). Due to its effectiveness and ease of use, the past decades have seen an exponential rise in its development (Edelman, 2014).
The human body is made up of different atoms, the most abundant of which is hydrogen
atoms (protons, 1H) due to the body being composed of almost 75% water (H2O). These
protons are in constant motion as they spin around their axis generating an electromagnetic field and therefore they act as magnets that possess North and South poles (dipole). Naturally, these spins are randomly oriented and hence they cancel each other out and not net magnetization is observed. However, due to their spin and charge, they will align and rotate or precess at a given frequency (resonance or Larmor frequency) along the magnetic field of a
large external magnet (B0) (Hunt & Thomas, 2008; Plewes & Kucharczyk, 2012; Vijayalaxmi
et al., 2015). While all magnetic substances align in one direction in the presence of an
external magnetic field, protons may either align parallel to the B0 (spin-up) or opposite to the
B0 (spin-down) (Edelman & Warach, 1993), which represent the lower energy state and
higher energy state respectively. At this point the net magnetization is very low and not readily observed. However, when a radiofrequency (RF) energy generated from additional
oscillating magnetic field (B1) is applied perpendicular to the B0, the spin-up protons absorb
the energy and move into the higher energy state (Bloch, 1946). This energy is released when the spins return to their original state and this induces current in a receiver coil or antenna placed near the measured region. The current induced is the magnetic resonance signal.
During the absorption of the RF energy, the net precession is pushed away from the B0
(Figure 10) depending on the amplitude and duration of the RF pulse (B1) and the angle
between the precessing spins and the B0 field is known as flip angle. With time the net
magnetization (M0) along the B0 begins to recover or relax as the absorbed energy is being
known as relaxation. The time taken to recover 63% of its equilibrium value is known as the
longitudinal relaxation time (T1) (Plewes & Kucharczyk, 2012). Another important relaxation
time that is influenced by the interaction between the spins is the T2 relaxation time. The
applied RF rotates the M0 into the transverse plane (XY plane). The magnetization that is
observed in the transverse plane (Mxy) reflects how much M0 has been pushed and the degree
at which the spins are in phase (Hunt & Thomas, 2008). The precession of the spins in the XY plane induces local currents in receiver coils. A strong signal is generated when the spins are
in phase and also when a large flip angle is used, preferably at 90o. When the RF is turned off,
the interaction of the spins with each other causes them to spin out of phase which leads to a
decline in Mxy (Figure 10). The process of dephasing or fading of the transverse signal is
known as free induction decay and the time it takes for Mxy to completely dephase is called
the transverse relaxation time (T2). Relaxation times are specific to each tissue type thus
Figure 10: Dipole moment and free induction decay. (a) The spins are randomly oriented
and hence generate no net magnetization. (b) They align and rotate at a unique frequency
along an external magnetic field to generate a net magnetization (M0). (c) A RF pulse of same
frequency flips the M0 in the transverse plane and the portion of the M0 in this plane is the
Mxy. (d) When the RF is stopped, the spin-spin interaction causes them to precess out of phase
leading to (e) a decrease in the Mxy whilst the magnetization along the B0 (Mz) is recovered.
(f) Mxy decreases faster than the recovery of Mz (Hunt & Thomas, 2008). (g) Real (Sx) and
imaginary (Sy) parts of FID that correspond to x and y components of the rotating
magnetization vector M0 (Jiru, 2008).
g